Ever wished you could predict the future? With Tableau’s What-If Analysis, that’s not just a dream anymore. This powerful feature allows you to test out different scenarios and see how they could affect your business.
What-If Analysis in Tableau is a feature that lets you create simulations of different scenarios based on your existing data. You can change variables, add new data, and adjust parameters to see how different choices would impact your results.
By enabling you to make informed decisions and prepare for various outcomes, What-If Analysis helps you navigate uncertainty with confidence. This article will show you how to use this feature to enhance your data analysis and make better-informed decisions.

Let’s dive in!

How to Perform What-If Analysis in Tableau
In this section, we will look at how you can perform What-If analysis in Tableau.
Creating a “What-if” analysis in Tableau typically involves using parameters and calculated fields to simulate different scenarios based on certain inputs or assumptions.
For the demonstration of steps, we will use the sample superstore dataset.
Follow the steps given below to make a What-If analysis:
Step 1: Define Your Scenario
The first step is to define your scenario. This step relies on the project or problem that you are working on.

Based on the current dataset, let’s find out how changing the discount rate affects overall profit.
Step 2: Create a Parameter
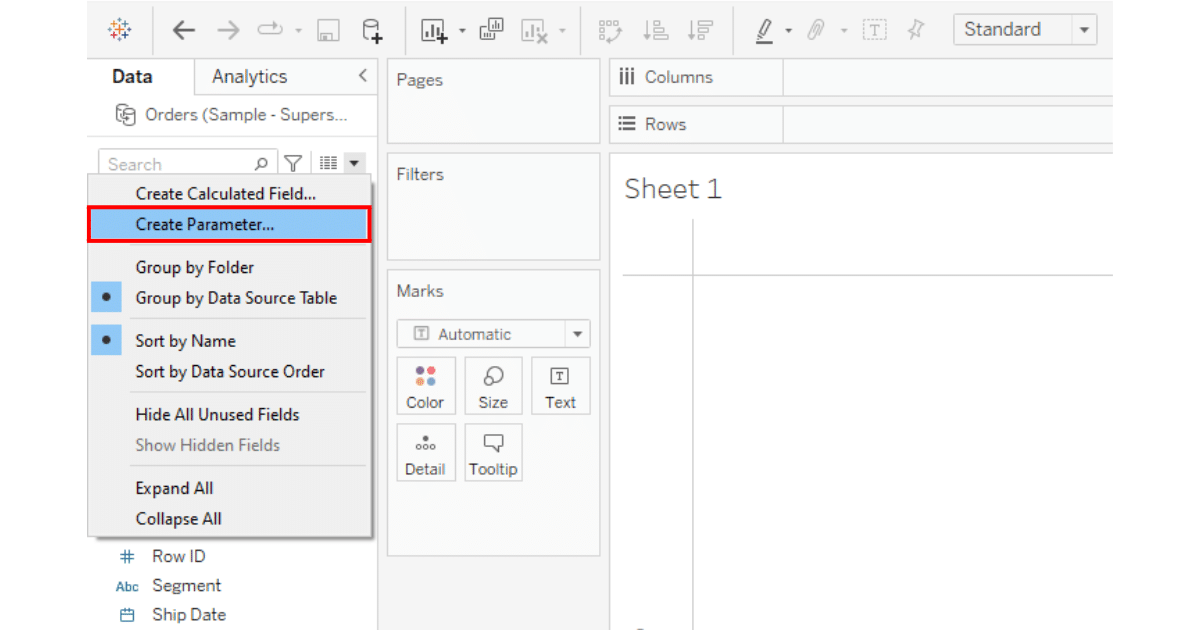
Go to the Data pane.
Right-click and choose “Create Parameter.”
Name the parameter. Set the data type (e.g., Float).
Define the current value, minimum value, maximum value, and step size. You can choose these values according to the specifications below:
Current Value: This is the starting value of the parameter when you first use it. It could be the average or most common discount rate currently applied in your data.
Minimum: The lowest value you want to analyze. In the case of a discount rate, this could be 0% (no discount).
Maximum: The highest value that is realistic for your scenario. For a discount, you might not realistically go beyond 50% or 60%, as very high discounts are uncommon in most retail scenarios.
Step Size: This determines the increment by which the parameter value changes when adjusted. A smaller step size allows for finer adjustments. For a discount rate, a step size of 1% or 5% could be appropriate, allowing you to incrementally increase the discount and see the effect.
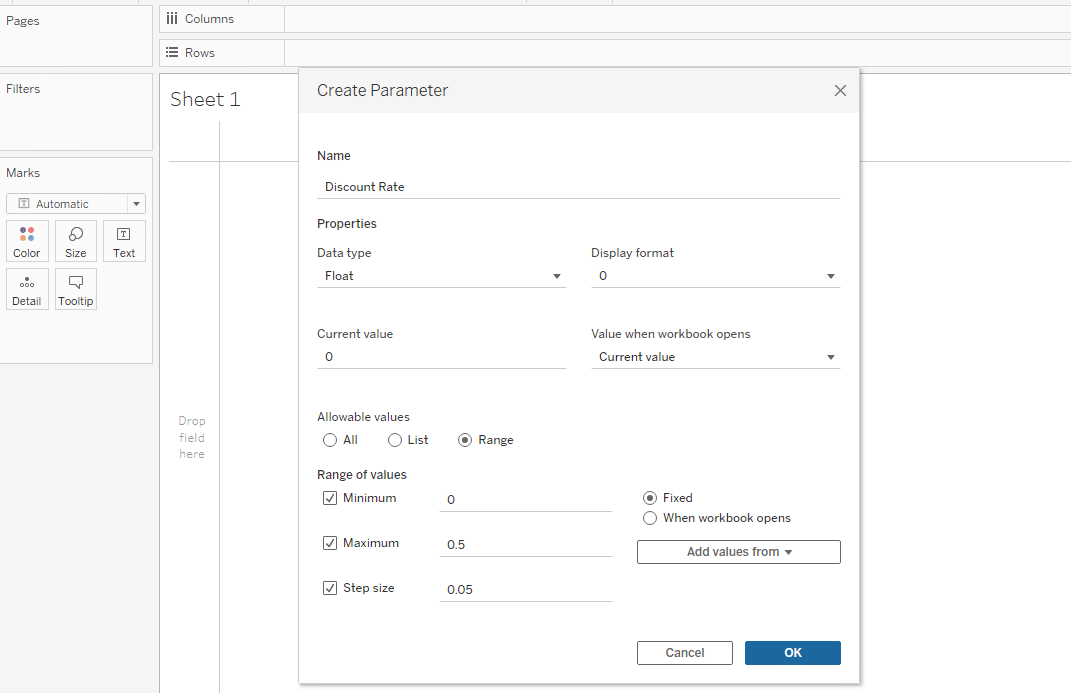
Click OK when done.
Step 3: Create a Calculated Field
Right-click in the Data pane and select “Create Calculated Field.
Name the newly created calculated field (e.g., “Adjusted Profit”).
Write a formula incorporating the parameter.
In our case, we will use the following formula:
SUM([Profit]) * (1 - [Discount Rate])Click “OK.”
Step 4: Create a View
Drag your new calculated field (e.g., “Adjusted Profit”) to the view.
Also, drag any other fields you want to analyze (like “Category” or “Region”) to create a data visualization.
Step 5: Show the Parameter Control
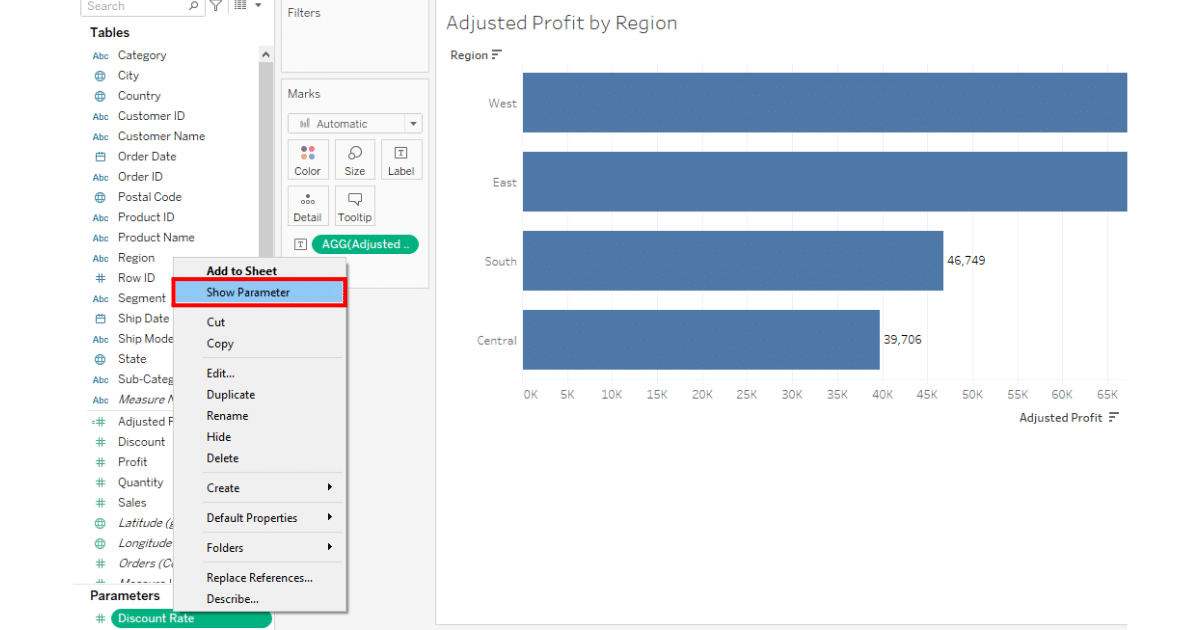
Right-click on the parameter in the Data pane.
Select Show Parameter control.

The parameter control will appear in the view, allowing you to adjust the value interactively.
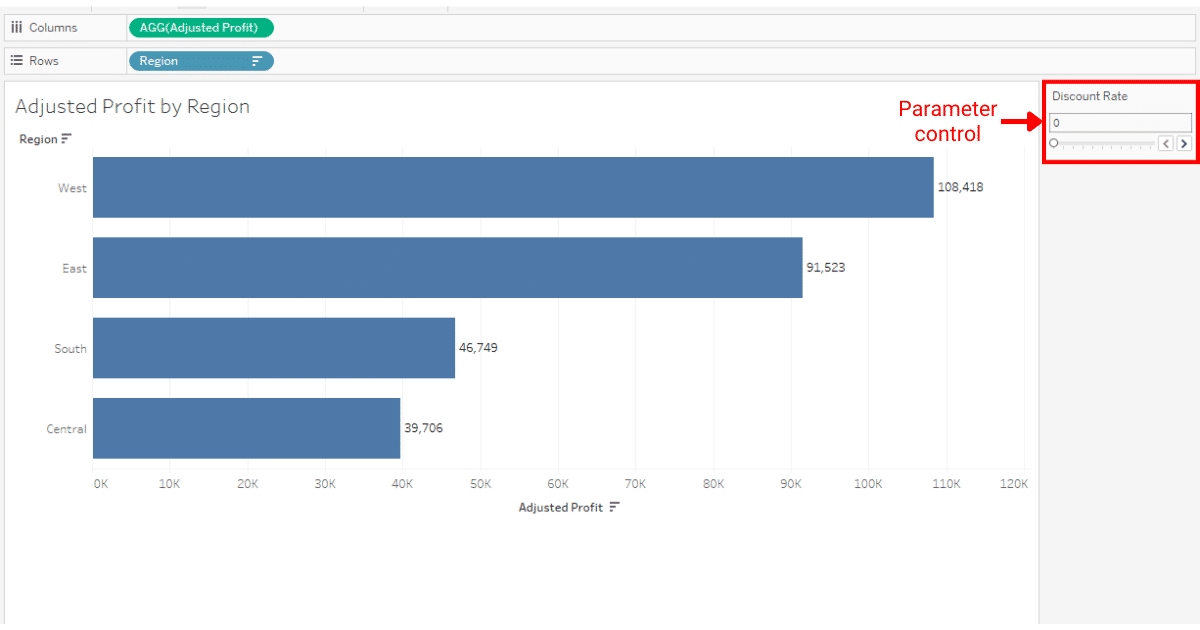
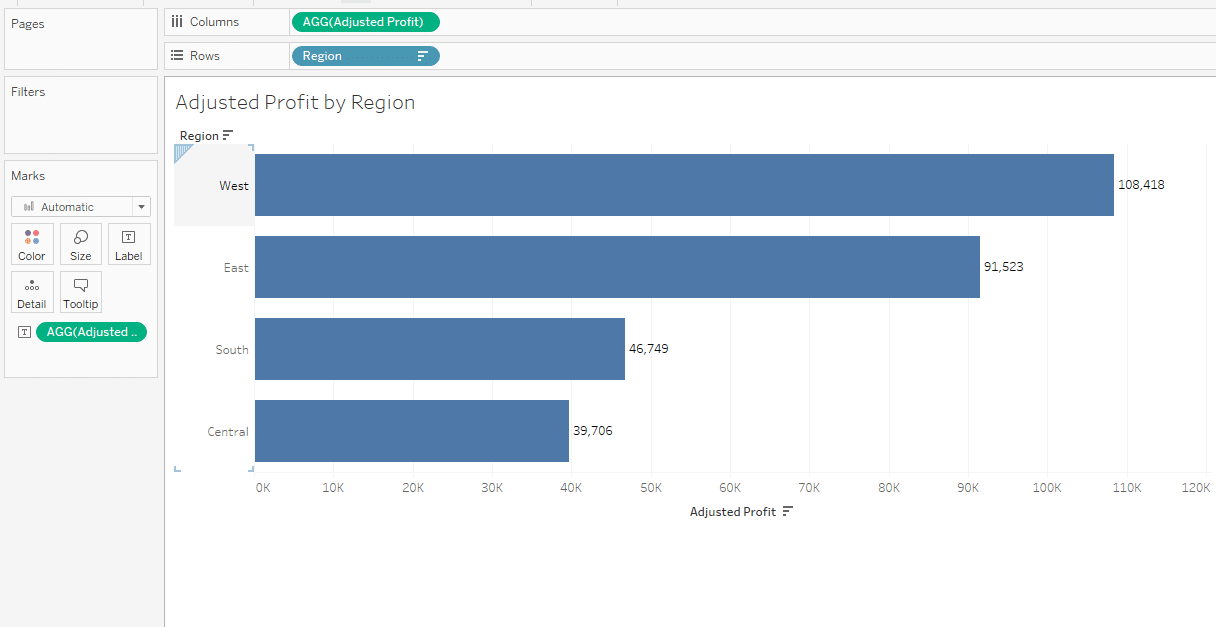
You can now adjust the parameter and observe how it affects your calculated field in the visualization.
In the above view, you can easily find how changing the discount rate affects your Profit, giving you a solid ground for your future decision-making regarding discounts.
Learn how to create demo data using ChatGPT by watching the following video:
Final Thoughts
What-If Analysis in Tableau is a powerful tool that allows you to explore different scenarios and gain valuable insights from your data. It enables you to make informed decisions by simulating various outcomes and understanding their potential impact on your business.
By creating What-If parameters and performing analyses, you can identify trends, patterns, and potential risks, helping you to optimize your strategies and drive success.
So, whether you’re a data analyst, business owner, or simply someone who wants to make data-driven decisions, the What-If Analysis feature in Tableau is a game-changer.
Happy number crunching!
Frequently Asked Questions
In this section, you will find some frequently asked questions you may have when performing a What-If analysis in Tableau.

What are the steps to create a parameter in Tableau?
To create a parameter in Tableau, follow these steps:
Right-click on the Data window in the data pane and select Create Parameter.
In the Create Parameter dialog, enter a name for the parameter and select a data type (e.g., integer, float, date).
Define the range of allowable values for the parameter, as well as any default value, step size, or display format options.
Click OK to create the parameter.
How do you perform a What-If analysis using parameters in Tableau?
To perform a What-If analysis using parameters in Tableau, follow these steps:
Create a parameter for the variable you want to change in your analysis.
Create a calculated field that uses the parameter to perform the desired calculations.
Add the calculated field to your visualization.
Use the parameter control to adjust the variable and observe the changes in your visualization.
What is a What-If parameter in Tableau?
A What-If parameter in Tableau is a user-defined variable that allows you to interactively change a value in your visualization.
This enables you to explore different scenarios and understand the potential impact of those changes on your data.
How to create a dynamic range in Tableau using parameters?
To create a dynamic range in Tableau using parameters, follow these steps:
Create a parameter that will define the range size.
Create a calculated field that subtracts the range size parameter from your desired range end point.
Use the calculated field to filter the data within the desired range.
Add the parameter control to your view and use it to dynamically adjust the range size.
What are the best practices for using What-If parameters in Tableau?
Some best practices for using What-If parameters in Tableau include:
Choose the right data type for your parameter (e.g., integer, float, date).
Define an appropriate range for the parameter based on your data.
Use descriptive names for your parameters.
Document your What-If scenarios and calculations.
Test and validate your scenarios against known data points.
Communicate the results and insights from your What-If analysis clearly.