One of the features that makes Tableau attractive for analysts is its ability to easily create bins – a technique that allows you to categorize continuous measures or dimensions into discrete groups or “buckets.”
In fact…
Bins can help you simplify your data, making it easier to spot trends and detect patterns in your visualizations.

To create a bin in Tableau, you simply need to choose a field, either a measure or a dimension. Next, right-click on the selected field and select Create Bins. A bin specification panel will open where you must specify the parameters for how you want the data to be grouped. You can drag and drop the newly created bin onto the canvas to display it in your visuals.
Throughout this article, we will walk you through the steps on how to create bins and by the end of this guide, you’ll have a solid understanding of how bins work and how you can use them to improve your data analyses and visualizations.
Let’s dive into it!

What Are Bins in Tableau
Before we dive into creating bins in Tableau, let’s go over the basics of it first. (Feel free to scroll on if you have this covered).
In Tableau, “bins” are used to group a set of continuous data into a series of equal intervals or “buckets.”
This is particularly useful when you want to group data that exists on a wide scale into a more digestible format.

For example, if you have a dataset with ages ranging from 1 to 100, instead of visualizing every single age, you might use bins to group these ages into intervals like 0-10, 10-20, and so on.

3 Steps For Creating Bins in Tableau
In this section, we will go over the four steps for creating bins in Tableau.

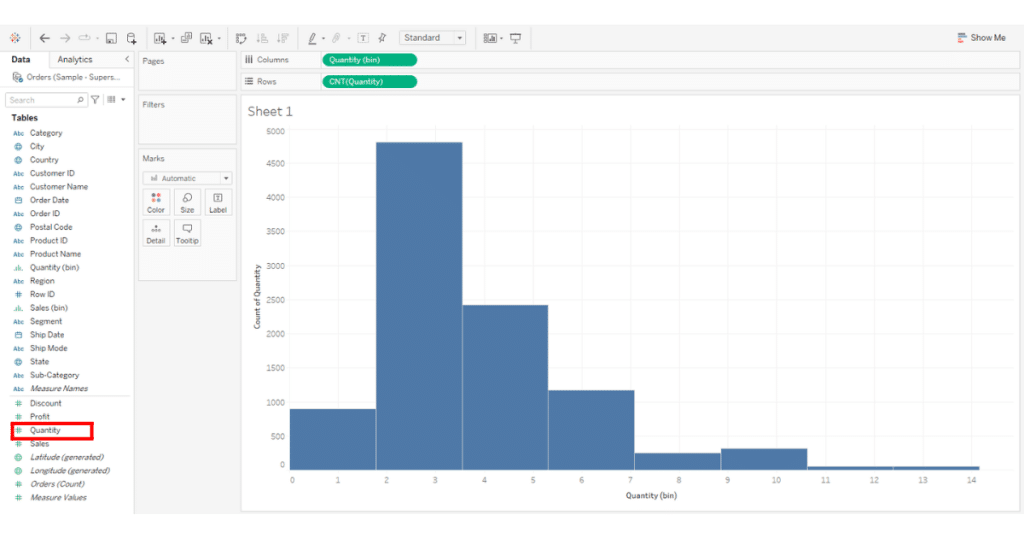
Step 1: Find The Measure to Bin
Once you load in your dataset, you must find a measure you want to bin.
Typically, it will be a measure like age, sales, profit, etc. For demonstration, we will use the Quantity measure to bin.
Step 2: Creating The Bin
To create Tableau bins with your selected measure, right-click on the measure, Quantity in this case, and select Create > Bins.
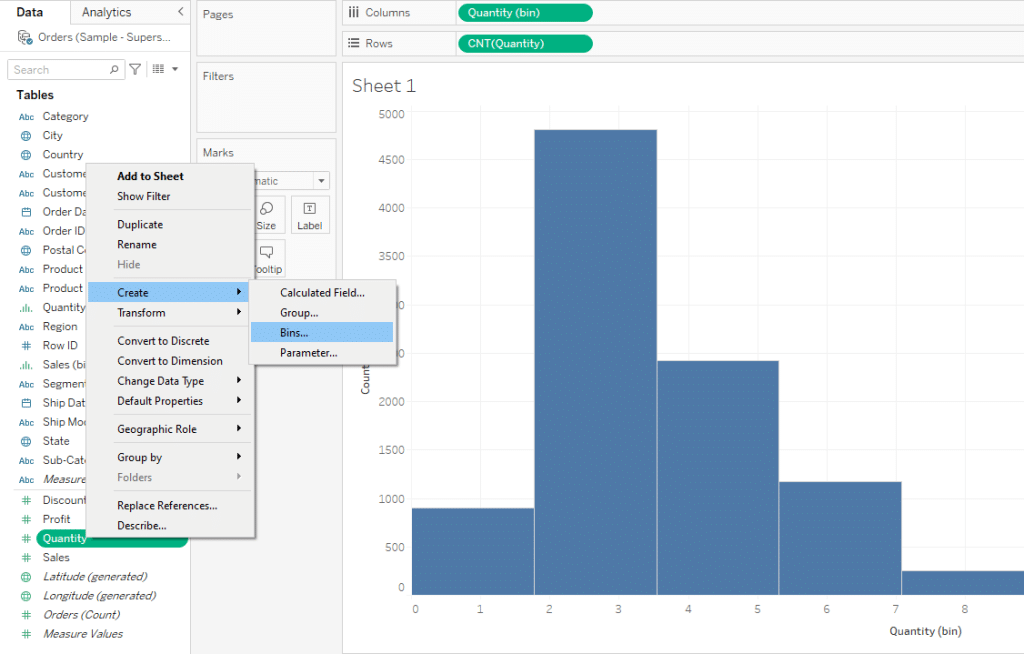
A bin configuration panel will open, where you can set the parameters for your bin.
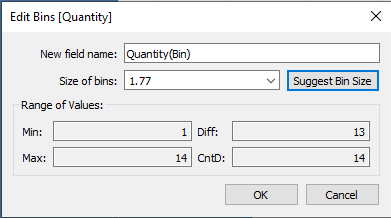
In the panel, you can name your bin and make your own bin size or ask Tableau to come up with a suggested size by clicking on Suggest Bin Size.
You can also choose a systematic data range to store data values, such as minimum and maximum value, difference, and count of difference.
When you are done choosing your bin parameter, click OK to create the bin.
Step 3: Drag The Bin to Canvas
After creating your bin, you must drag it to the columns shelf.
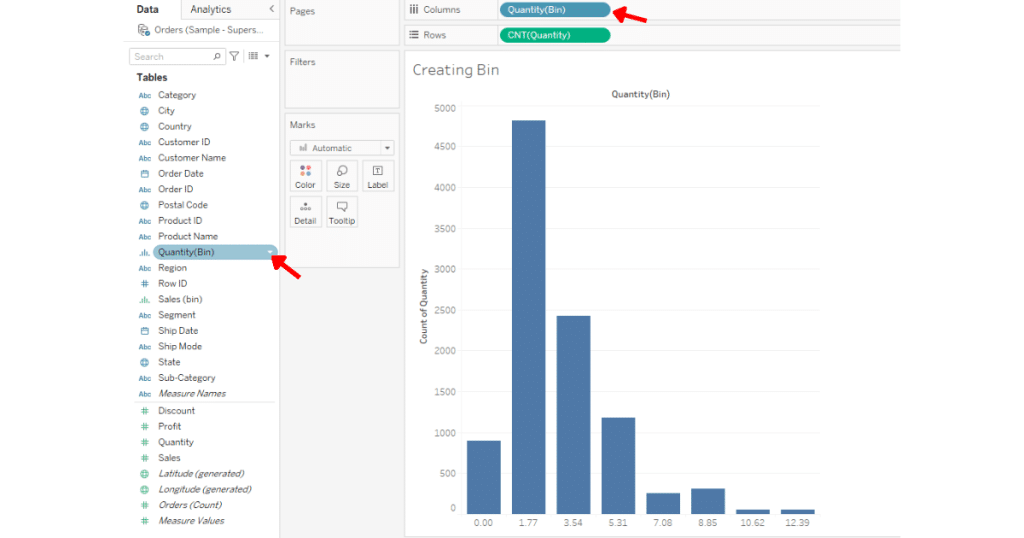
With this, you are done creating bins in Tableau.
If you’d like to delete tableau bins, you can simply right-click on the bin and select delete.
Learn Advanced Data Analytics (ADA) by watching the following video:
Final Thoughts
As you explore data analysis, understanding tools like binning in Tableau can greatly elevate your analytical abilities.
Binning is a transformative technique because it allows you to distill vast amounts of information into comprehensible chunks, making complex data patterns more discernible.

Furthermore, bins allow you to look at the bigger picture.
Actually, using bins can be the difference between a good visualization and an outstanding one.
It allows your audience to understand patterns, trends, and anomalies without getting lost in the granularity of raw data. This clarity is invaluable, especially when making strategic decisions.
Moreover, if you’re aspiring to become an expert in Tableau or any data analytics tool, mastering techniques like binning is indispensable.
Frequently Asked Questions
In this section, you will find some frequently asked questions you may have when making bins in Tableau.

How can I set up custom bins in Tableau?
To set up custom bins in Tableau, first, right-click on the measure or dimension you want to bin in the Data pane. Then, select Create > Bins.
In the Create Bins dialog box, you can specify the size of the bins, and Tableau will automatically create a new field with the binned data values.
What are the steps to make date bins in Tableau?
To create date bins in Tableau, follow these steps:
Right-click on the date field in the Data pane.
Select Create > Custom Date.
In the Custom Date dialog box, choose the date part (e.g., year, quarter, month, etc.) for the bins.
Click OK. Tableau will create a new date field with the selected date part.
How do I adjust the bin size in Tableau?
To adjust the size of existing Tableau bin:
Right-click on the binned field in the Data pane.
Select Edit.
In the Edit Bins dialog box, change the bin size value.
Click OK. Tableau will adjust the bin size accordingly.
What is the process to create a bin histogram in Tableau?
To create numeric bins in histogram in Tableau:
First, create bins from the measure you want to use for the histogram.
Drag the newly created bin field to the Columns shelf.
Drag the original measure to the Rows shelf and choose the COUNT function.
Make sure the mark type is set to Bar.
Adjust the size of the bars and customize the chart as needed.
Can you explain the difference between groups and bins in Tableau?
Groups in Tableau are used to categorize discrete dimensions by combining related members into a single group.
Bins are a way to create smaller intervals from continuous measures, making it easier to analyze and visualize the data distribution.
How can I use dynamic bins in Tableau?
Creating Tableau bins that are dynamic has the following steps:
Create a parameter for the bin size, with the desired minimum, maximum, and step values.
Right-click on the measure to bin and select Create > Calculated Field.
In the calculation, use the INT([your measure]/[your parameter]) * [your parameter] formula to create dynamic bins based on the parameter value.
Add the new calculated field to your visualization as needed. Users can now change the bin size dynamically using the parameter control.