You can add filters to your dashboard to allow for better control and interactivity with your data. This is especially useful when you’re presenting your work to an audience, as it allows them to explore the data on their own.
To add a filter to a dashboard in Tableau:
Create a filter using any of the available methods in Tableau, such as dragging a field onto the Filter shelf or right-clicking on a field and selecting “Show Filter.”
Go to the dashboard where you want to apply the filter.
Drag the filter onto the dashboard and position it where you want it to appear.
In this article, we’ll go over how to add filters to your Tableau dashboard. Each step will be followed with examples to help you better understand the concepts.

Let’s rock and roll!

What Are The Basics of Filters in Tableau
Before we jump into adding filters to a dashboard in Tableau, let’s first understand the basics of filters, their different types, and how you can create them.
Once we are done reviewing the basics, we will move towards adding the filters to your dashboard.
In this section, we will cover:
Types of Filters in Tableau
Applying Filters to Data in Tableau

1. What Are The Types of Filters in Tableau
There are several types of filters you can use in Tableau, each with its specific purpose.
Some of the most common filter types include:

a. Dimension Filters
These filters are used to filter the data based on the dimension values. They can be applied to discrete or continuous dimensions.
For example, you can filter a list of countries to only show sales data for a specific country.
b. Measure Filters
Measure filters are used to filter the data based on measure values. You can apply measure filters to any continuous measure in your data.
For example, you can filter sales data to only show values above a certain threshold.
c. Context Filters
Context filters are applied before other filters in the view, affecting the calculation of all other filters in the view.
Using context filters can improve performance when working with large data sets.
d. Extract Filters
Extract filters allow you to filter the data before creating an extract, which can reduce the size of your data set and improve performance.
e. Top N Filters
Top N filters allow you to display the top or bottom N items in your data based on a measure. With this filter, you can have different distribution units in your visualization as well.
This can be useful when you have multiple values such as the top products, customers, or sales values.

2. How to Apply Filters to Your Data
After you connect to a data source, you can apply filter to it.
To apply a filter to your data in Tableau, you can use the filter shelf or the quick filter option.
a. Filter Shelf
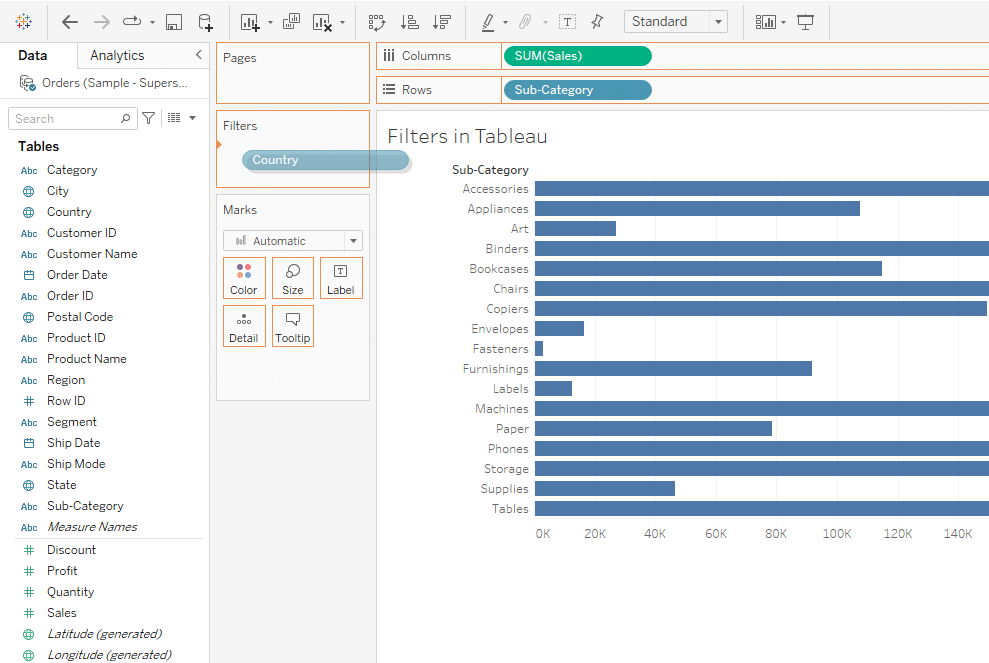
You can apply a filter to your view by dragging a dimension or measure to the filter shelf.
After you are done creating your desired visual, drag a dimension or measure of your interest and drop it onto the filter shelf.
Right-click on the element in the filter shelf and click on Show Filter. The filter appears next to your horizontal bar chart.
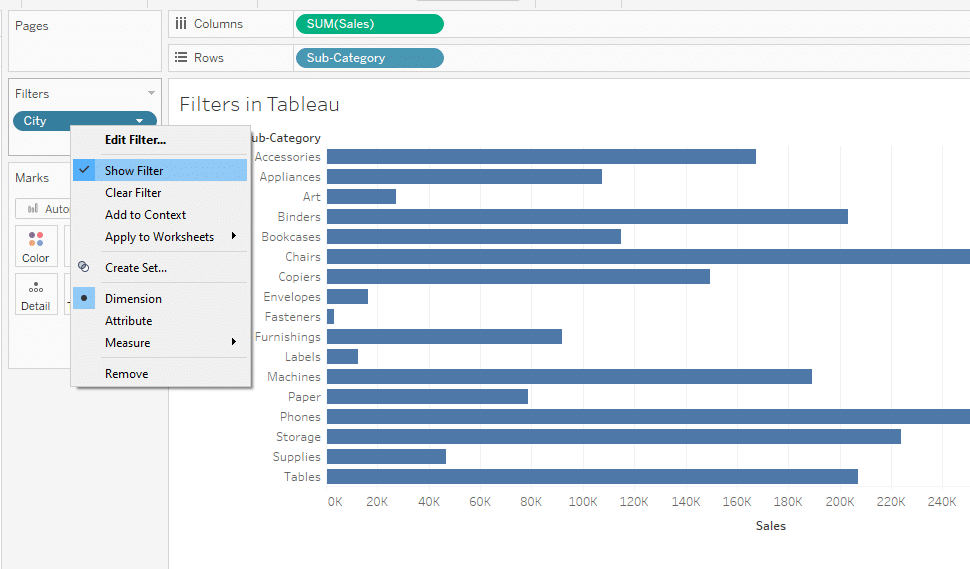
This will create a filter that allows you to include or exclude specific values from the view.

b. Quick Filters:
Quick filters are interactive filters that allow users to change the filter values directly in the view.
To create a quick filter, right-click on a dimension or measure and select “Show Filter.”
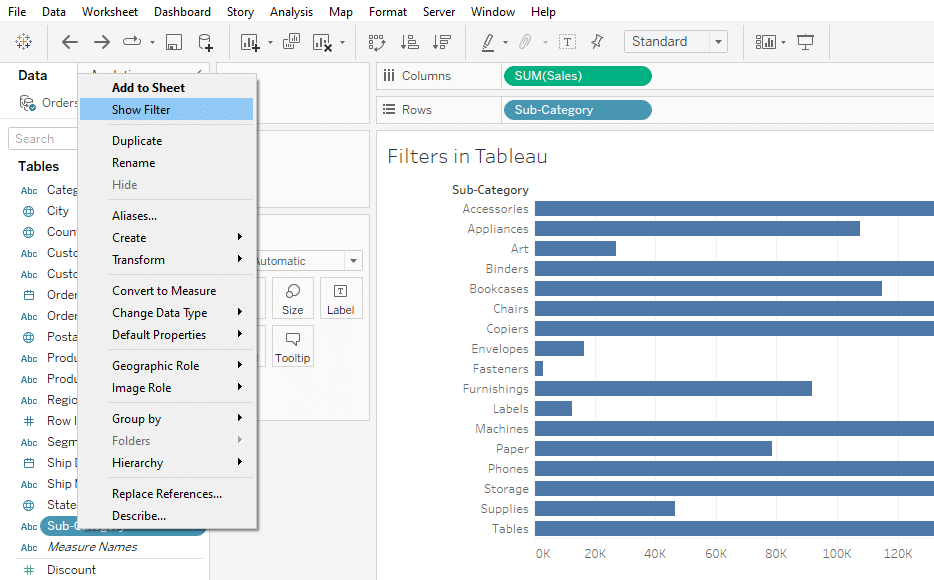
This will create a filter card next to your visualization as shown below:
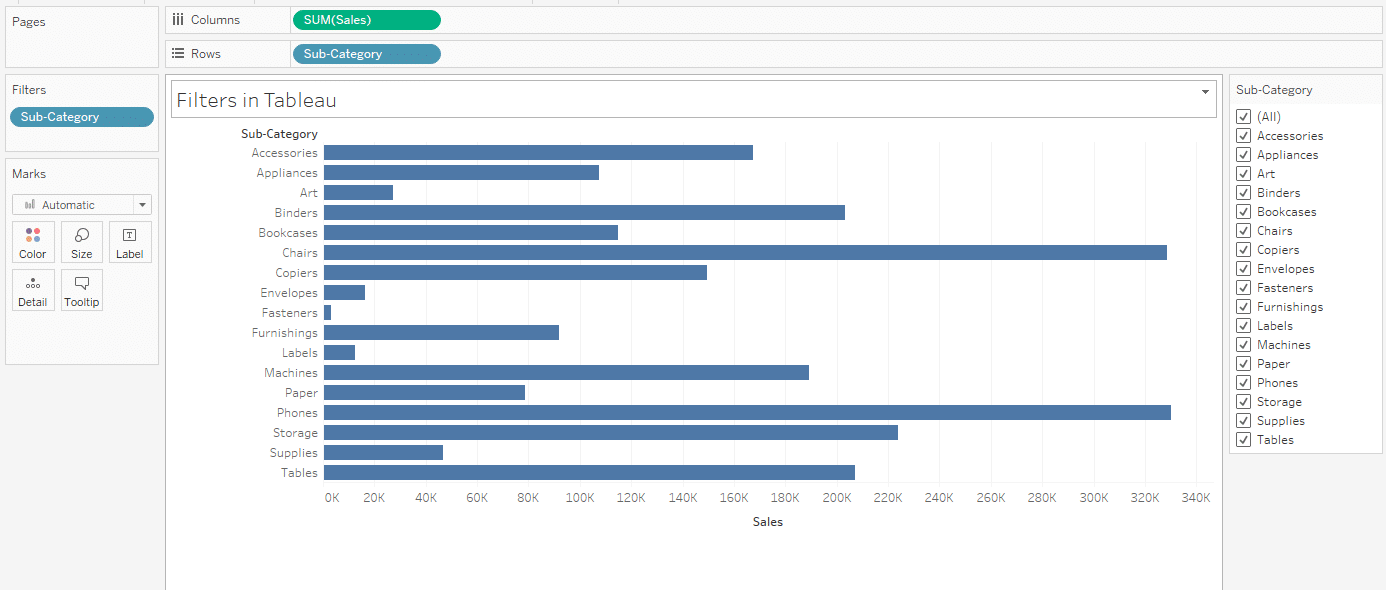
You can select filter based on your project requirements.
How to Add a Filter to a Dashboard in Tableau
Once you’ve created a filter for your worksheet using any of the methods discussed in the previous section, you can easily add it to Tableau dashboards.
Follow these steps to add a filter to your Tableau dashboard:
Step 1: Create a Filter
The first step is to create a filter for your worksheet. You can do this by dragging a dimension or measure to the filter shelf, or by right-clicking on a field and selecting “Show Filter.”
For a detailed explanation of this step, refer to the previous section.
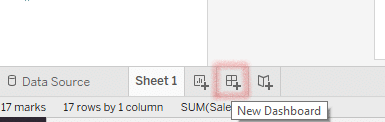
Step 2: Navigate to the Dashboard
After you have created the filter for your worksheet, you can add it to a dashboard by navigating to the dashboard.
To do this, click on the “Dashboard” tab located at the bottom of the Tableau interface. This will create a new dashboard where you can add your visualizations.
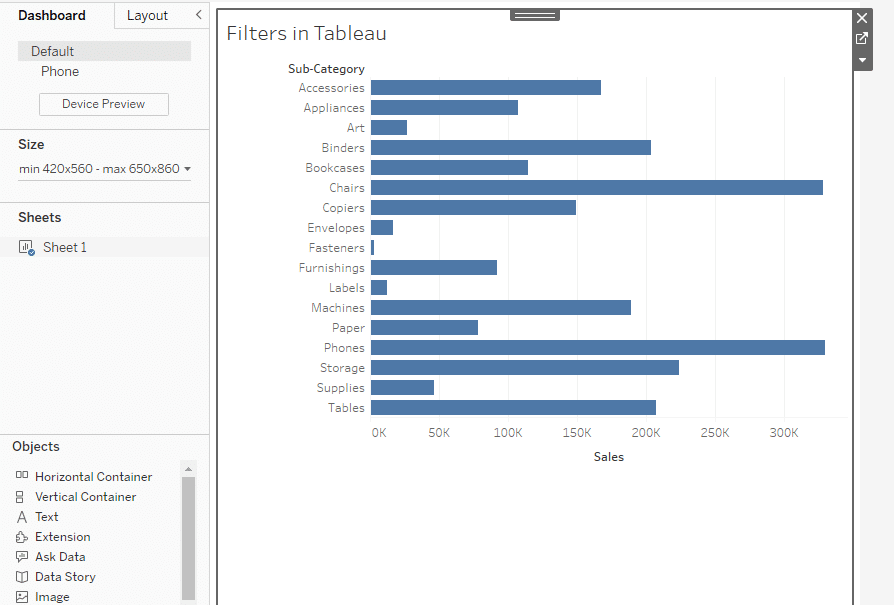
Step 3: Drag the Visualization to Your Dashboard
Once you are in the dashboard view, you can drop sheets to your dashboard.
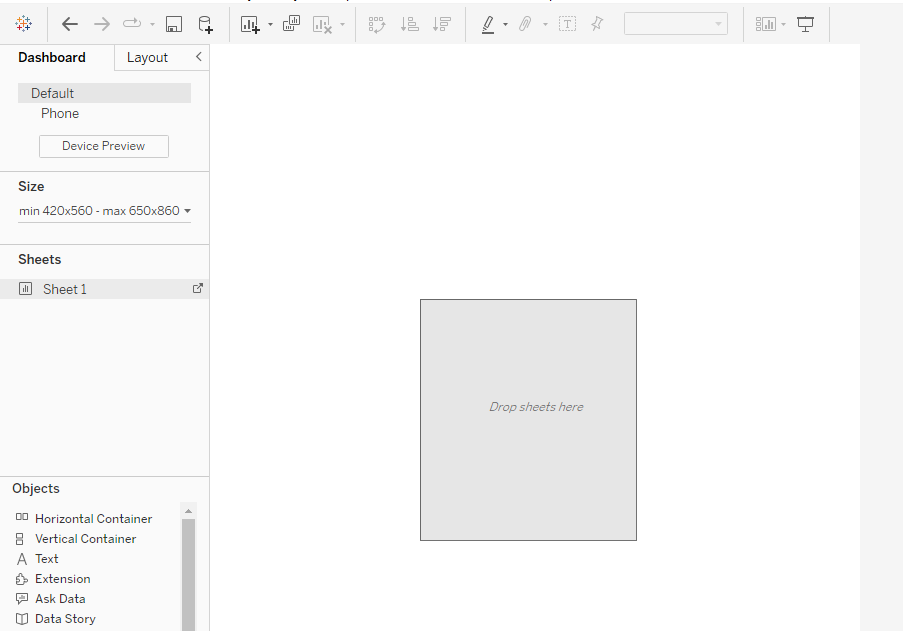
You can repeat the same process for all the sheets that you have created.
This will add the visualization to the dashboard as shown below:
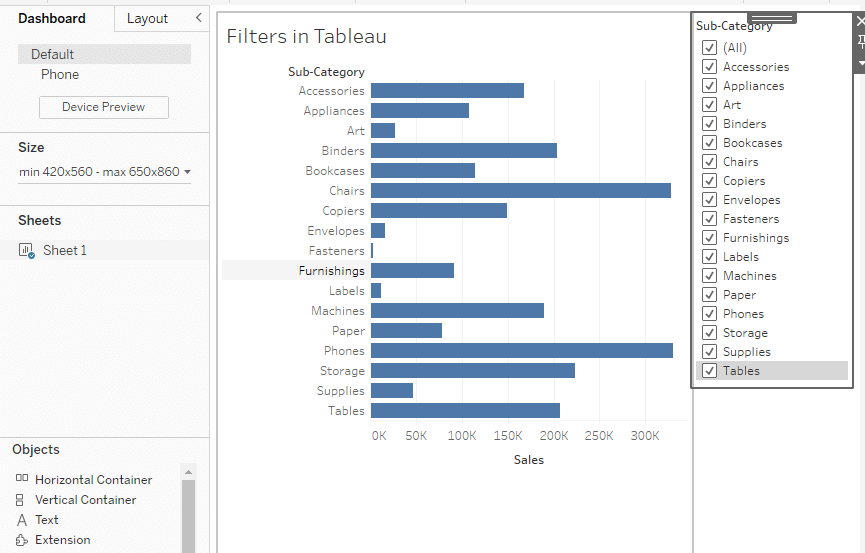
Step 4: Showing the Filter
To show the filter on your dashboard, click on the drop down menu next to your visualization, select Filters, and then click on your desired filter to add to the dashboard.
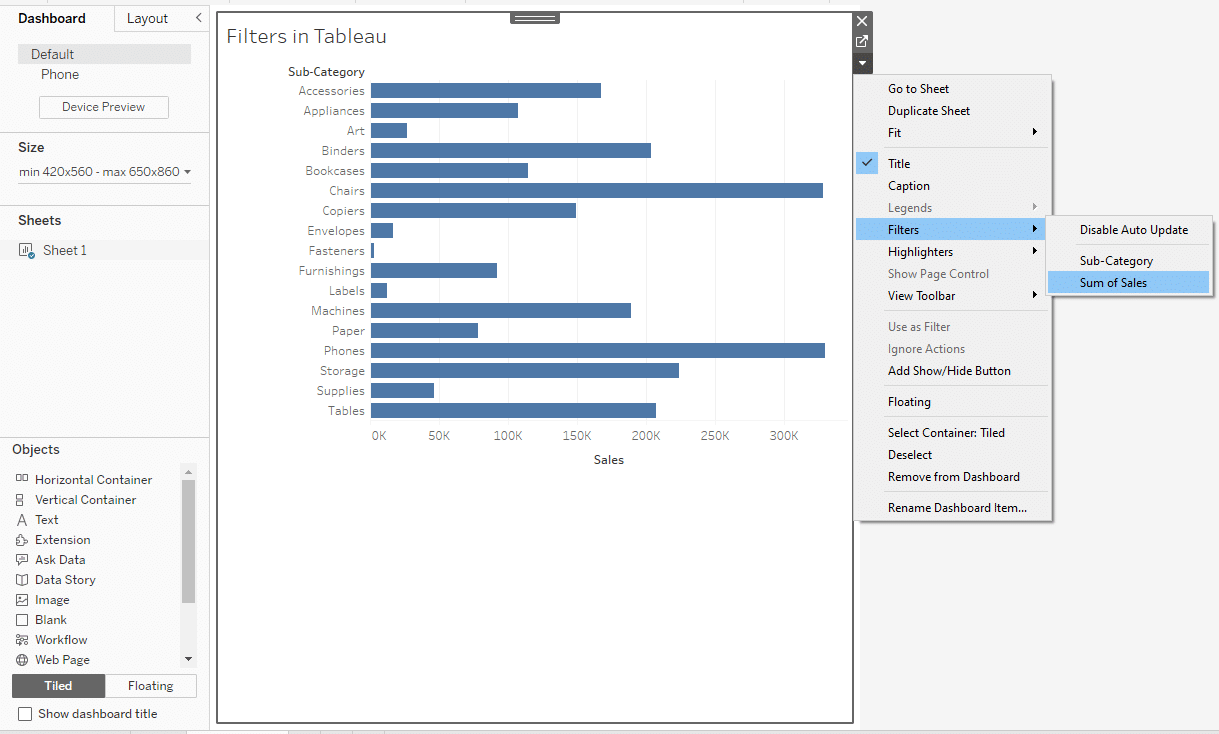
This will add the filter to your dashboard as shown below:
Learn Advanced Data Analytics (ADA) from OpenAI by watching the following video:
Final Thoughts
Adding filters to your Tableau dashboard allows you to tailor the information presented to your specific needs. It also empowers you to explore and interact with your data more effectively.
By understanding the different types of filters and how to apply them, you can create more dynamic and insightful visualizations.
As you continue to work with Tableau, the ability to add and customize filters will prove to be an essential skill. It will enhance the overall usability and impact of your data presentations. Filters have applications in a range of data science and business analytics use cases.
Frequently Asked Questions
In this section, you will find some frequently asked questions you may have when adding filters to a dashboard in Tableau.


How do you apply multiple filters to a Tableau dashboard?
To apply multiple filters to a Tableau dashboard, simply create separate filter objects for each field you want to filter and place them on the dashboard.
You can then use these filters independently or in combination to refine the data displayed in your dashboard.
What are the different filter types in Tableau?
Tableau offers various filter types, including:
Dimension filters: Filter data based on discrete dimensions
Measure filters: Filter data based on continuous measures
Top N filters: Show the top or bottom N items in a dimension
Relative date filters: Filter data based on a range of dates relative to the current date
Hierarchical filters: Filter data using multiple levels of a hierarchy
Context filters: Filters that affect the data in other filters and calculations
How can I add a filter to a dashboard using a parameter?
To add a filter to a dashboard using a parameter, first, create a parameter based on the field you want to filter.
Then, apply the parameter to your visualization as a dynamic filter.
Finally, add a parameter control to your dashboard, allowing users to interact with the parameter and adjust the filter as needed.
How do you make a filter display relevant values in a Tableau dashboard?
To make a filter display relevant values in a Tableau dashboard, use the “Only Relevant Values” option in the filter settings.
This will ensure that the filter only shows values that are relevant to the data currently displayed in your visualization.
Can I create a custom filter in Tableau?
Yes, you can create custom filters on the Tableau desktop by using calculated fields or table calculations.
This allows you to define custom logic for adding filters to your data based on various conditions or calculations.
What is the process for adding a filter to a Tableau dashboard using a hierarchy?
To add a filter to a Tableau dashboard using a hierarchy, simply create a hierarchy filter object by dragging the desired hierarchy onto the filter shelf.
You can then use this filter to display and interact with your data at different levels of the hierarchy.