One of the key features that sets Tableau apart from other data visualization tools is its support for calculated fields.
By using Tableau calculated fields, users can take full control of their analysis and answer questions that may not be possible with the base data alone.
Calculated fields allow you to create new columns based on existing data in the data source. To create a calculated field in Tableau, you’ll need to define a custom formula which can be done using various functions, operators, and expressions provided by Tableau.


After understanding calculated fields in Tableau, you’ll find that they are a valuable feature that enhances the data analysis process.
They enable you to create new and relevant data by applying custom calculations to existing data points and leveraging them in their visualizations.
Let’s dive into the details of how Tableau calculated field works.
What are Dimensions and Measures in Tableau
To effectively build Tableau calculations, it is essential to grasp the distinction between dimensions and measures.

Tableau aids in this understanding by using colors to identify different types of data in the data pane and pills. Blue is designated for discrete values, representing dimensions, while green signifies continuous values, indicating metrics or measures.
Dimensions: Depending on the type of the field (text, date, even number can be discrete) you can apply different functions, like string functions to manipulate text or string data, or to work with date and time data.

Measures: Measures are fields in your data source that represent quantitative values, such as sales numbers, profit, or costs. Calculated fields often involve the manipulation of existing measures, by applying aggregation functions (e.g., sum, average) or other mathematical operations.
How to Create a Calculated Field
Creating calculated fields in Tableau is crucial for generating deeper insights and customizing your visualization to answer specific questions.
To build a calculated field, follow these steps:
1) To create a calculated field, start by opening Tableau Desktop and connecting to your data source.
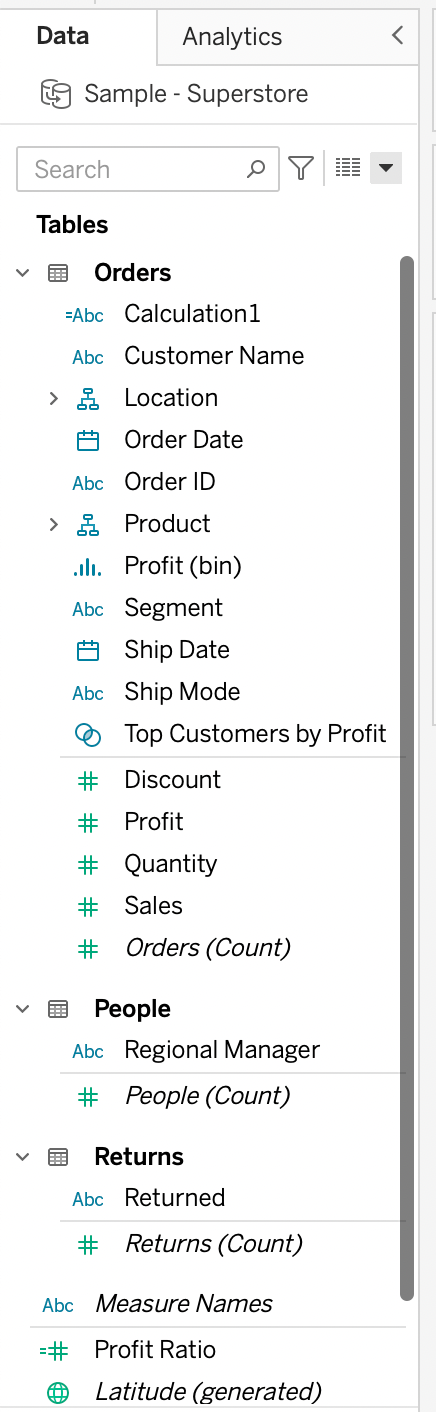
Once your data is loaded, navigate to the data pane where you will find the list of available dimensions and measures.
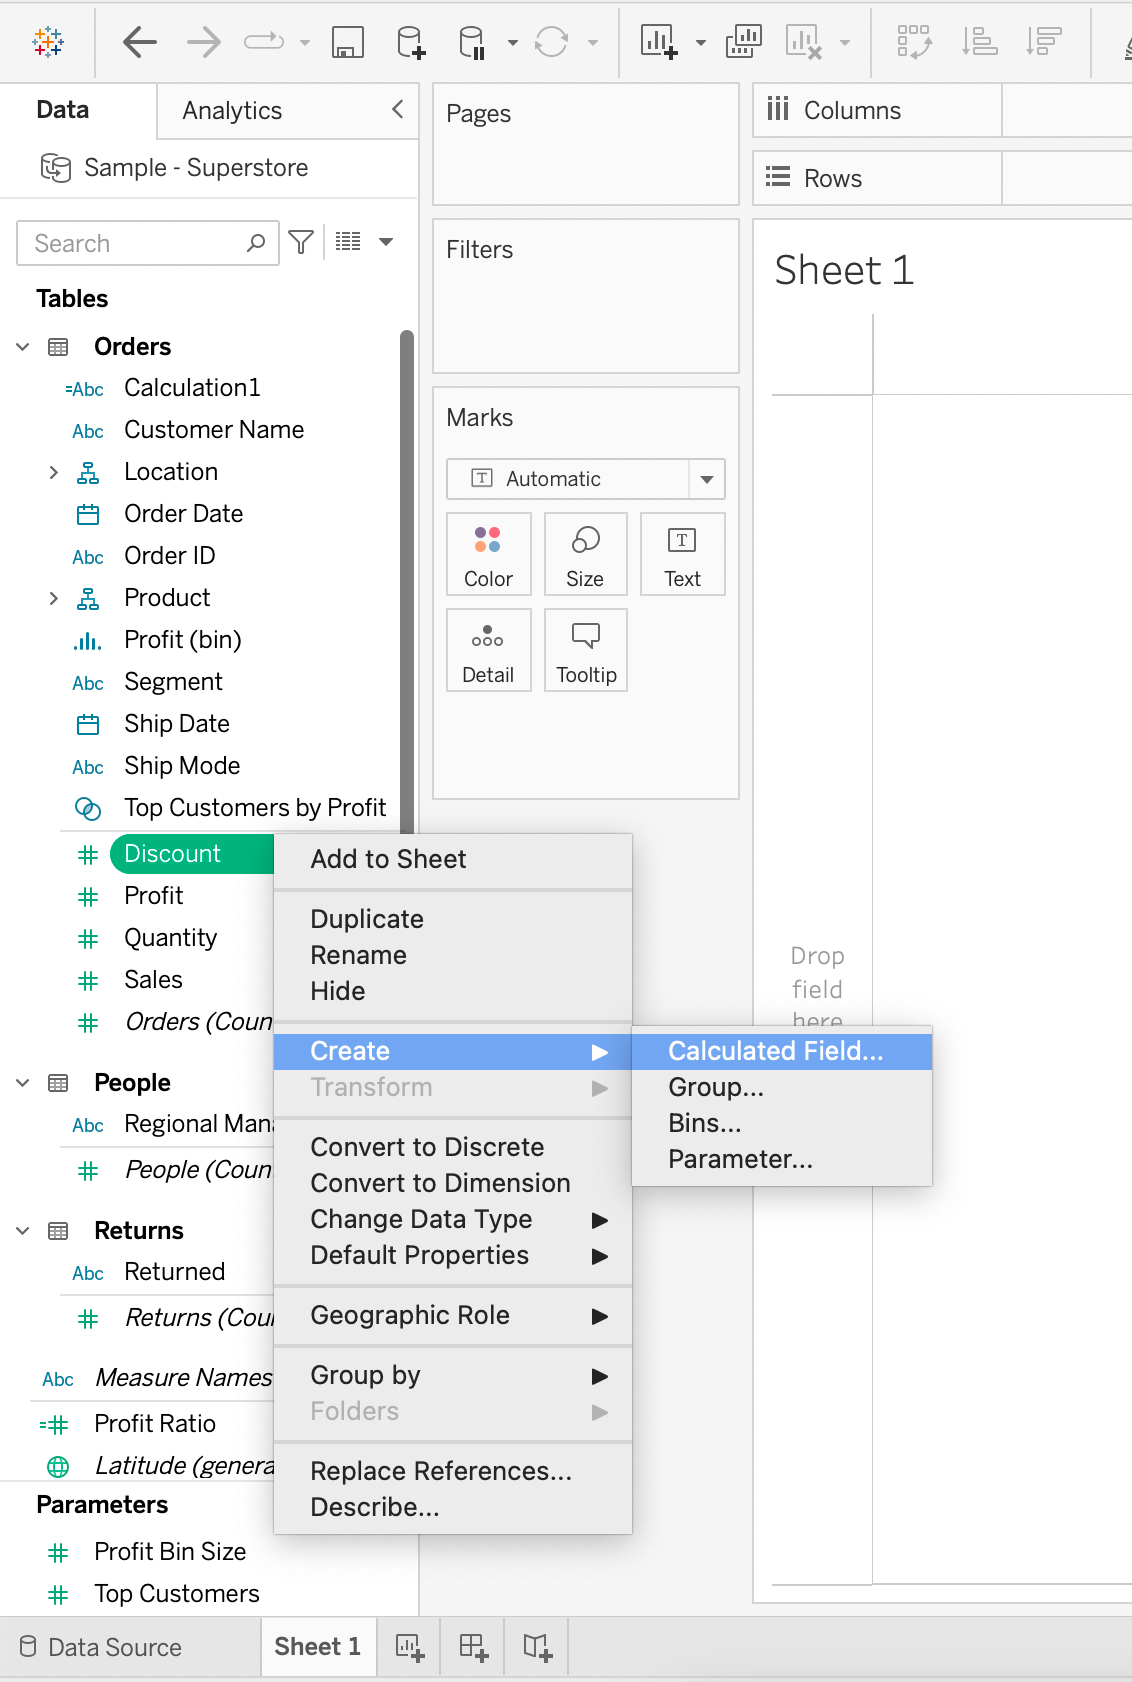
2) Right-click on an existing field in your Tableau data panel, and select “Create Calculated Field.
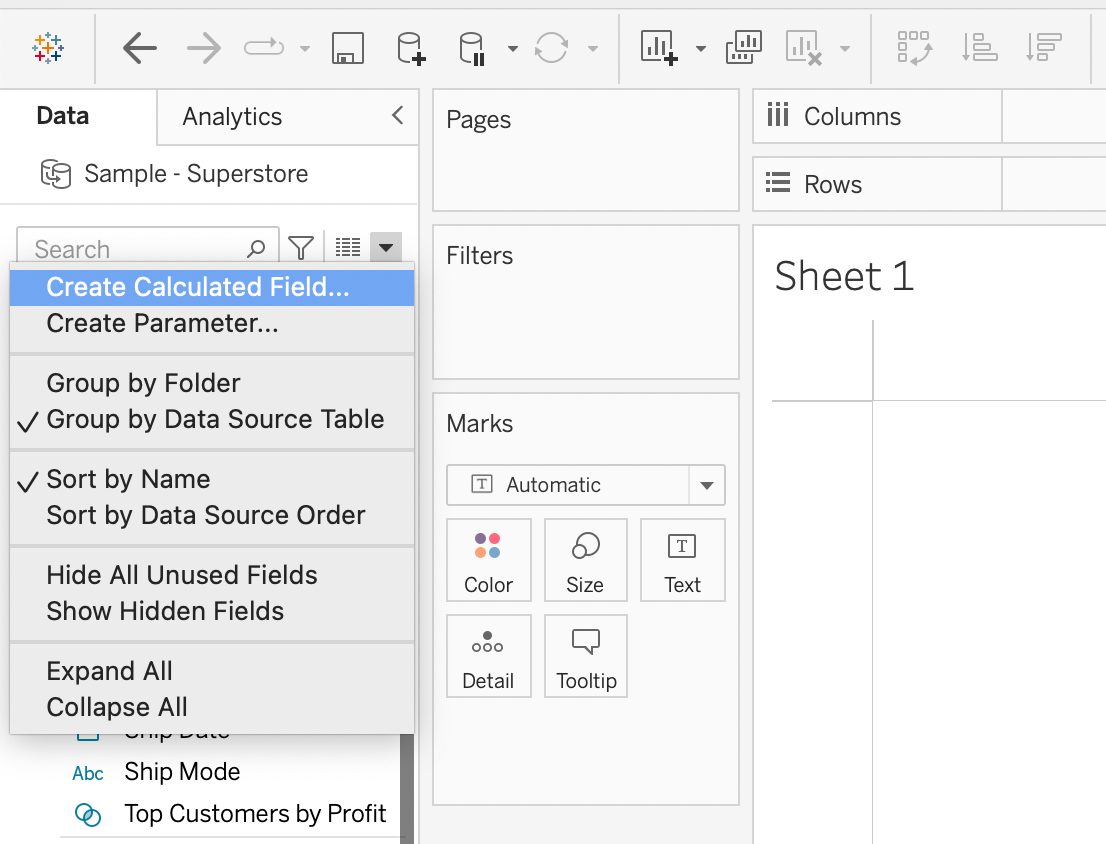
Alternatively you can click the down arrow at the top right corner of the Dimensions shelf and select “Create Calculated Field”.
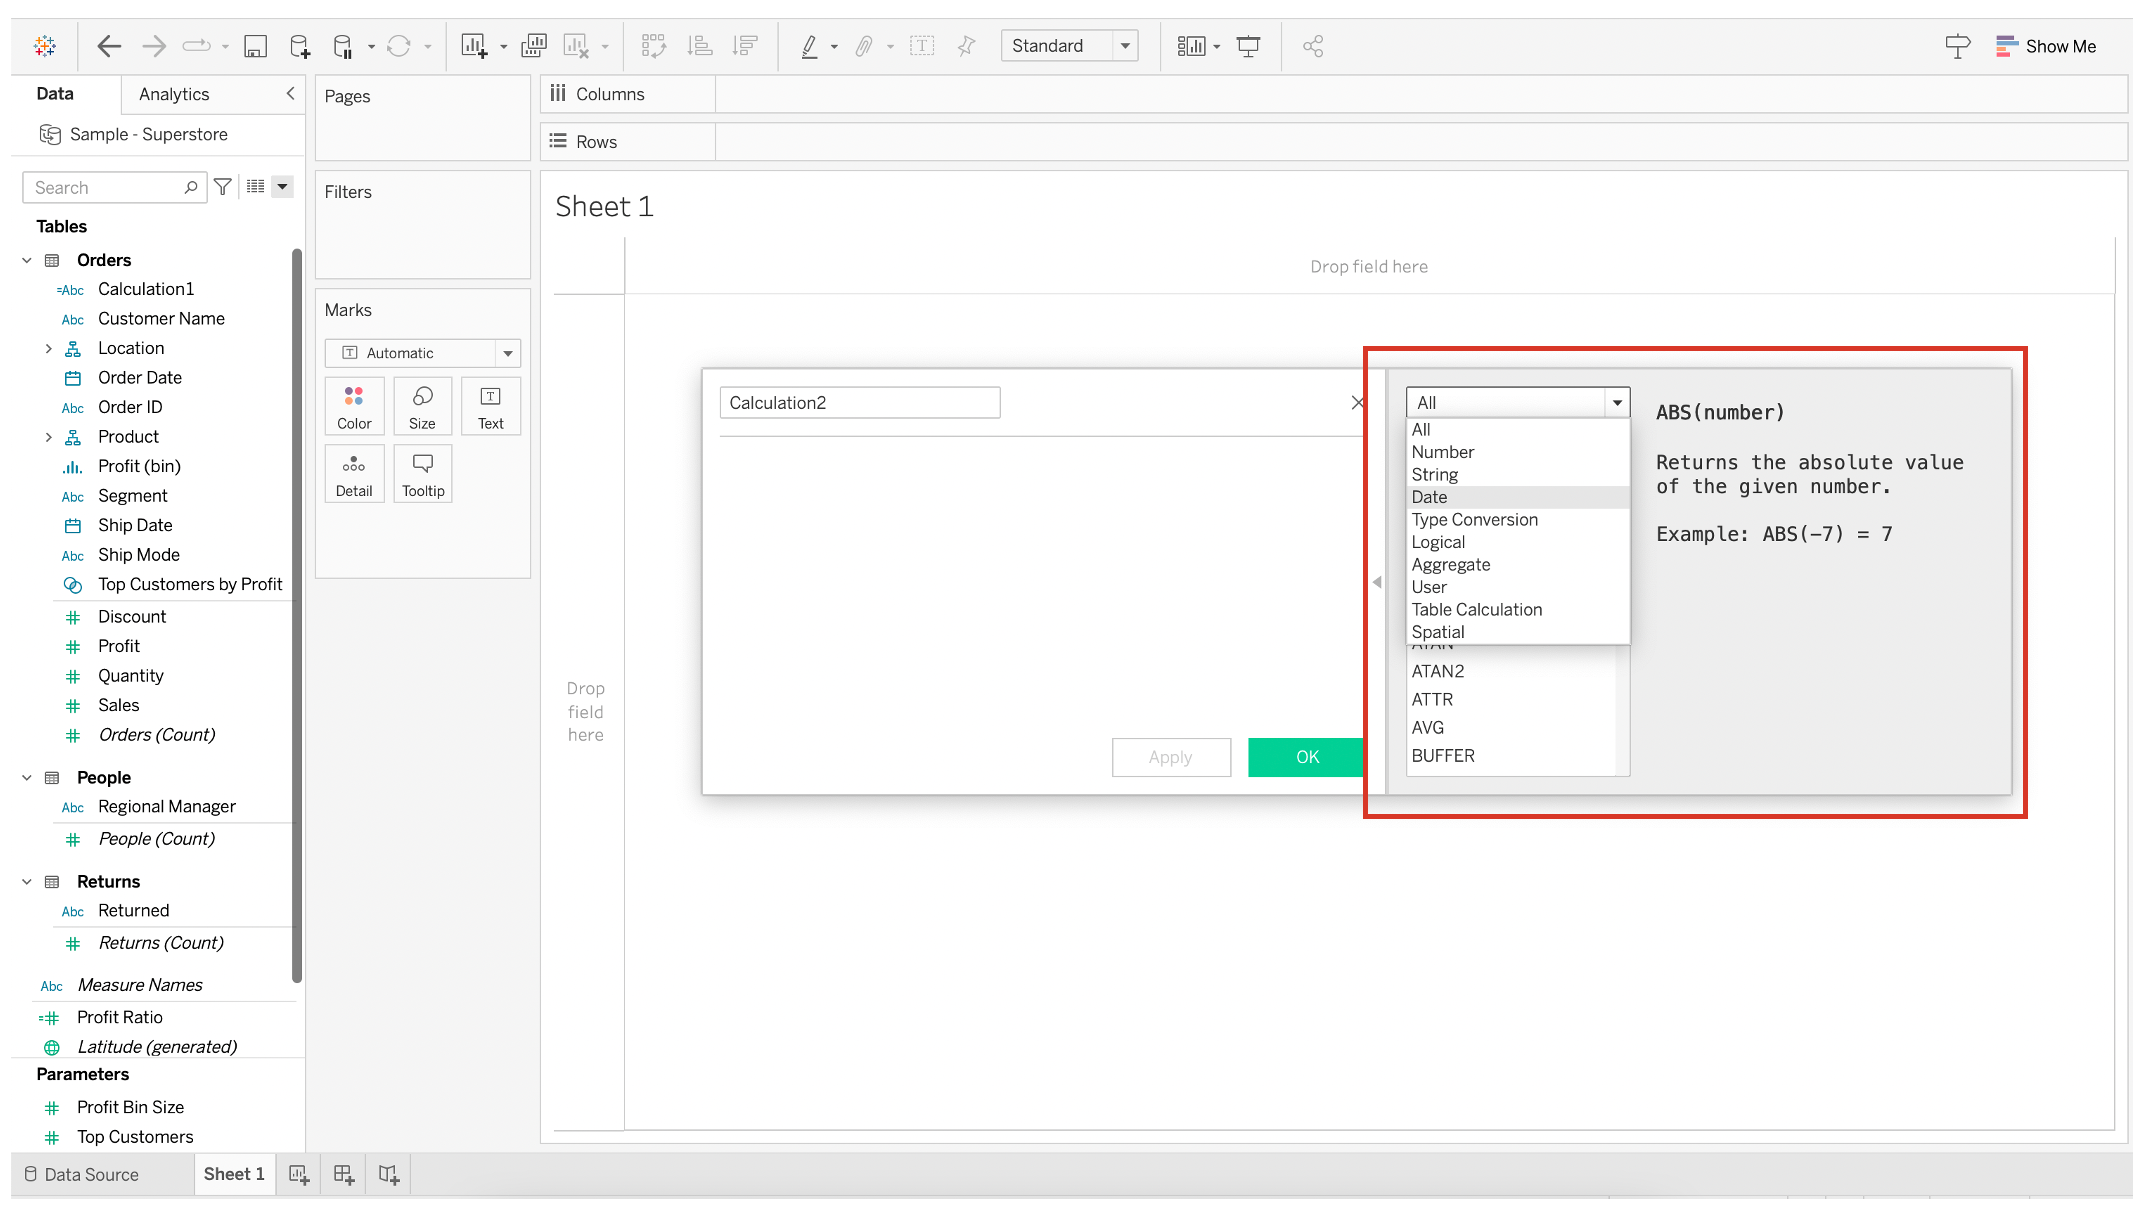
3) When you’re ready to create a new calculated field, launch the Calculation Editor.
This will open a window where you can enter your formula, add comments, and give your new field a name.
In the calculation editor, define your formula using existing fields, functions, and operations.
Tableau provides an array of functions and operators to manipulate data, including arithmetic, logical, date, and aggregation functions.
4) Ensure that your formula is accurate before saving the new field.
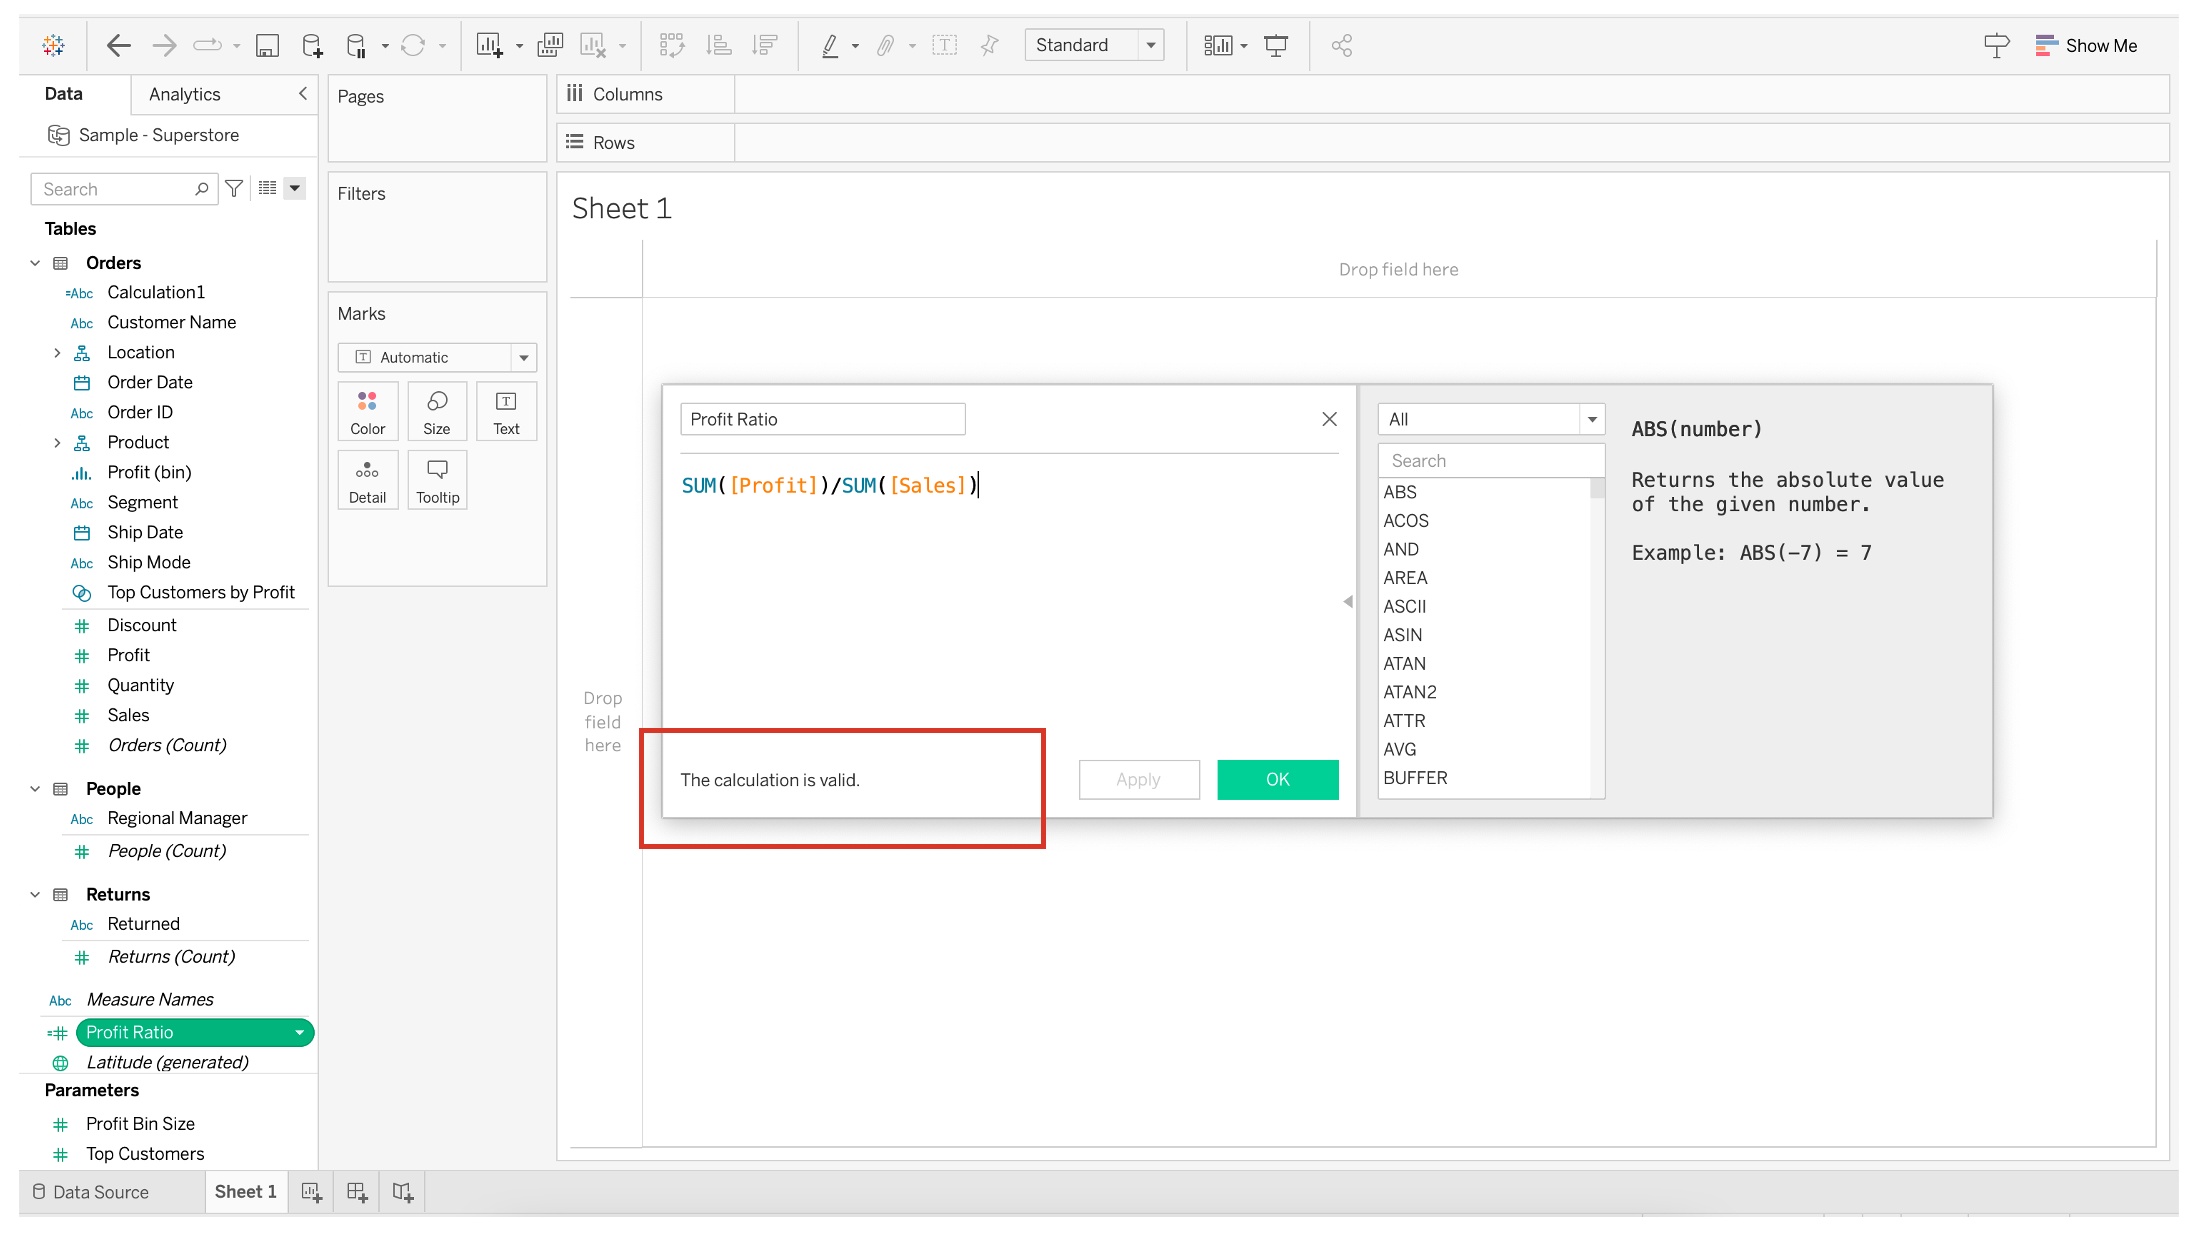
For example, to calculate the profit ratio in a Sample Superstore data source, you might use the following formula:
SUM([Profit])/SUM([Sales])This formula sums all the profit figures, sums all the sales figures, and then calculates the ratio between the two totals.
The order of calculation is essential: first, sum the values, and then perform the division. We will delve deeper into this concept later in the article.

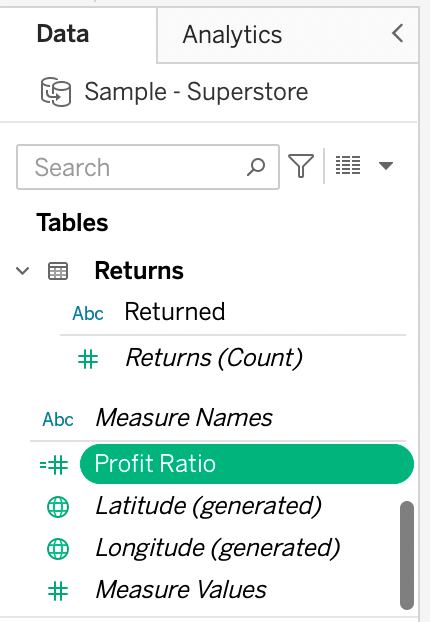
5) After your calculated field has been created, it will appear in the data pane under the Measures or Dimensions section, depending on the data type of the calculation.
You can easily distinguish calculated metric by the icon- the are equal signs preceding the icon connected with particular data type. Now You can easily drag and drop this field to your visualization.
How to Edit a Calculated Field
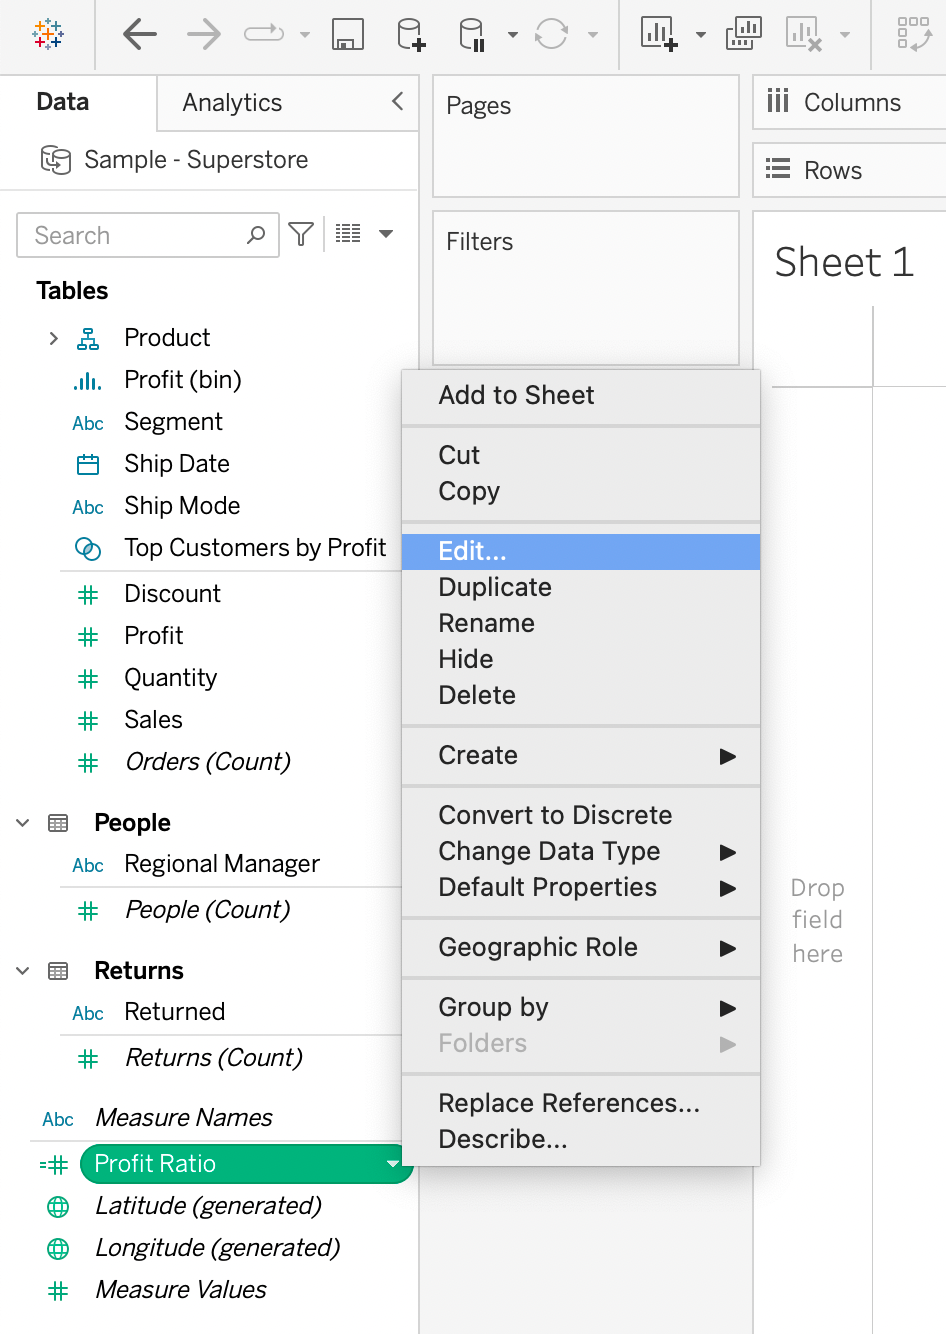
To edit a calculated field, locate the field in the Data pane and right-click on it.
Select “Edit” from the context menu that appears.
This will open the Calculation Editor with the selected field’s formula, allowing you to make any necessary changes.
While working with calculated fields, it’s essential to verify the data types and aggregation levels applied in your calculation to ensure accurate results.
6 Basic Calculations and Formulas
Basic Expressions are the simplest form of calculations in Tableau. They allow you to transform values or members at the data source level of detail (a row-level calculation) or at the visualization level of detail (an aggregate calculation).
These calculations help perform basic arithmetic operations, manipulate strings, evaluate logical functions, or even segment data.

In this section, we will go over the following:
- Operators
- String Functions
- Date Functions
- Logical Functions
- Type Conversion Functions
- Aggregation Functions
1) Operators
Tableau supports several operators for various purposes, such as arithmetic, comparison, or even logical operations. \
Commonly used operators include +, –, *, /, >, <, and !=.
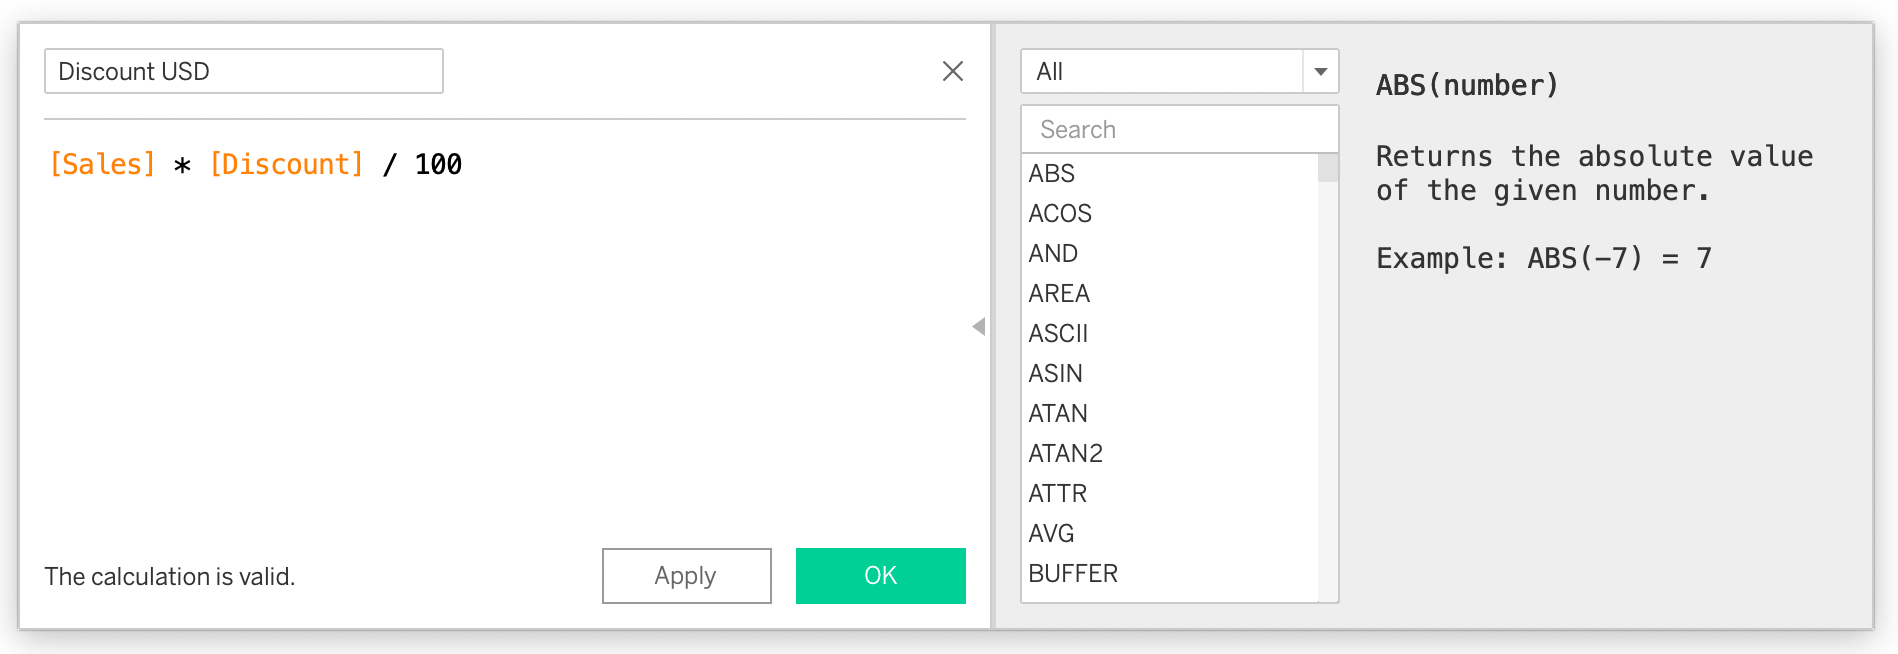
When using operator syntax, knowing the correct order of operations will help you write accurate formulas.
Tableau follows the standard mathematical approach, which is parentheses first, followed by multiplication and division, and then addition and subtraction.
Here’s an example of a simple formula using operators:
2) String Functions
Functions to manipulate text or string data, such as LEN (length), UPPER (convert to uppercase), LOWER (convert to lowercase), LEFT (extract leftmost characters), RIGHT (extract rightmost characters), etc.
3) Date Functions
Functions to work with date and time data, such as DATEPART (extract specific parts of a date), DATETRUNC (truncate date to a specific level of precision), DATEADD (add or subtract time from a date), etc
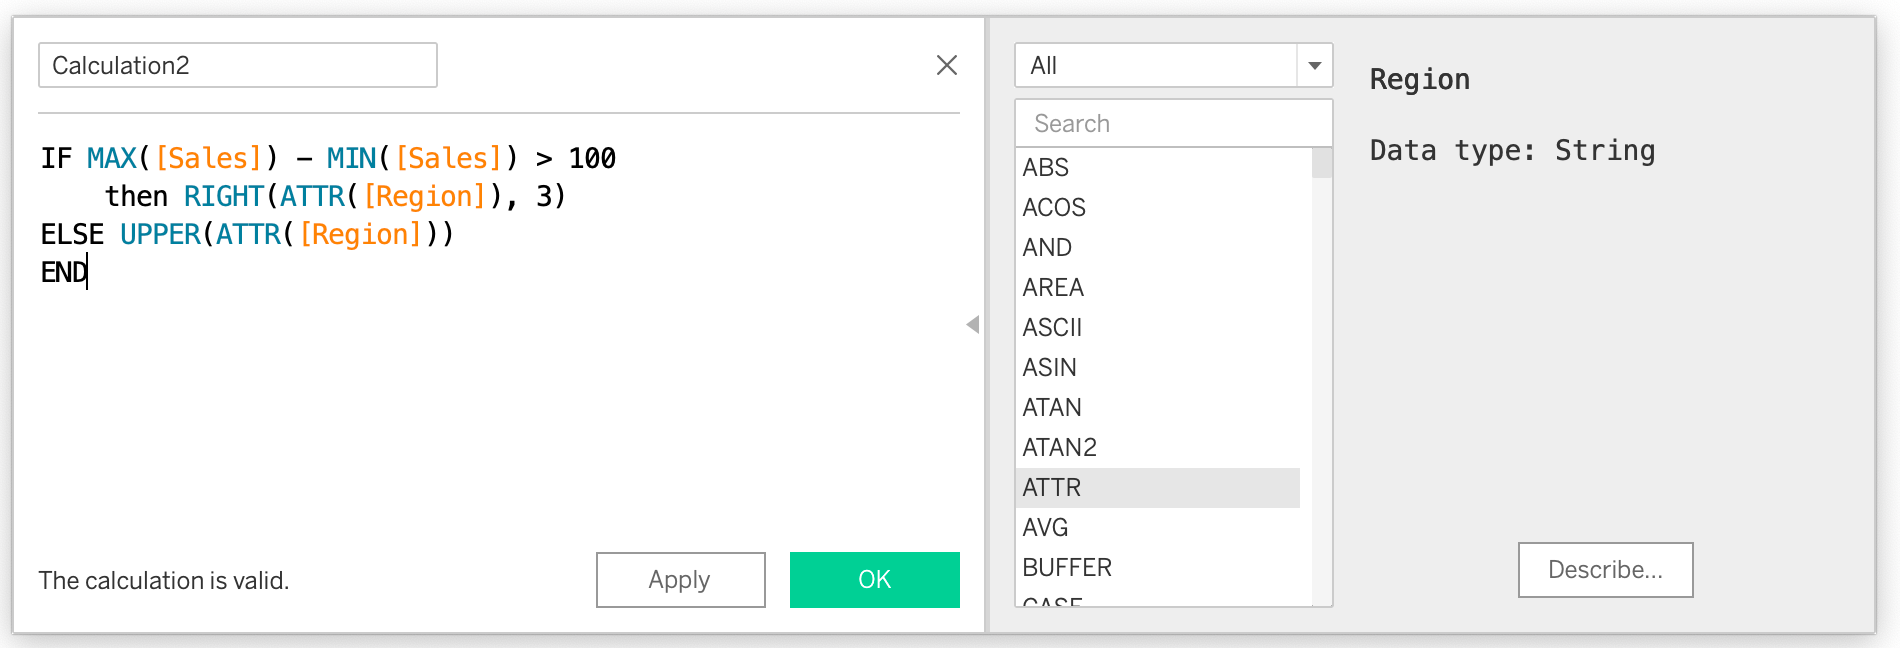
4) Logical Functions
Functions to perform logical operations, such as IF statement, IFNULL (to replace null values), IF-THEN (to create conditional expressions), and CASE (to perform multiple conditional checks).
5) Type Conversion Functions
Functions to convert data types, such as INT (convert to integer), FLOAT (convert to floating-point number), STR (convert to string), etc.
6) Aggregation Functions
Functions to summarize data, such as SUM (calculate the sum of values), AVG (calculate the average), COUNT (count the number of occurrences), MIN (find the minimum value), MAX (find the maximum value), etc.
It’s worth noting that all of these functions can be nested for more complex calculations.

Understanding the basics of calculations and formulas in Tableau is crucial for creating insightful visualizations and leveraging the full potential of your data.
2 Advanced Calculations in Tableau Calculated Field
As you delve deeper into data analysis and visualization, you’ll encounter scenarios where standard aggregations and calculations won’t suffice.
That’s where LOD and Table Calculations come to the rescue.

These powerful techniques allow you to control the level at which calculations are performed and enable you to create complex computations that were previously challenging or impossible using traditional methods.
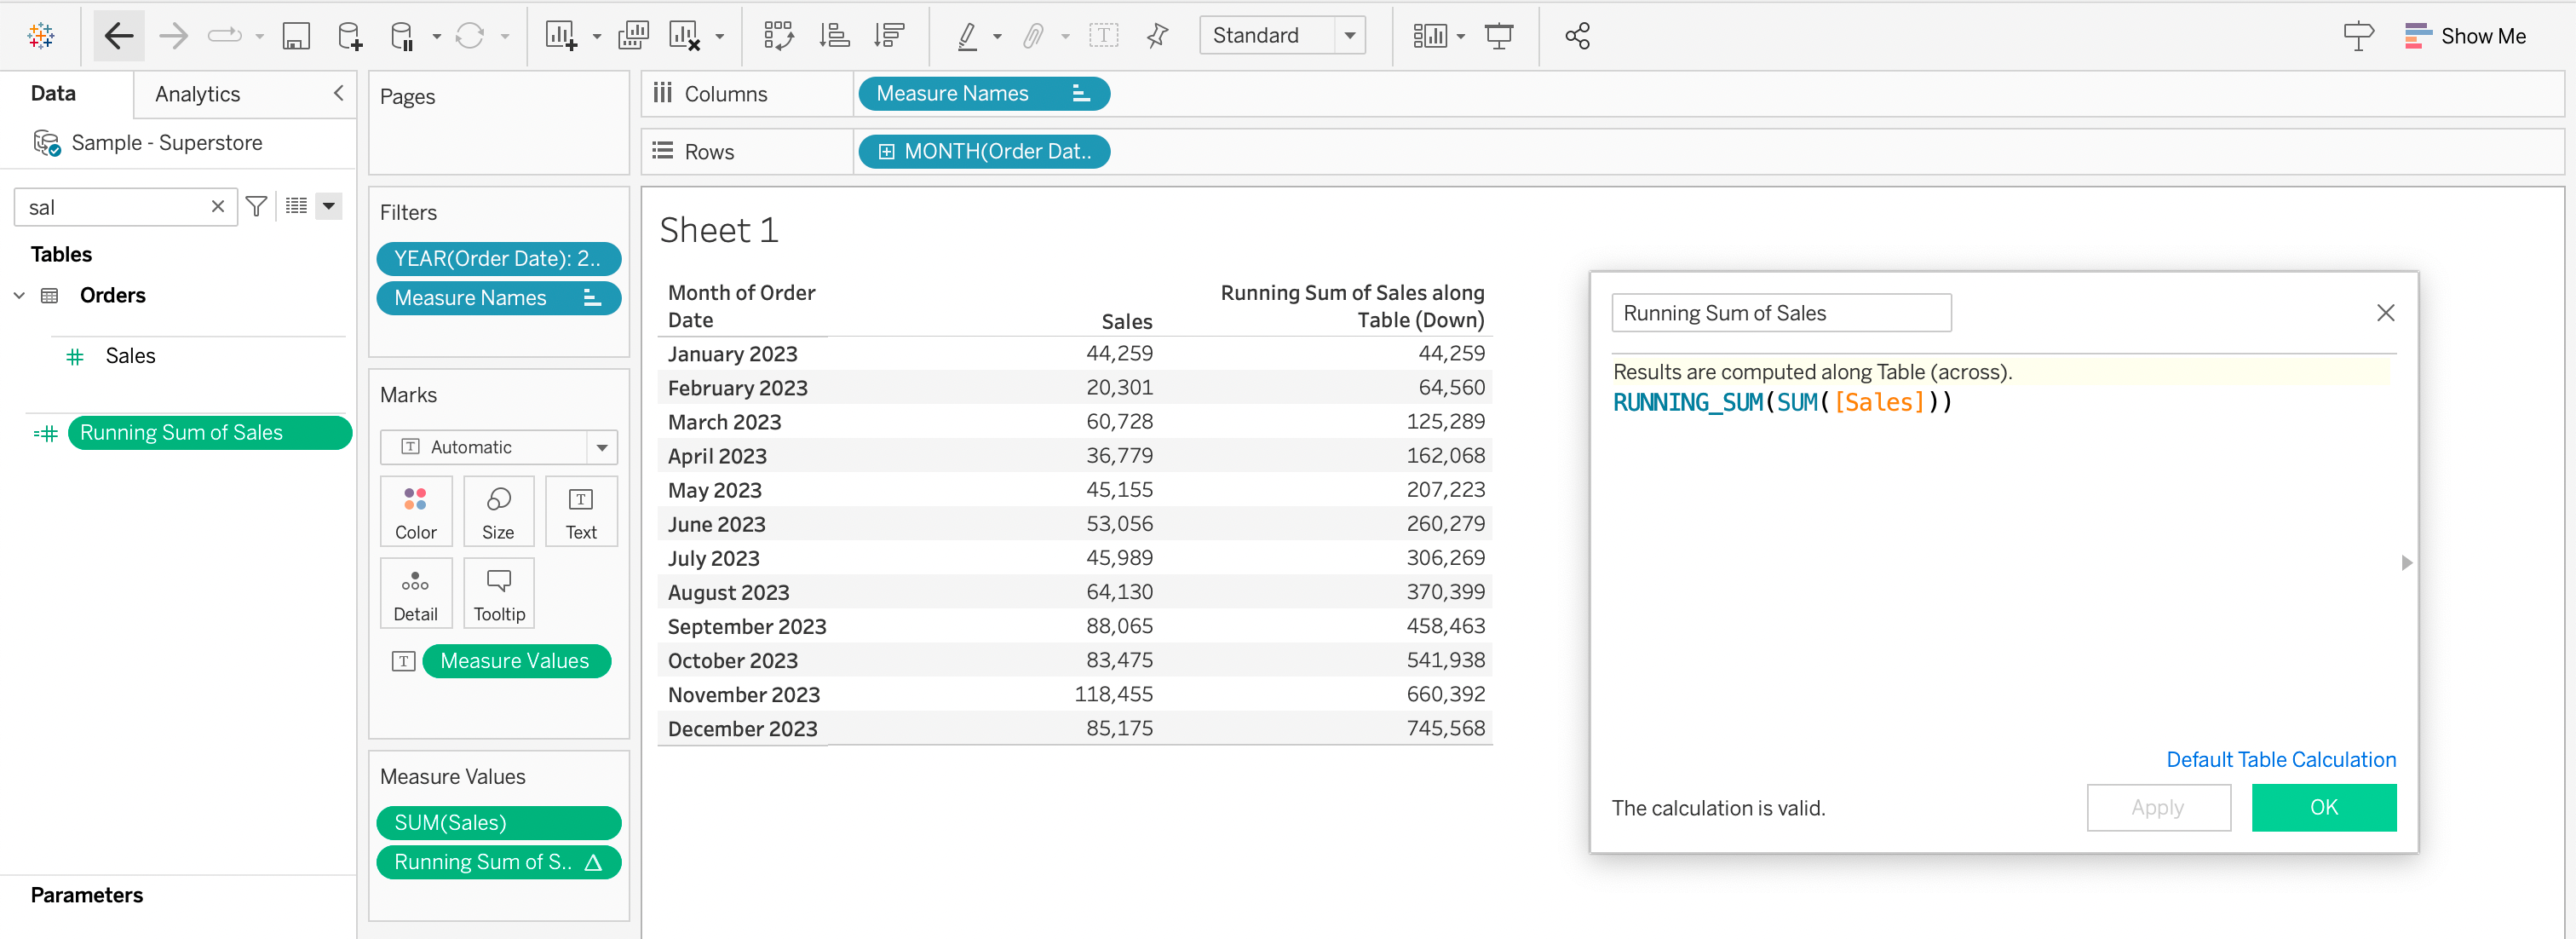
1) What are Table Calculations
Table calculations are unique in that they are performed on visible data in your view or table, making them dependent on the structure of your visualization.
While basic expressions and LOD calculations work on the underlying data, table calculations work on the aggregated data presented in your view.
This type of calculation is beneficial for operations like running totals, moving averages, percent differences, and ranking.
Following there are examples of this type of fomulas: RUNNING_SUM, WINDOW_AVG, and RANK.
You can compare them and do window calculations in SQL syntax.
2) Level of Detail (LOD) expressions
LOD expressions empower you to compute values at different levels of granularity within your dataset simultaneously.
This feature makes it possible to maintain aggregation consistency in your visualizations, even if you have multiple granularity levels.
LOD expressions can be further classified as fixed, include, and exclude calculations.
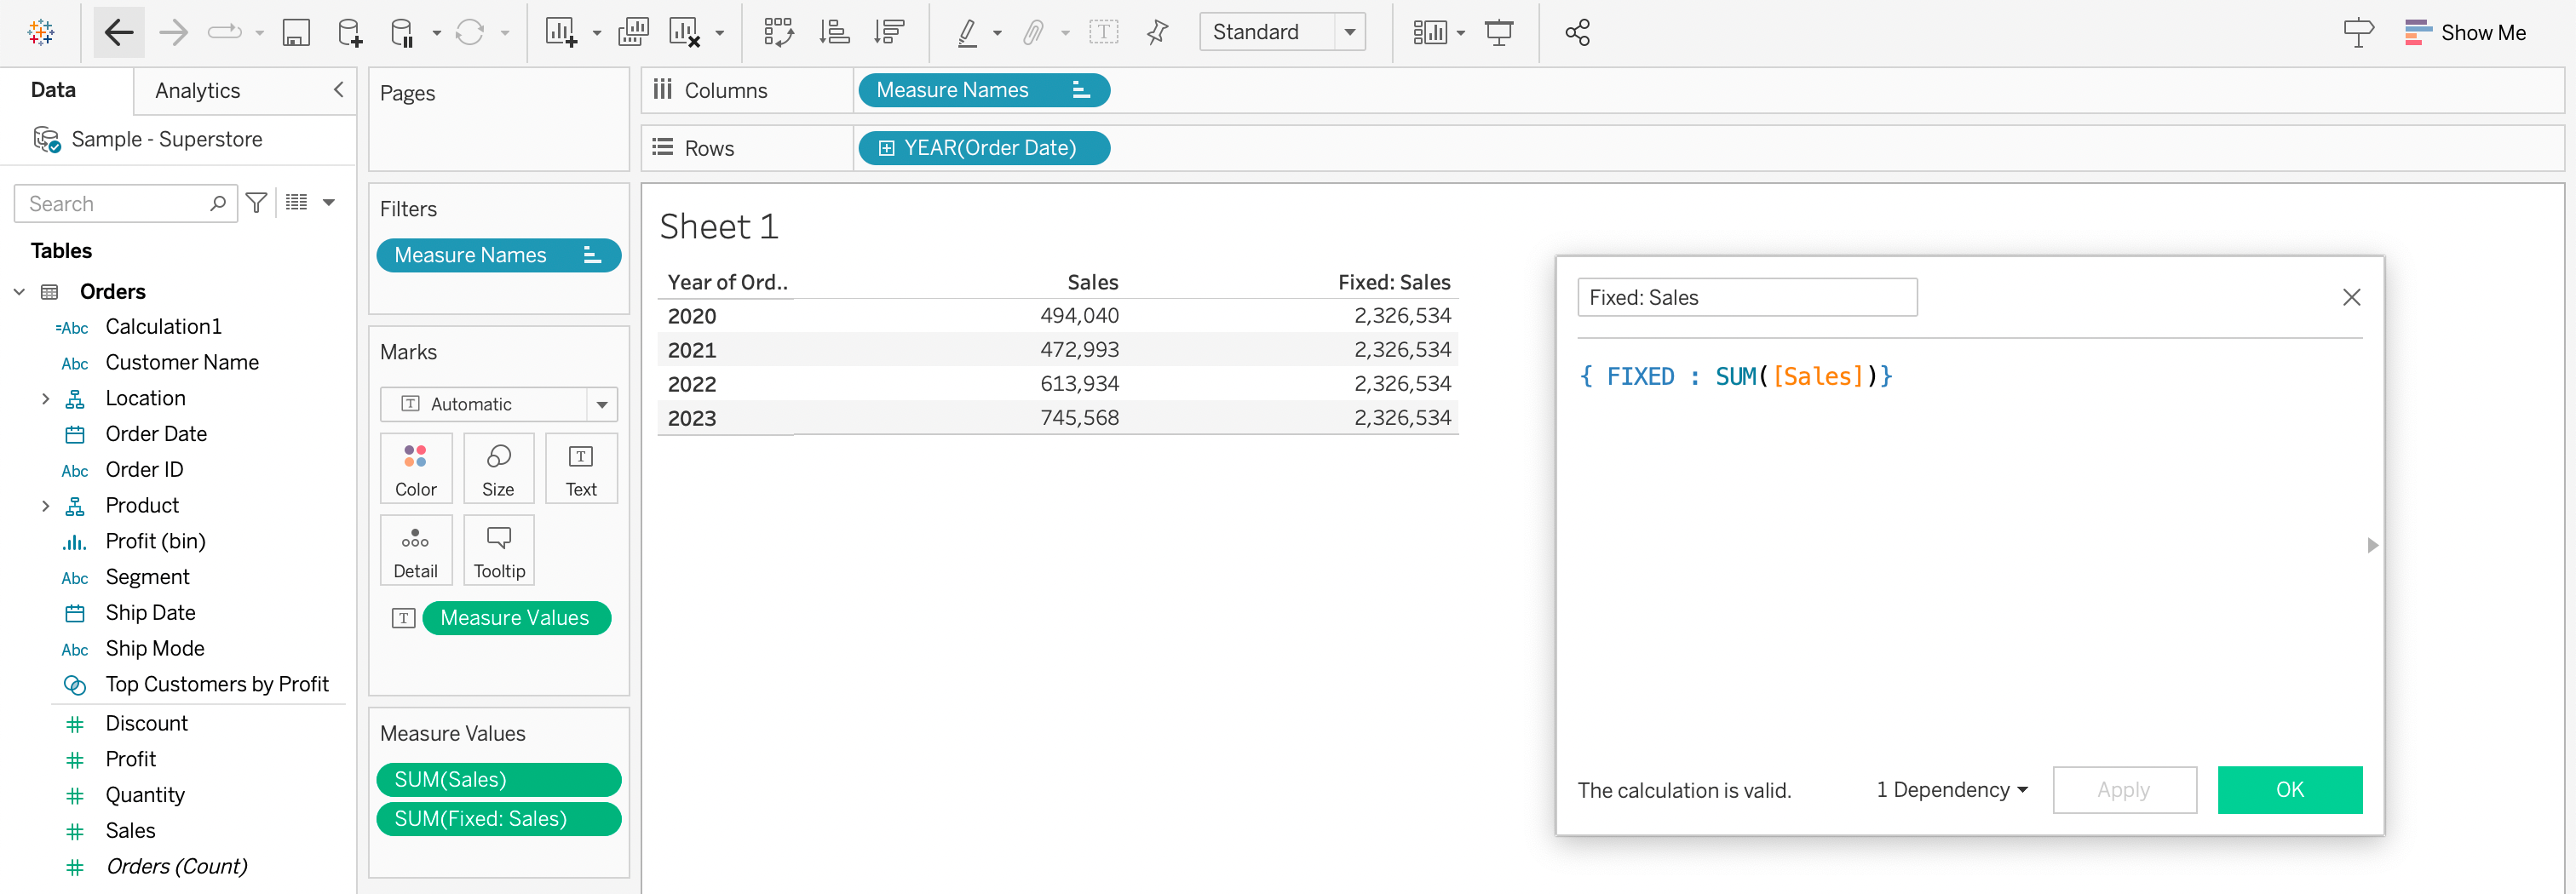
Fixed LODs
Fixed LODs are calculated independently of the visualization level of detail and depend solely on the dimensions specified in the calculation.
Include LODs
Include LODs incorporate the dimension(s) specified in the calculation along with the dimensions present in the visualization.
The outcome is on the lower granular level of detail compared to the displayed table or visualization.
Exclude LODs
Exclude LODs disregard the dimension(s) specified in the calculation while considering dimensions present in the Tableau dashboard.
Here the level of granularity is higher than the displayed view.
Advance your analytics game with the help of Code Interpreter by watching the following video:
Final Thoughts
Tableau calculated field is a powerful feature that differentiates Tableau from other data visualization tools. It allows users to create new fields based on loaded datasets, enabling them to perform computations and derive deeper insights.
You can manipulate data and optimize their visualizations by defining custom formulas using various functions and operators.
The use of parameters, workbook variables that replace constant values, makes calculated fields more interactive and dynamic.
Leveraging table calculations and Level of Detail expressions enables users to control calculation levels and perform complex computations. By following best practices and testing calculated fields, users can confidently create compelling visualizations and gain meaningful insights from their data in Tableau.
Frequently Asked Questions
In this section, you’ll find some frequently asked questions you may have when working with calculated fields in Tableau.

How do I create a conditional calculated field?
To create a conditional calculated field in Tableau, you can use the IF, ELSEIF, or CASE statements in your calculated field.
Firstly, right-click in the data pane, select “Create Calculated Field,” and then enter the desired formula or expression using Tableau’s calculation syntax.
What functions are available for calculated fields?
Tableau offers a wide range of functions for calculated fields, including mathematical, string, date, aggregation, and logical functions, among others.
What are some common calculated field examples?
Common examples of calculated fields include:
- Calculating the percentage change between two values.
- Finding the discount ratio connected with a transaction
- Transforming a string to uppercase or extracting a substring.
- Determining the number of days between two dates.
These are just a few examples; the possibilities are endless based on your data analytics.
Can I use lists in a calculated field?
While Tableau doesn’t include a specific data structure for lists, you can create similar functionality using sets, groups, or IN operator depending on your specific needs.