
There can be times when your date tables won’t have the custom fiscal years and quarters that you require as filters for your analysis. In this tutorial, we are going to discuss how you can filter your data by financial or fiscal years and quarters using calculated columns in Power BI. You may watch the full video of this tutorial at the bottom of this blog.
I’ve already seen inquiries regarding this topic a couple of times in the Enterprise DNA Forum.

Fiscal Year In Power BI
A fiscal year, also known as a financial year is a one-year period chosen by a company to report its financial information or finances. These finances can be referred to as the past year’s revenue, costs, and even profit margin.
When the period of a year starts on January 1 and ends on December 31, the company uses the calendar year as its fiscal year. Any other start date besides January 1 indicates a fiscal year that is not a calendar year.
Filtering your data by fiscal years makes it easier to see how your business has done for the whole year. There are few ways to do the filtering. However, in this tutorial, we’ll focus on the simplest way that you can quickly implement this in your date tables whenever you require it.
All we have to do is to use a current date table that we may already have inside our model.

If you want to learn how to create a date table then check out the link below.
Create A Detailed Date Table Fast
Discussing The Main Problem
Initially, the MonthName column is arranged based on the calendar year.


Now, I’d like to sort this by a custom fiscal year then make July the first month and June the last month of the financial/fiscal year.
In this instance, what we primarily need to do is to create a new calculated column that will serve as our month sorting column.
Creating Calculated Columns In Power BI
A calculated column is an extension of a table using a DAX formula that is evaluated for each row. These calculated columns are computed based on data that has already been loaded into your data model.
When you write a calculated column formula, it is automatically applied to the whole table and individually evaluates each row.
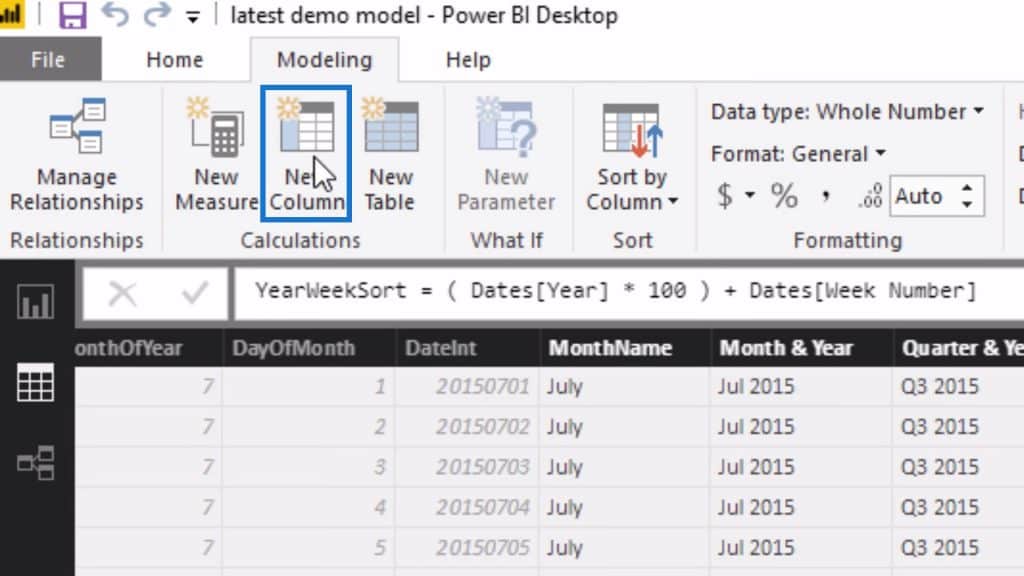
In this current issue that we need to address, there’s no need for us to create a new date table because we can simply use the current one. One example of a calculated column that we have created in our current date table is the YearWeekSort column.

To create a calculated column, just click the New Column option under the Modeling Tab.
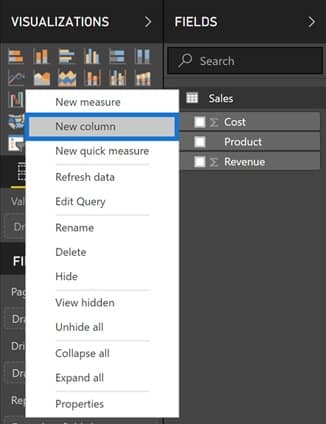
Alternatively, you can right-click on the table and select New column.
After clicking the New Column option, the new calculated column will appear.

Creating The Fiscal Month Number Measure
Subsequently, we can create the measure for that newly-added column. Just click the column and the formula bar will appear.

This is where we will specify the formula/measure for the calculated column that we have just created. We will refer to this measure as the Fiscal month number.

Now, we’ll do a simple IF logic for the Fiscal month number. The primary field that we need to consider for the IF logic is the Dates[MonthOfYear].

Then, we need to evaluate if the value of the MonthOfYear column is greater than six.

If the condition is true, we’ll subtract 6 from the value of the MonthOfYear column.

If not, we will add 6 to the value of the MonthOfYear column instead.

To further analyze the data, think of January as the initial value of MonthOfYear which is numerically equal to 1. And 1 is definitely not greater than 6. In that case, we will add 6 to the value of MonthOfYear which will equal 7. And that would make January as the seventh month and July as the first month.

After setting the formula, you can go to the Data view and check the highlighted column. As you can see, we now have a month number that we can use to sort the months.

You can also see the new column in the Fields list.

Sorting The MonthName Column By Fiscal Month Number
To verify if our formula is correct, select the MonthName column in our date table.

We will then sort this column by Fiscal Month Number. To do this, just select the Sort By Column option from the Modeling Tab then choose Fiscal Month Number.

After that, go to the Report View and you will see that our months are now from July to June. This validates that our Fiscal Month Number measure is working accurately.

Creating The Fiscal Quarter Number Measure
Now that we have learned how to filter data by a fiscal year using calculated columns in Power BI the next thing that we need to learn is how to identify the fiscal year quarters, so we need to implement another sorting formula.
Let’s create a new calculated column where we can implement the measure for fiscal or financial quarter. We will refer to this as the Fiscal Quarter Number.

The first thing we need to do is to type an opening and closing parenthesis. Inside the parenthesis we need to get the sum of 2 and the value of the Fiscal Month Number.

Then divide the result by 3.

Now, if you check the date table, you’ll see that it has produced decimal points in the Fiscal Month Number column.
Looking further into details, 1 is the initial value of the Fiscal Month Number. If we add 2 to 1, the sum will be 3. Then, the sum will be divided by 3, which will produce 1 as the quotient.
As a result, 1 will be the equivalent Fiscal Quarter value of the first fiscal month number, 1.33 for the second, and 1.66 for the third month.

To round the value down to the nearest integer, we need to include INT, which represents integer, in our formula. Then, enclose the logic inside a parenthesis.

Let’s now check out the result of our new measure. As you can see, the corresponding value of the first to third month in the Fiscal Quarter Number column is 1. Then the fourth to sixth month’s Fiscal Quarter Number value is 2 and so on.

This validates the accuracy of our Fiscal Quarter Number measure by setting 3 months for each quarter.
Creating The Fiscal Quarter Column
Now, let’s add one more column that we will refer to as the Fiscal Quarter.

What we’re going to do here is to concatenate the letter “Q” to every value of the Fiscal Quarter Number.

As a result, we should have this new column for the Fiscal Quarter.

This can also be used as a customized graphic filter, also known as a slicer for our visualizations in the Report View.

***** Related Links*****
Sorting Dates By Financial Year In Power BI
Calculate Financial Year To Date (FYTD) Sales In Power BI Using DAX
How To Create Custom Financial Year Quarters – Power BI

Conclusion
If your report is in anything but a calendar year, implementing this type of logic inside your date table is going to be absolutely essential to get the correct numbers and figures showcased in your visualizations.
Making sure that you can dynamically filter by financial years is very important when analyzing any type of financial results within organizations.
The key point here is to make sure that the previously discussed logic or formula is integrated into the date table in your data model.
By using calculated columns in Power BI, you can integrate your own calculations inside your date table, and the filtering becomes dynamically seamless. Furthermore, enriching your data model with your own calculations will make your reports infinitely more powerful.
Good luck with reviewing this technique.
Sam


