Today’s blog post will give you an introduction to calculation groups. I’ll try to answer four basic questions regarding calculation groups and the Tabular Editor. You can watch the full video of this tutorial at the bottom of this blog.

Calculation groups are a collection of items, and collection items are basically the same measures that you create in your report, but they’re created in a slightly different way.
Calculation groups are created in the Tabular Editor, which you can download for free from the Internet. You can see tabular Editor in your External Tools.
If you’re running the latest version of the Power BI desktop, the Tabular Editor should pop up automatically. But in the case it doesn’t, check out this video that was recently posted by one of our Enterprise DNA experts, Brian Julius. In this video, you’ll learn how you can get all these cool tools on your Power BI desktop.

Why Create Calculation Groups?
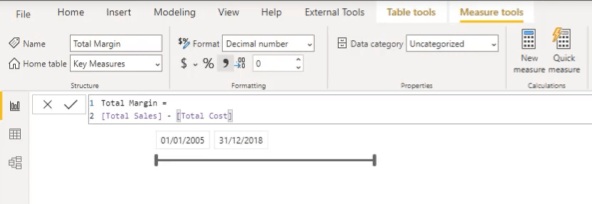
Why should we create calculation groups when we can get the same results with our measures? Well, we have created three measures in our report for demonstration purposes: Total Sales, Total Cost, and Total Margin.


I want to check our previous month’s sales, previous quarter’s sales and month over month change. I used the time intelligence function to get the previous month.

This same measure was used in the previous quarter sales measure. The only difference is that month was replaced by quarter.

The month-over-month change measure is basically the difference between Total Sales and Previous Month Sales.

We can populate this in a matrix visual and analyze it by month name. I’ll also add our current total sales, our previous month sales, our previous quarter sales, and month-over-month change.
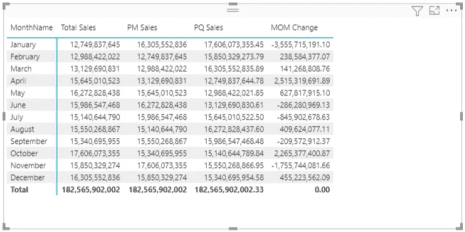
To be able to analyze sales in different time periods, I had to calculate three measures. But what if I wanted to see the same result for Total Cost? I have to create three additional measures. For Total Margin, I also have to create three measures. So that’s a total of six more measures that I need to create.
Let’s imagine that you want to create more time intelligence calculations, such as previous year, quarter on quarter, or month over month percentage change. To do this, you will have to calculate three more measures for every time intelligence calculation. That would be one hell of a task, right?
We can avoid all of this with Tabular Editor.
How To Make Calculation Groups Using Tabular Editor
First, you will have to go to External Tools then click on Tabular Editor.

The cool thing about Tabular Editor is that you can access all your tables from this tool. For example, Channel, Sales, and Stores are here.

You can also check your dependent measures from the Tabular Editor. For example, I want to check which measures depend on the Total Costs measure. I can right-click on Total Costs and click on Show Dependencies.
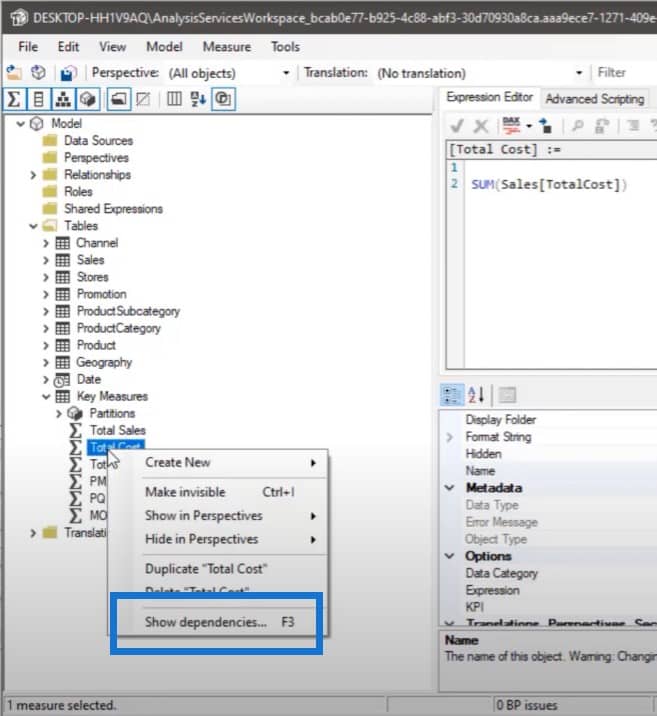
As you can see, the Total Margin is dependent on Total Costs.

But if you want to check which measure, table, or columns our Total Cost measure is dependent on, you can click here.
You can see that the Total Cost depends on this table and this column.

How To Create Calculation Groups
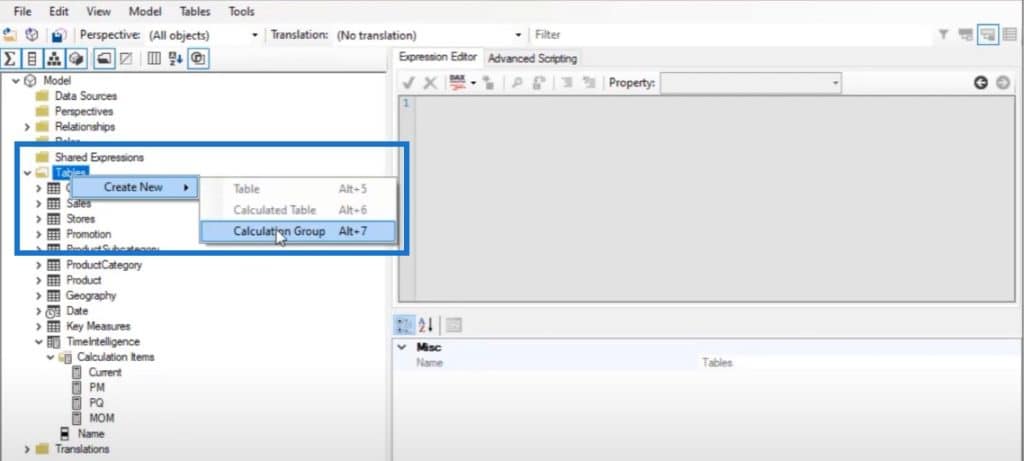
Let’s create calculation groups by right-clicking on the Tables calculation group, clicking on Create New, and choosing Calculation Group.
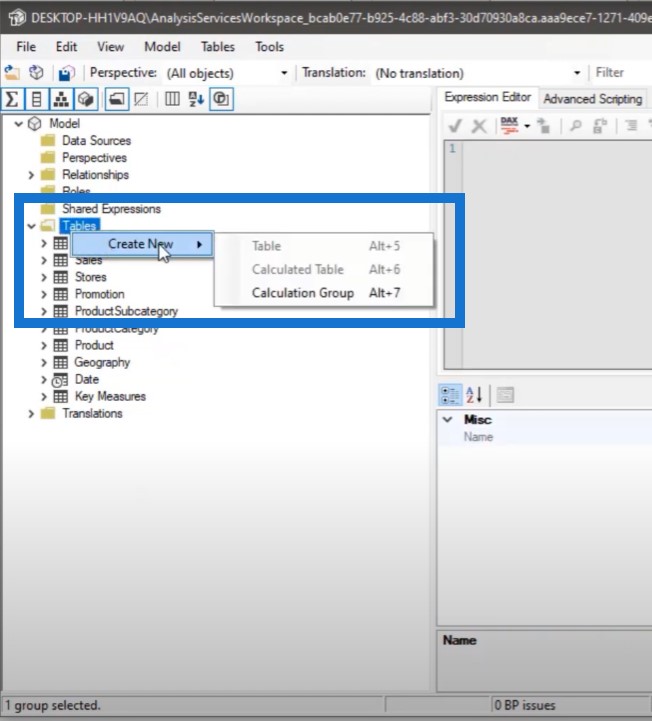
We can name this group as Time Intelligence.
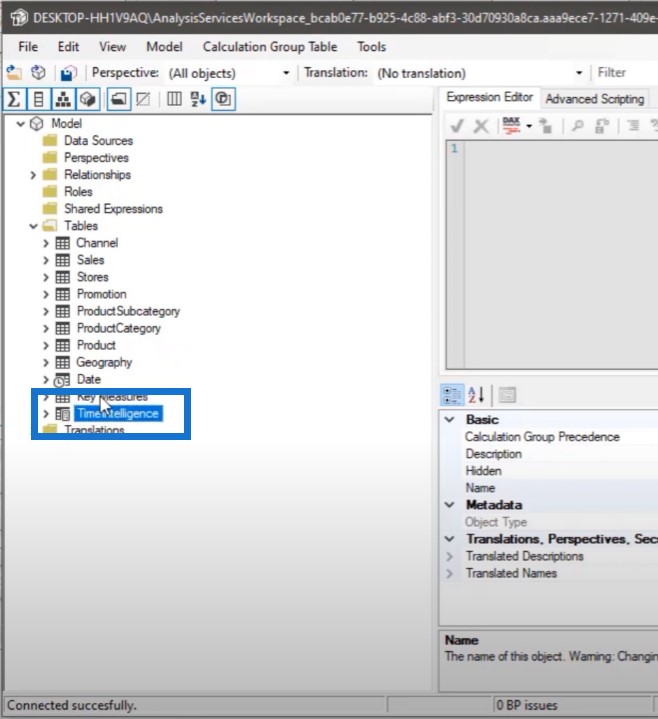
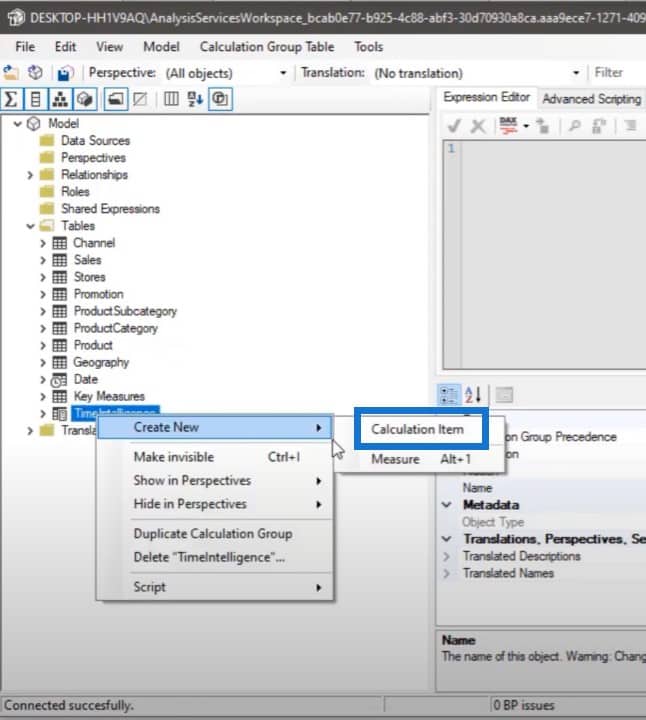
To create measures or calculation items, right click and choose Calculation Item.
The first calculation item we are going to create is the previous month calculation. So instead of having to write previous month sales over here, I’m just using one measure.
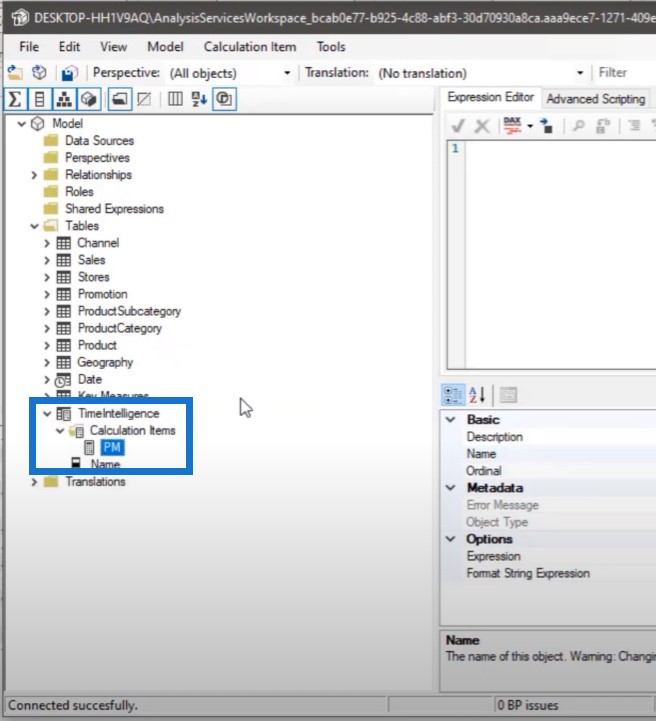
With this measure, I will be able to analyze Total Cost, Total Margin, and Total Sales.
For the previous month’s sales, we have to use both the CALCULATE and SELECTEDMEASURE functions.
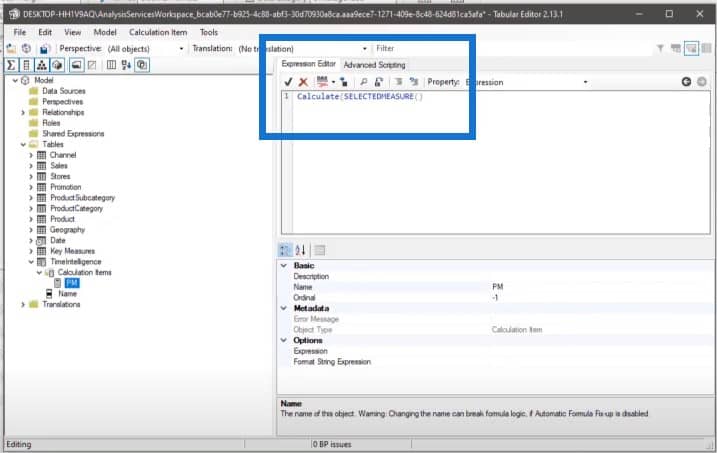
We’ll also use the DATEADD function, reference the Date table and Date column and then go back one month.

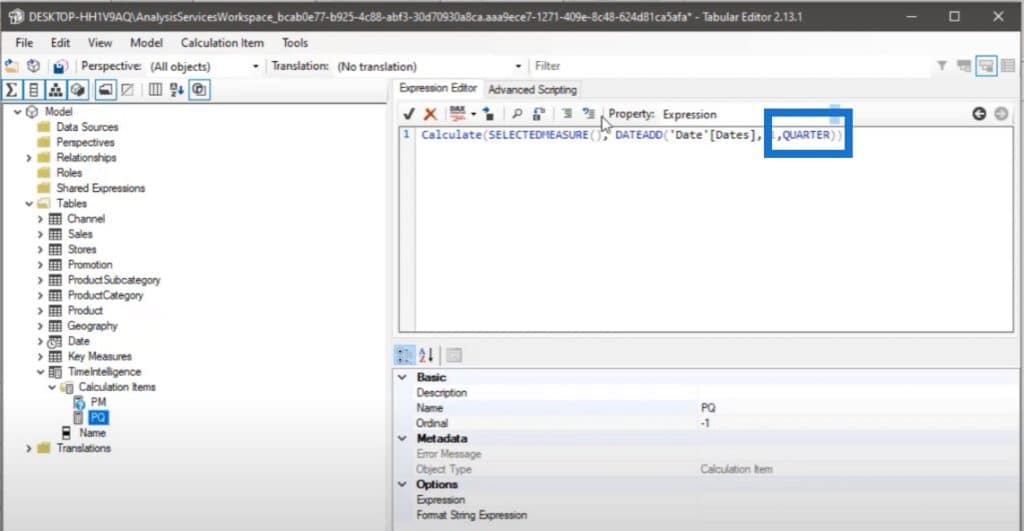
I’m copying this measure and using it for the previous quarter’s measure. We’ll go back to Calculation Items to create a new calculation item and name it as Previous Quarter.

The measure pattern we used is the same; the only difference is we replaced month with quarter.
We also have to create a measure for month over month.

We are using the SELECTEDMEASURE function because we want to make it dynamic and whatever measure we select in the report, we’ll subtract it with our previous month.
For example, if we select Total Sales, it will apply to our previous month’s Total Margin or Total Cost.
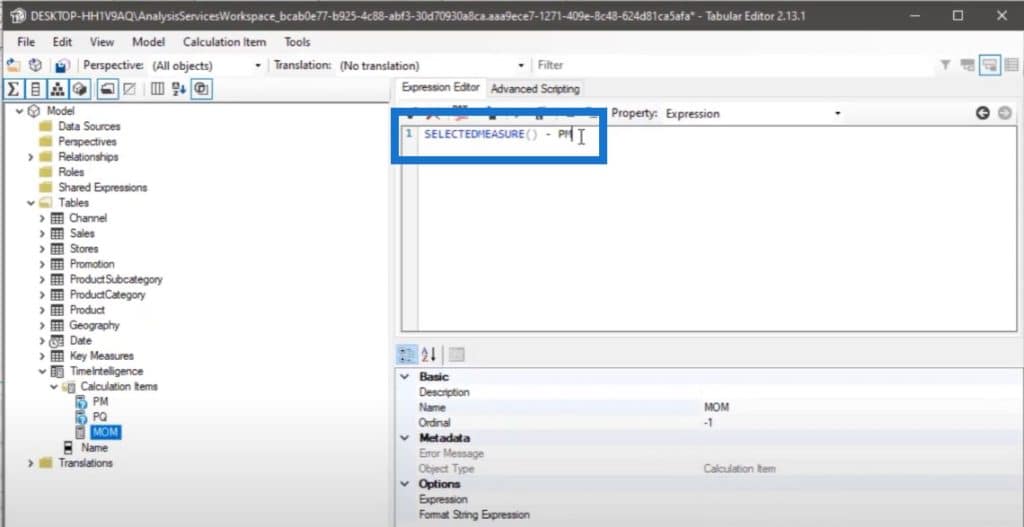
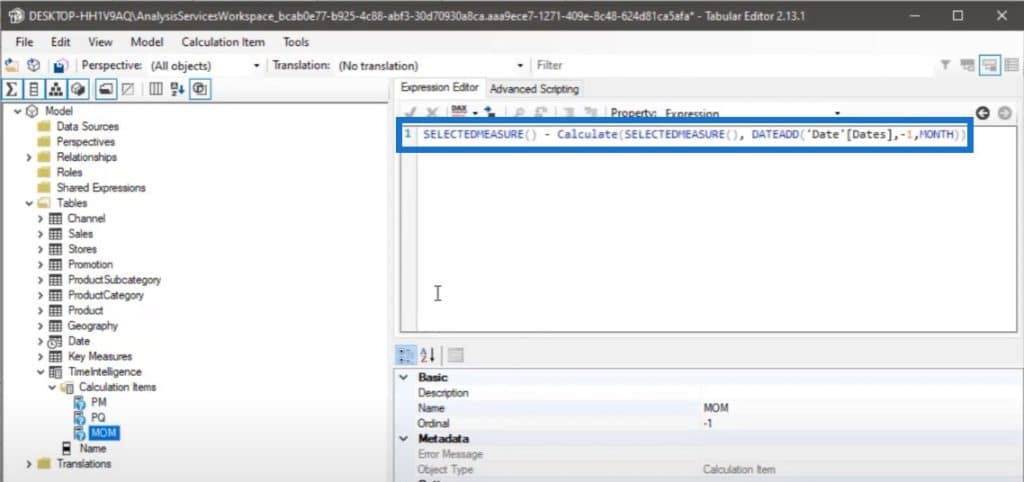
However, we cannot reference our calculation items in a new calculation item. What we have to do is copy and paste our previous month expression and press Enter.
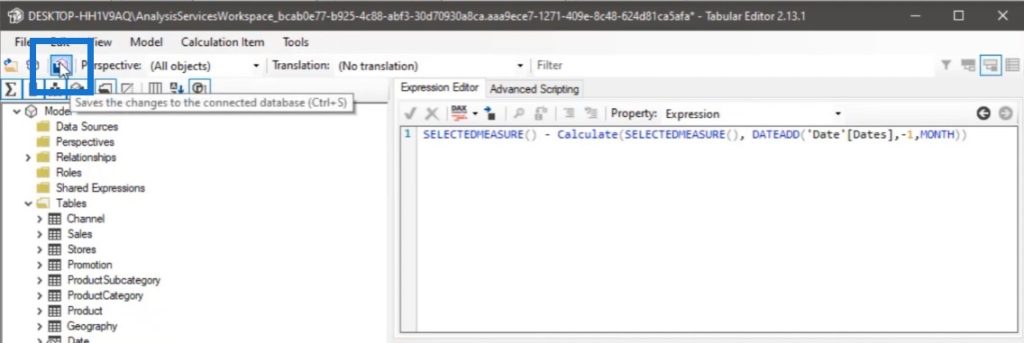
And now we have to save our changes so that they will be reflected in our report. You have to refer to it in the report before you can access your calculation groups.
Let’s go ahead and check the results. We have to duplicate our table and remove the unnecessary columns from the Fields pane for the new table. We also need to bring our time intelligence calculation in our column section.
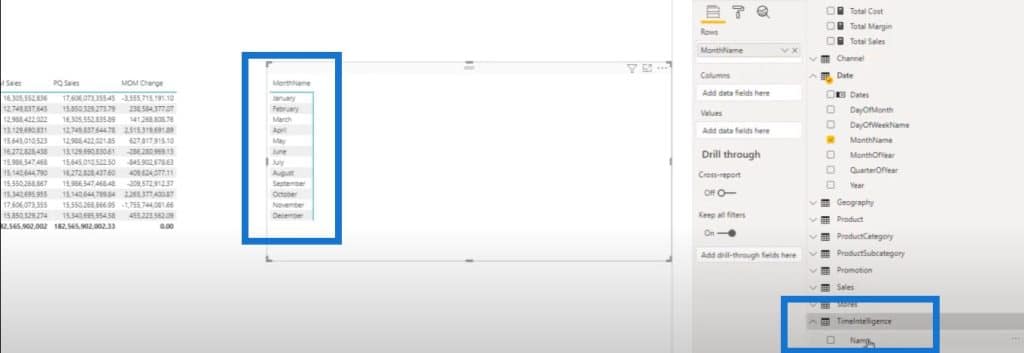
Now we also have to add a measure over here. If I drag and drop Total Sales in the Fields pane, the SELECTEDMEASURE function that we used in Tabular Editor will automatically detect that we are using Total Sales.
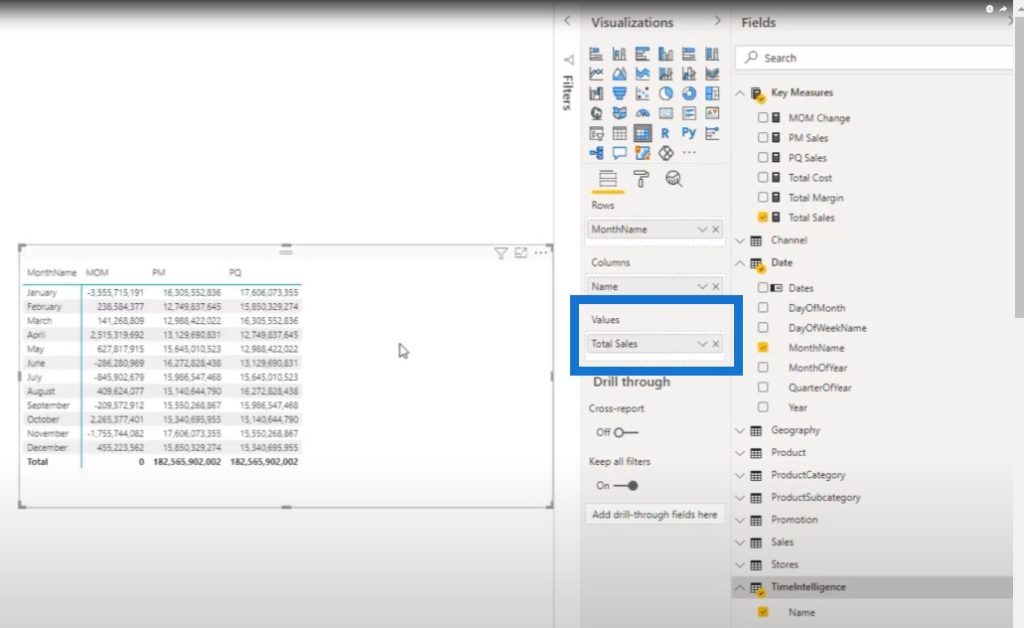
As we can see from these two tables, the results are the same.
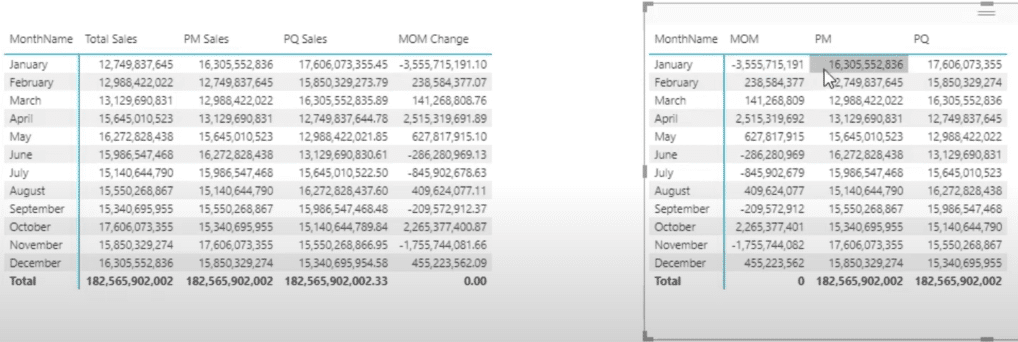
But what if you want the previous month’s sales first, previous quarter sales, and month over month sales? We can achieve that quite easily.
You can rearrange the order of your measures here. In my example, the previous month is 0, which means it will be the first item on the list.
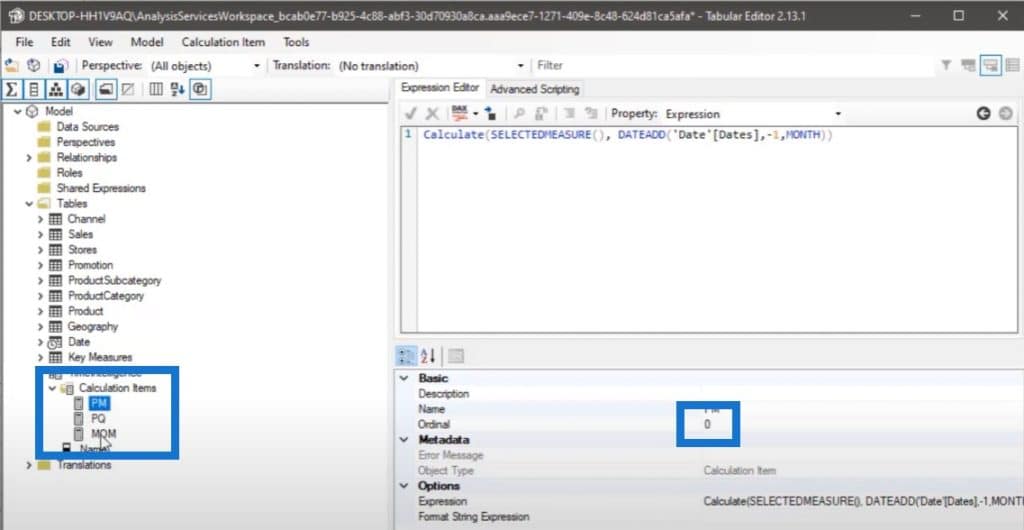
Previous quarter is 1, while month over month is 2. Then we have to save our changes and refresh them.
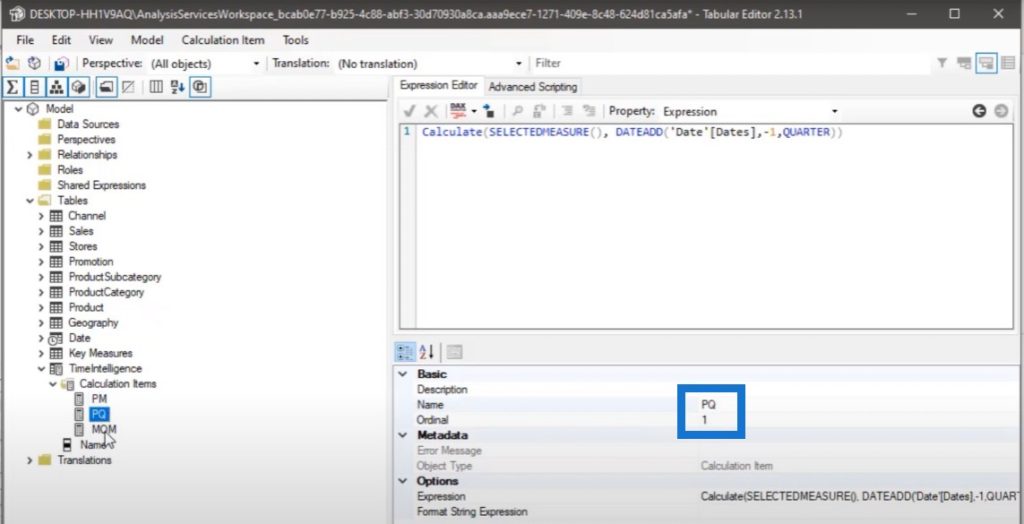
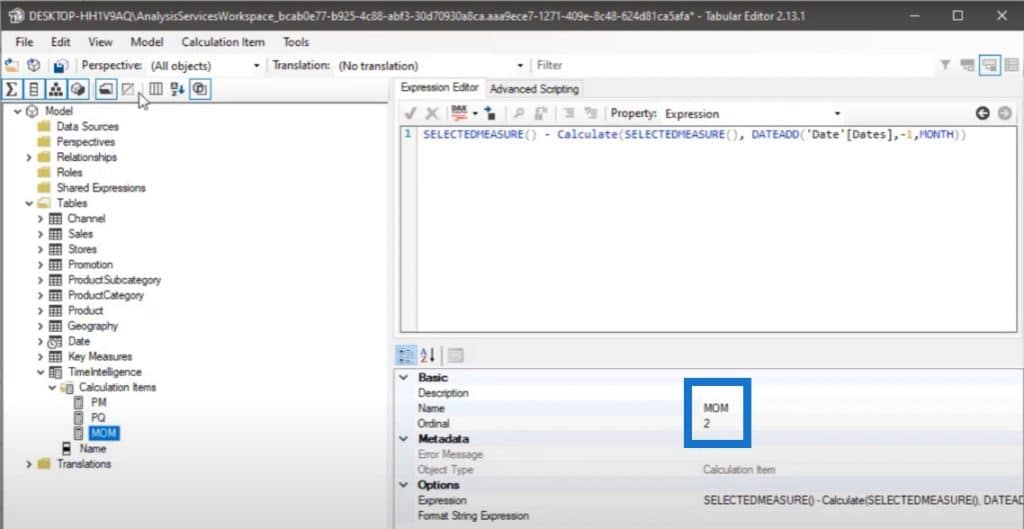
You may have noticed that the Total Sales amount is on the first table, but not on the second.
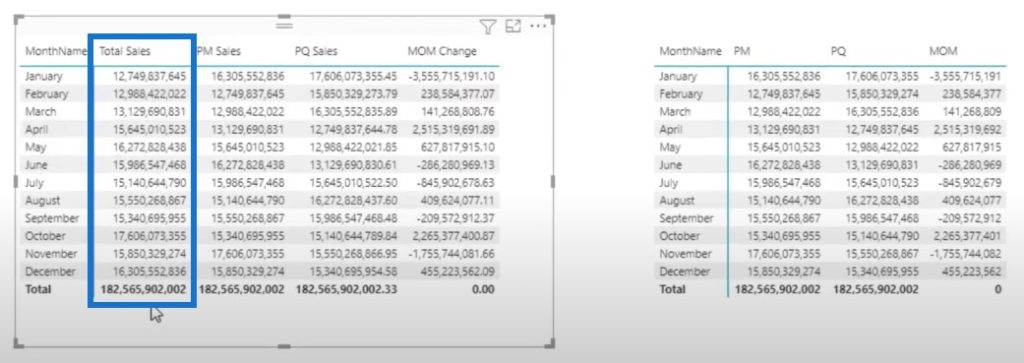
We cannot access the Total Sales from the second table. To do this, we have to create one more time intelligence calculation and call it Current. This measure will just be SELECTEDMEASURE. That’s it.
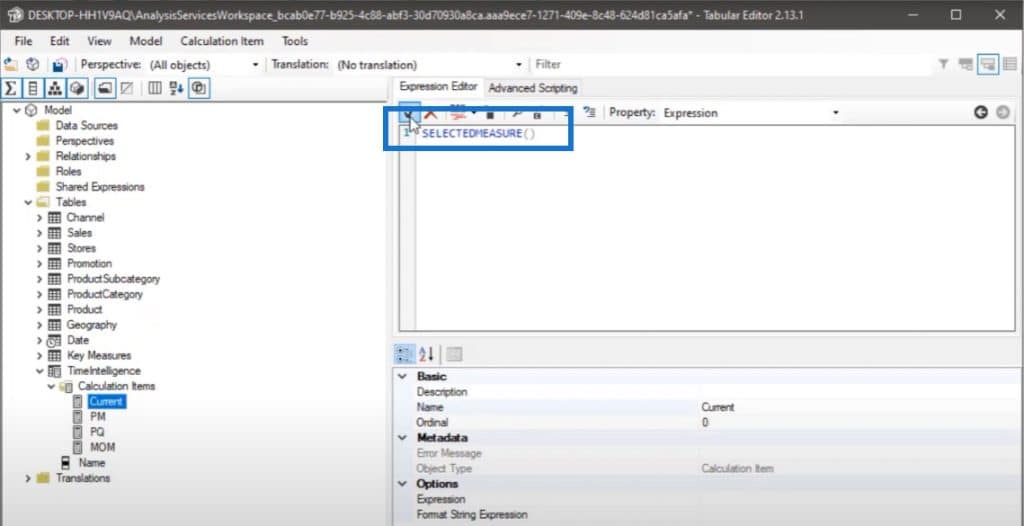
Let’s go back to the two tables. We can see the Current column in the second table. Whatever measure we put in our field section, it will get it automatically.

This is what it looks like if want to see the Total Cost.

And this is what it looks like if I want to see the Total Margin.

This is really great. I think it’s one of the best features of Tabular Editor so far.
But what if we want to take it to the next level? Instead of dragging and dropping different measures in our report, we can use them in a slicer. What we can do is create another calculation group.
Creating Slicers Using Tabular Editor
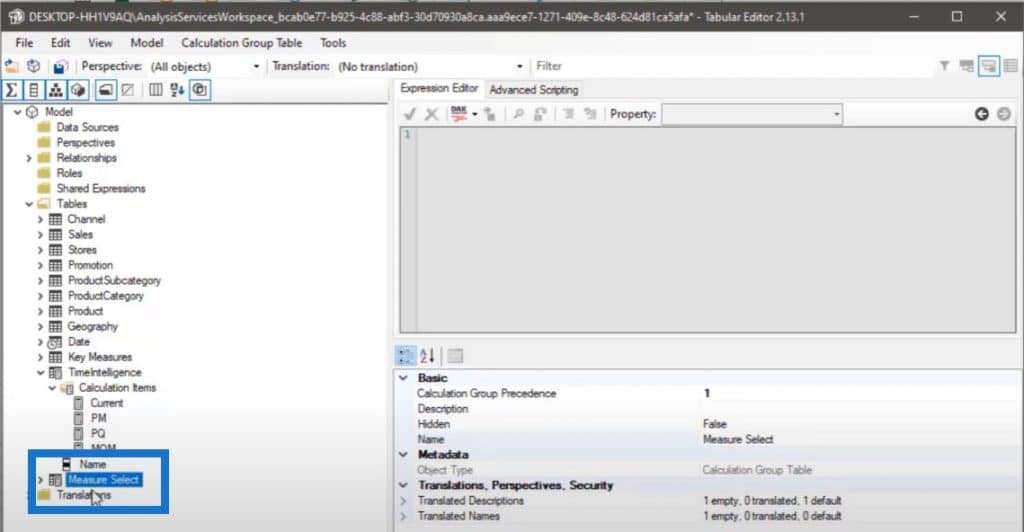
Let’s go back to Tabular Editor and create a new calculation group.
We’ll name it as Measures Select.
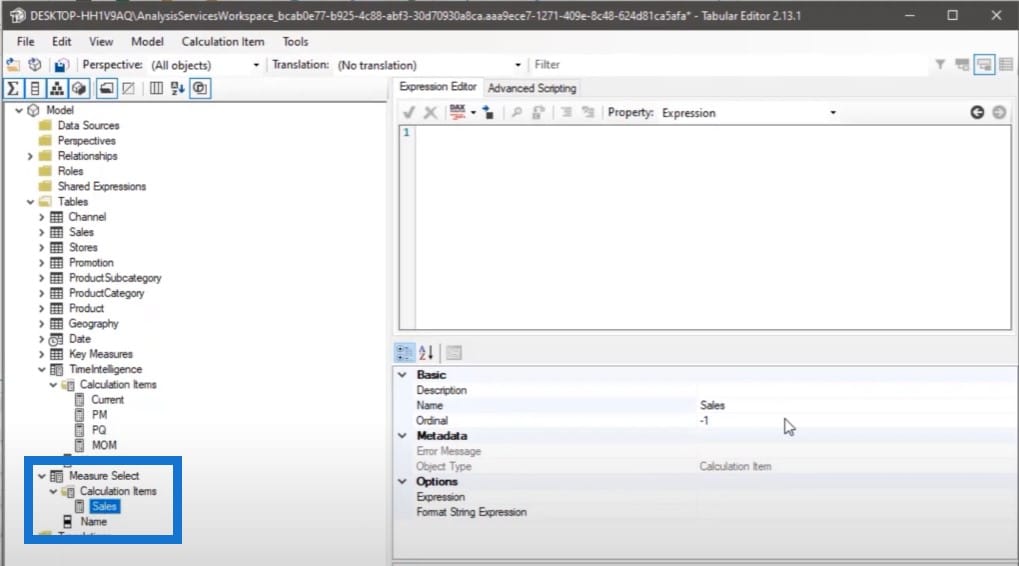
Under this measure, we have to create a new calculation item called Sales.
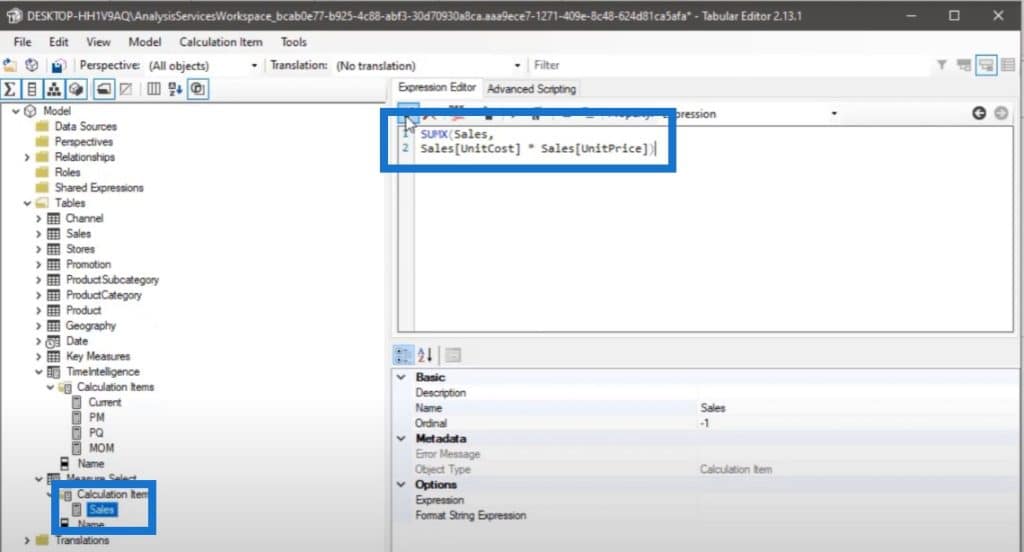
I will be hard-coding the sales expression over here.
We’ll create another calculation item for Cost.
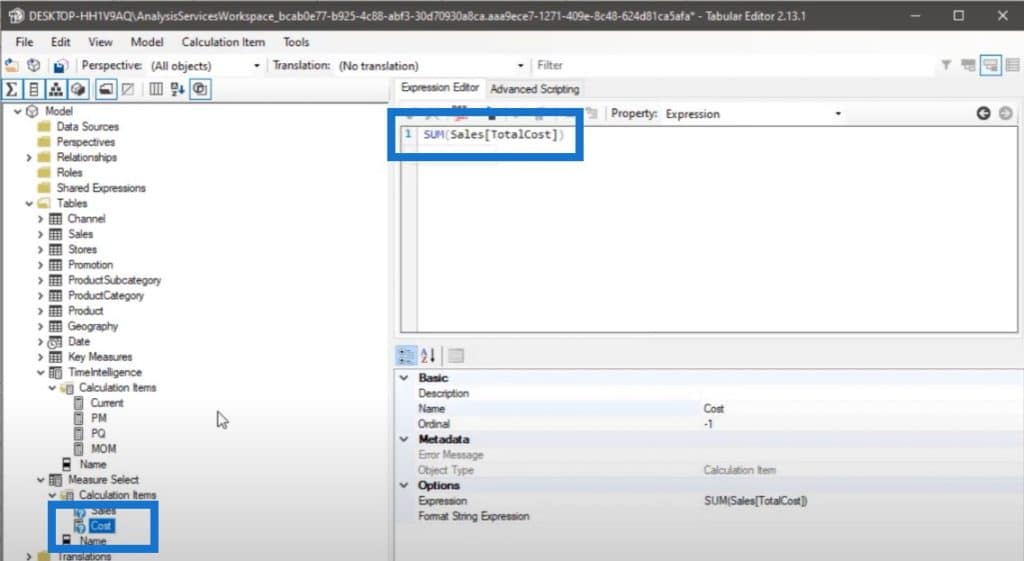
And then the last one is for Margin, which is basically the difference between Sales and Cost.
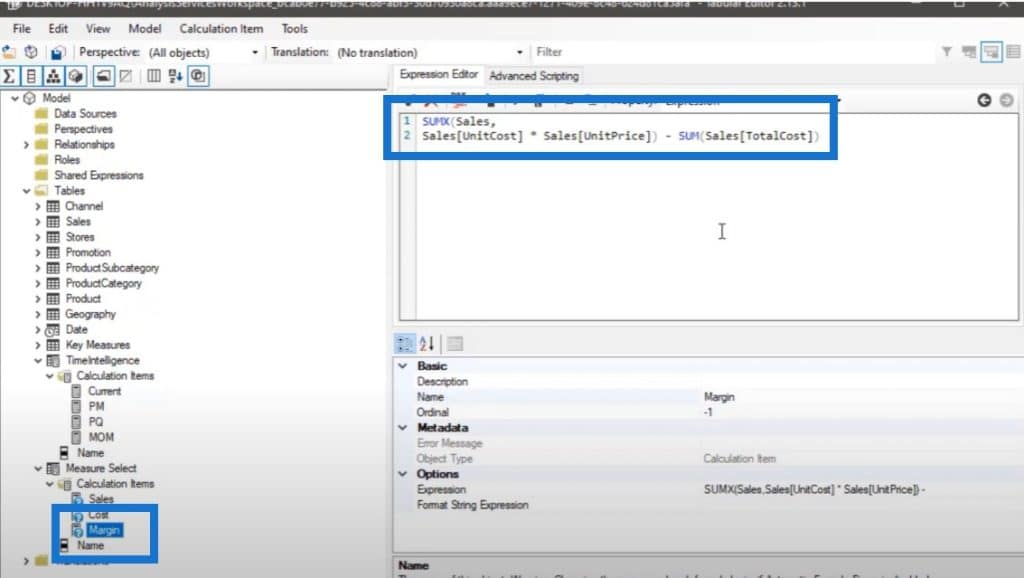
I didn’t reference any measure in Tabular Editor because it is not the best practice. It’s best to use the whole expression instead.
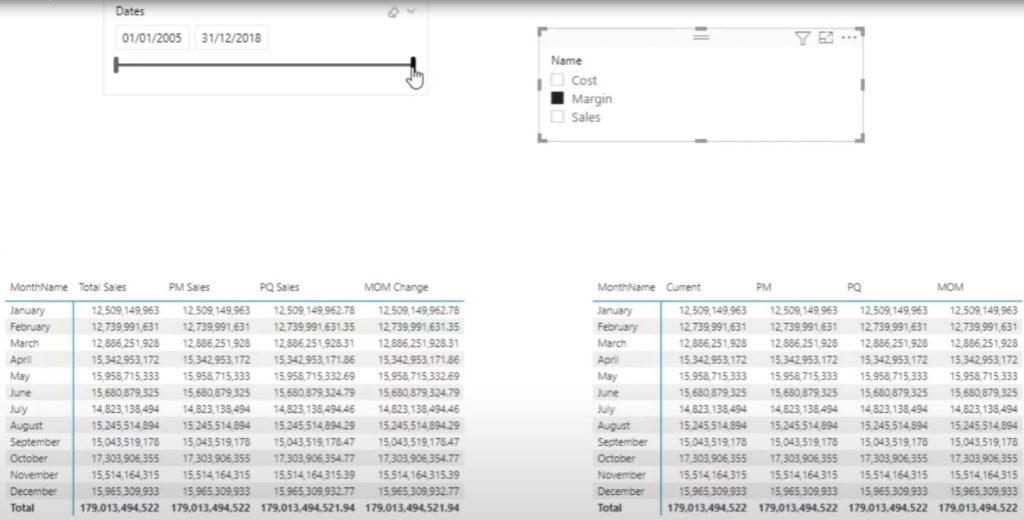
Just save and then refresh the report. Now, we can use this in our slicer. I can dynamically populate the results for Sales, Cost, and Margin. You can use the data to see the periodic result in your report.
***** Related Links *****
Level Up Your External Tools Menu In Power BI
Small Multiples With Calculation Groups In Power BI
Turning Calendar Type Layout Into Tabular Format In Power BI Using Query Editor
Conclusion
I hope that I managed to explain how calculation groups work in simple terms. I didn’t use any technical terms because I know that that’s the problem I faced when I was starting out with DAX. I also hope you’ve learned how to use Tabular Editor to your advantage. Don’t forget to hit the like and subscribe button for more Enterprise DNA TV content.
Mudassir


