Reference lines in Tableau can take your data visualization to the next level. They add context to your data visualization in terms of the measure you are comparing it with.
So, how do you add them?
To add a reference line in Tableau, right-click on the axis where you want to add the reference line, select “Add Reference Line,” and then choose the desired option, such as “Constant,” “Average,” or “Median.” You can also customize the reference line to display specific values and styles.

In this article, we will show you how to add reference and custom reference lines using the quickest and most efficient methods.
We will also provide you with step-by-step instructions and examples to help you better understand implementation.
Let’s get started!

What Are The Steps to Add a Reference Line in Tableau
The Analytics Pane is a great tool for adding reference lines. This method is particularly useful when you want to add multiple reference lines to your chart or table.
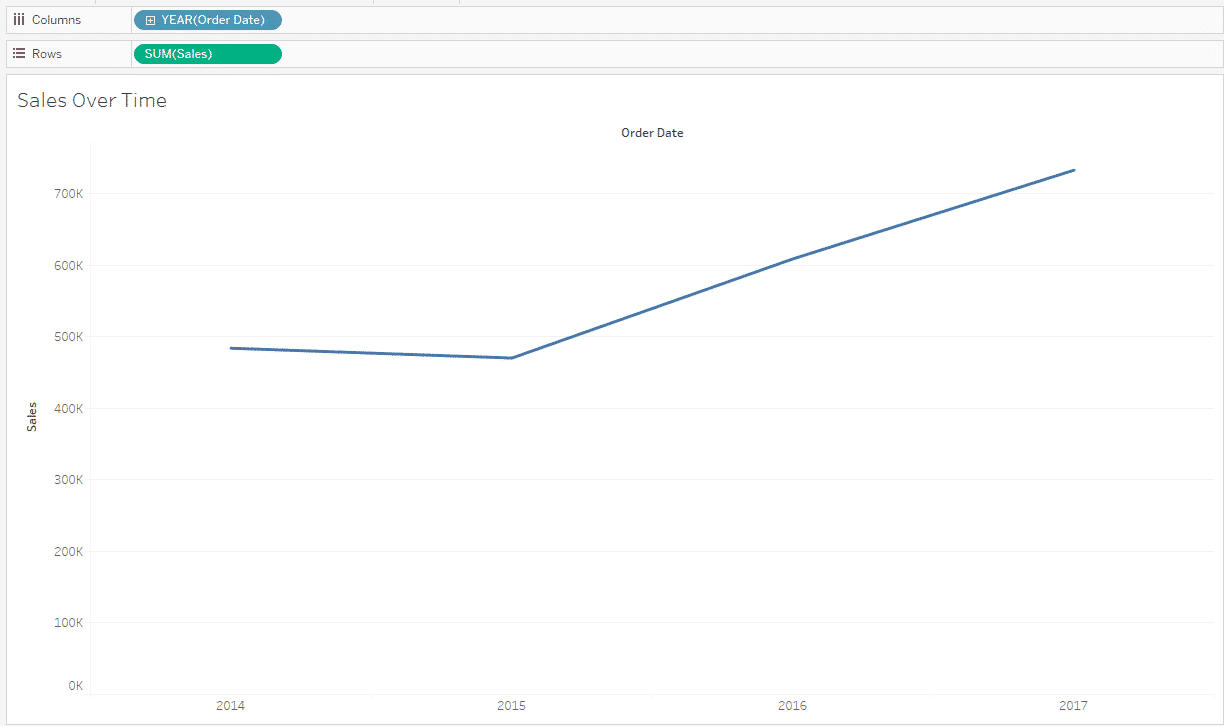
Let’s say you have created a line chart to visualize all the values of sales over time.
To add a reference line to this chart using the Analytics pane, follow the steps given below:

Step 1
Open the Analytics Pane. To do this, click on the Analytics Pane icon located on the left-hand side of the workspace.
Step 2
In the Analytics Pane, scroll down until you find the Reference Line option. Click on it to select it.
Step 3
After selecting, drag the reference line and drop it onto the axis where you want to add it.
Step 4
Once the reference line is added to the axis, you can customize it by selecting options such as Constant, Average, or Median.
You can also customize the label, line style, and color by right-clicking on the reference line and selecting Edit.
After clicking OK, Tableau will add a reference line to the chart according to your specifications.
How to Add Custom Reference Lines in Tableau
In Tableau, you can add custom reference lines, too. These are particularly handy in providing additional context and insights to the viewer.
Custom reference lines are user-defined lines that can represent specific thresholds, goals, or other important values in your data.
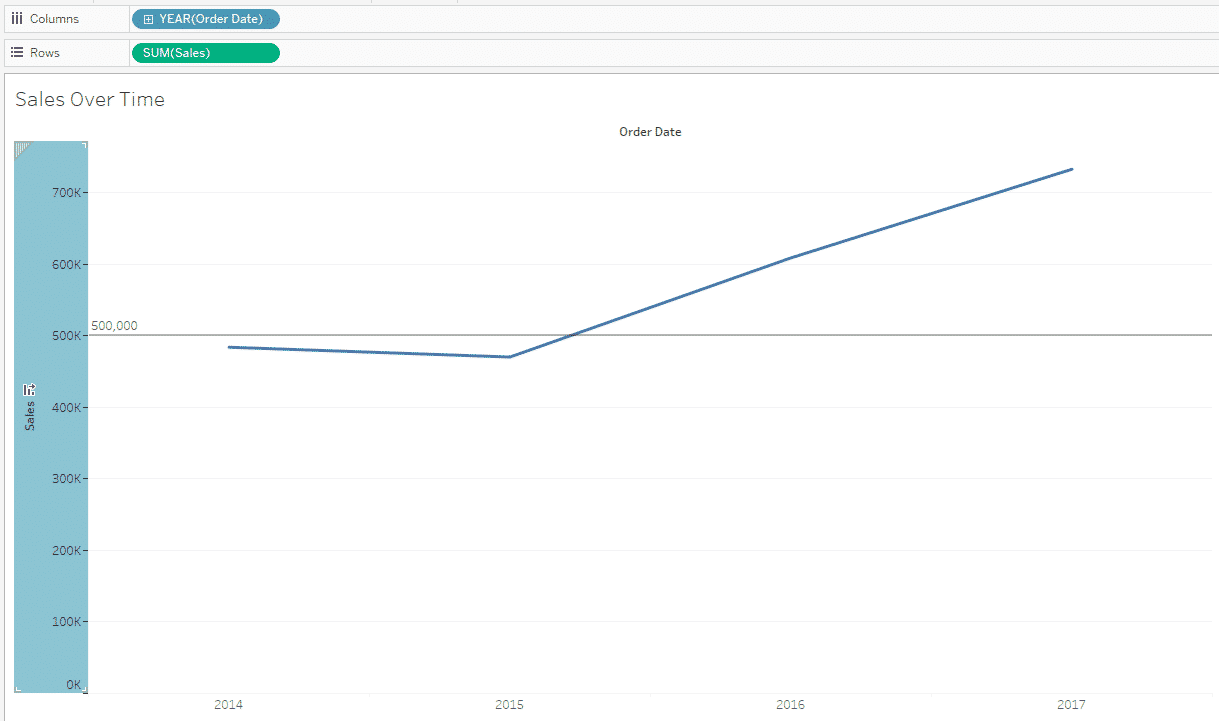
Let’s say we want to add a constant value reference line to the visualization below:
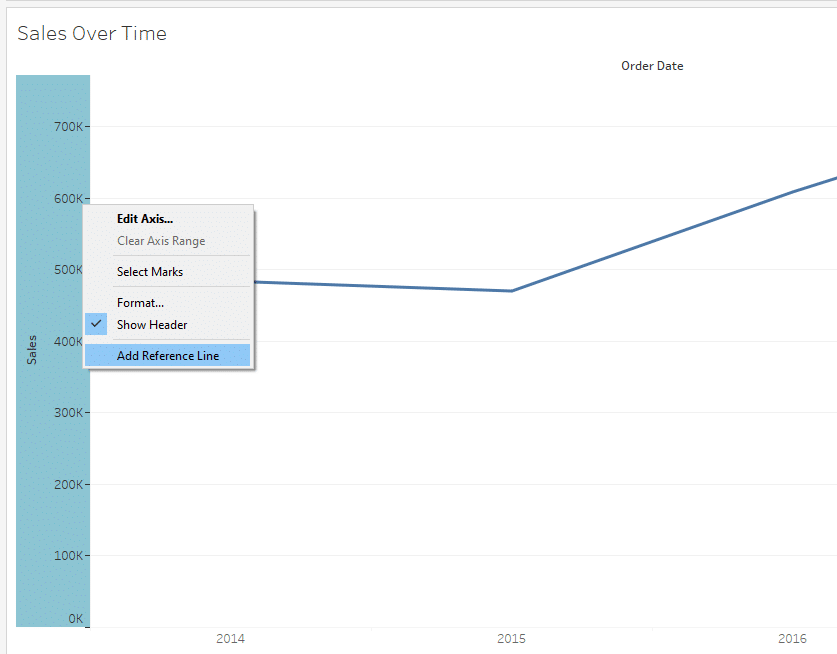
Right-click on the axis where you want to add the reference line and select Add Reference Line from the context menu.
In the Reference Line dialog box, choose “Constant” as the Line option.
Enter the desired value for your custom reference line.
Customize the appearance of the reference line, such as its color, label, and tooltip.
Click OK to apply the custom reference line to your chart. Tableau will add a custom value reference line to your visualization.

How to Remove a Reference Line
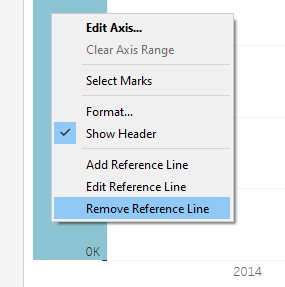
If you’d like to remove reference lines from your visualization, click on the axis that has the reference line.
In the menu, select the Remove Reference Line option.
This will remove the reference lines from your visualization.
Want to take your data analysis skills to the next level, try using Advanced Data Analytics by OpenAI, we run through it in the below video:
Final Thoughts
In this article, we’ve explored the process of adding reference lines in Tableau, a powerful feature that allows you to highlight key data points and enhance the storytelling potential of your visualizations.
Through a step-by-step guide, you’ve learned to create reference lines, customize them, and use them effectively to provide context and comparisons within your data.
These techniques can be particularly useful when you need to highlight specific values, compare different data points, or simply guide your audience’s attention to the most relevant information.
Overall, mastering the art of adding reference lines in Tableau empowers you to create more informative and visually engaging dashboards that effectively convey your data’s insights.
Best of luck in your data analytics journey!
Frequently Asked Questions
In this section, you will find some frequently asked questions you may have when working with reference lines in Tableau.

How do I add a target line in Tableau?
To add a target line in Tableau, follow these steps:
Right-click on the axis where you want to add the target line.
Select Add Reference Line.
In the Reference Line dialog, choose “Constant” as the Line option.
Enter the desired value for your target line.
Customize the appearance of the reference line, such as its color, label, and tooltip.
Click OK to apply the target line to your chart.
What are reference lines in Tableau?
Reference lines in Tableau are horizontal, vertical, or diagonal lines that you can add to your charts to represent specific values, such as averages, medians, or target values.
These lines provide a visual reference point for comparing data points in your chart.
How to add a reference line to a bar chart in Tableau?
To add a reference line to a bar chart in Tableau, follow these steps:
Create a bar chart by dragging a measure to the Columns shelf and a dimension to the Rows shelf.
Right-click on the axis of the measure you want to reference.
Select Add Reference Line.
In the Reference Line dialog, choose the desired Line option (Constant, Average, Median, etc.).
Enter the value for your reference line or leave it as the default for average and median.
Customize the appearance of the reference line, such as its color, label, and tooltip.
Click OK to apply the reference line to your bar chart.
How can I add a dynamic reference line in Tableau?
To add a dynamic reference line in Tableau, follow these steps:
Create a calculated field that generates the values for your dynamic reference line.
Right-click on the axis where you want to add the reference line.
Select Add Reference Line.
In the Reference Line dialog, choose “Value” as the Line option.
Select the calculated field you created in step 1 as the value for the reference line.
Customize the appearance of the reference line, such as its color, label, and tooltip.
Click OK to apply the dynamic reference line to your chart.