Tableau comes with various tools that enable data analysts to create dynamic and user-friendly visualizations. One such tool is Tableau parameters, which allows for interactivity in dashboards and visualizations.
A Tableau parameter is a unique workbook variable that can represent a number, date, or boolean value. Parameters allow users to replace a constant value in a calculation, filter, or reference line, making it possible to create interactive and dynamic visualizations that can adapt to various scenarios.
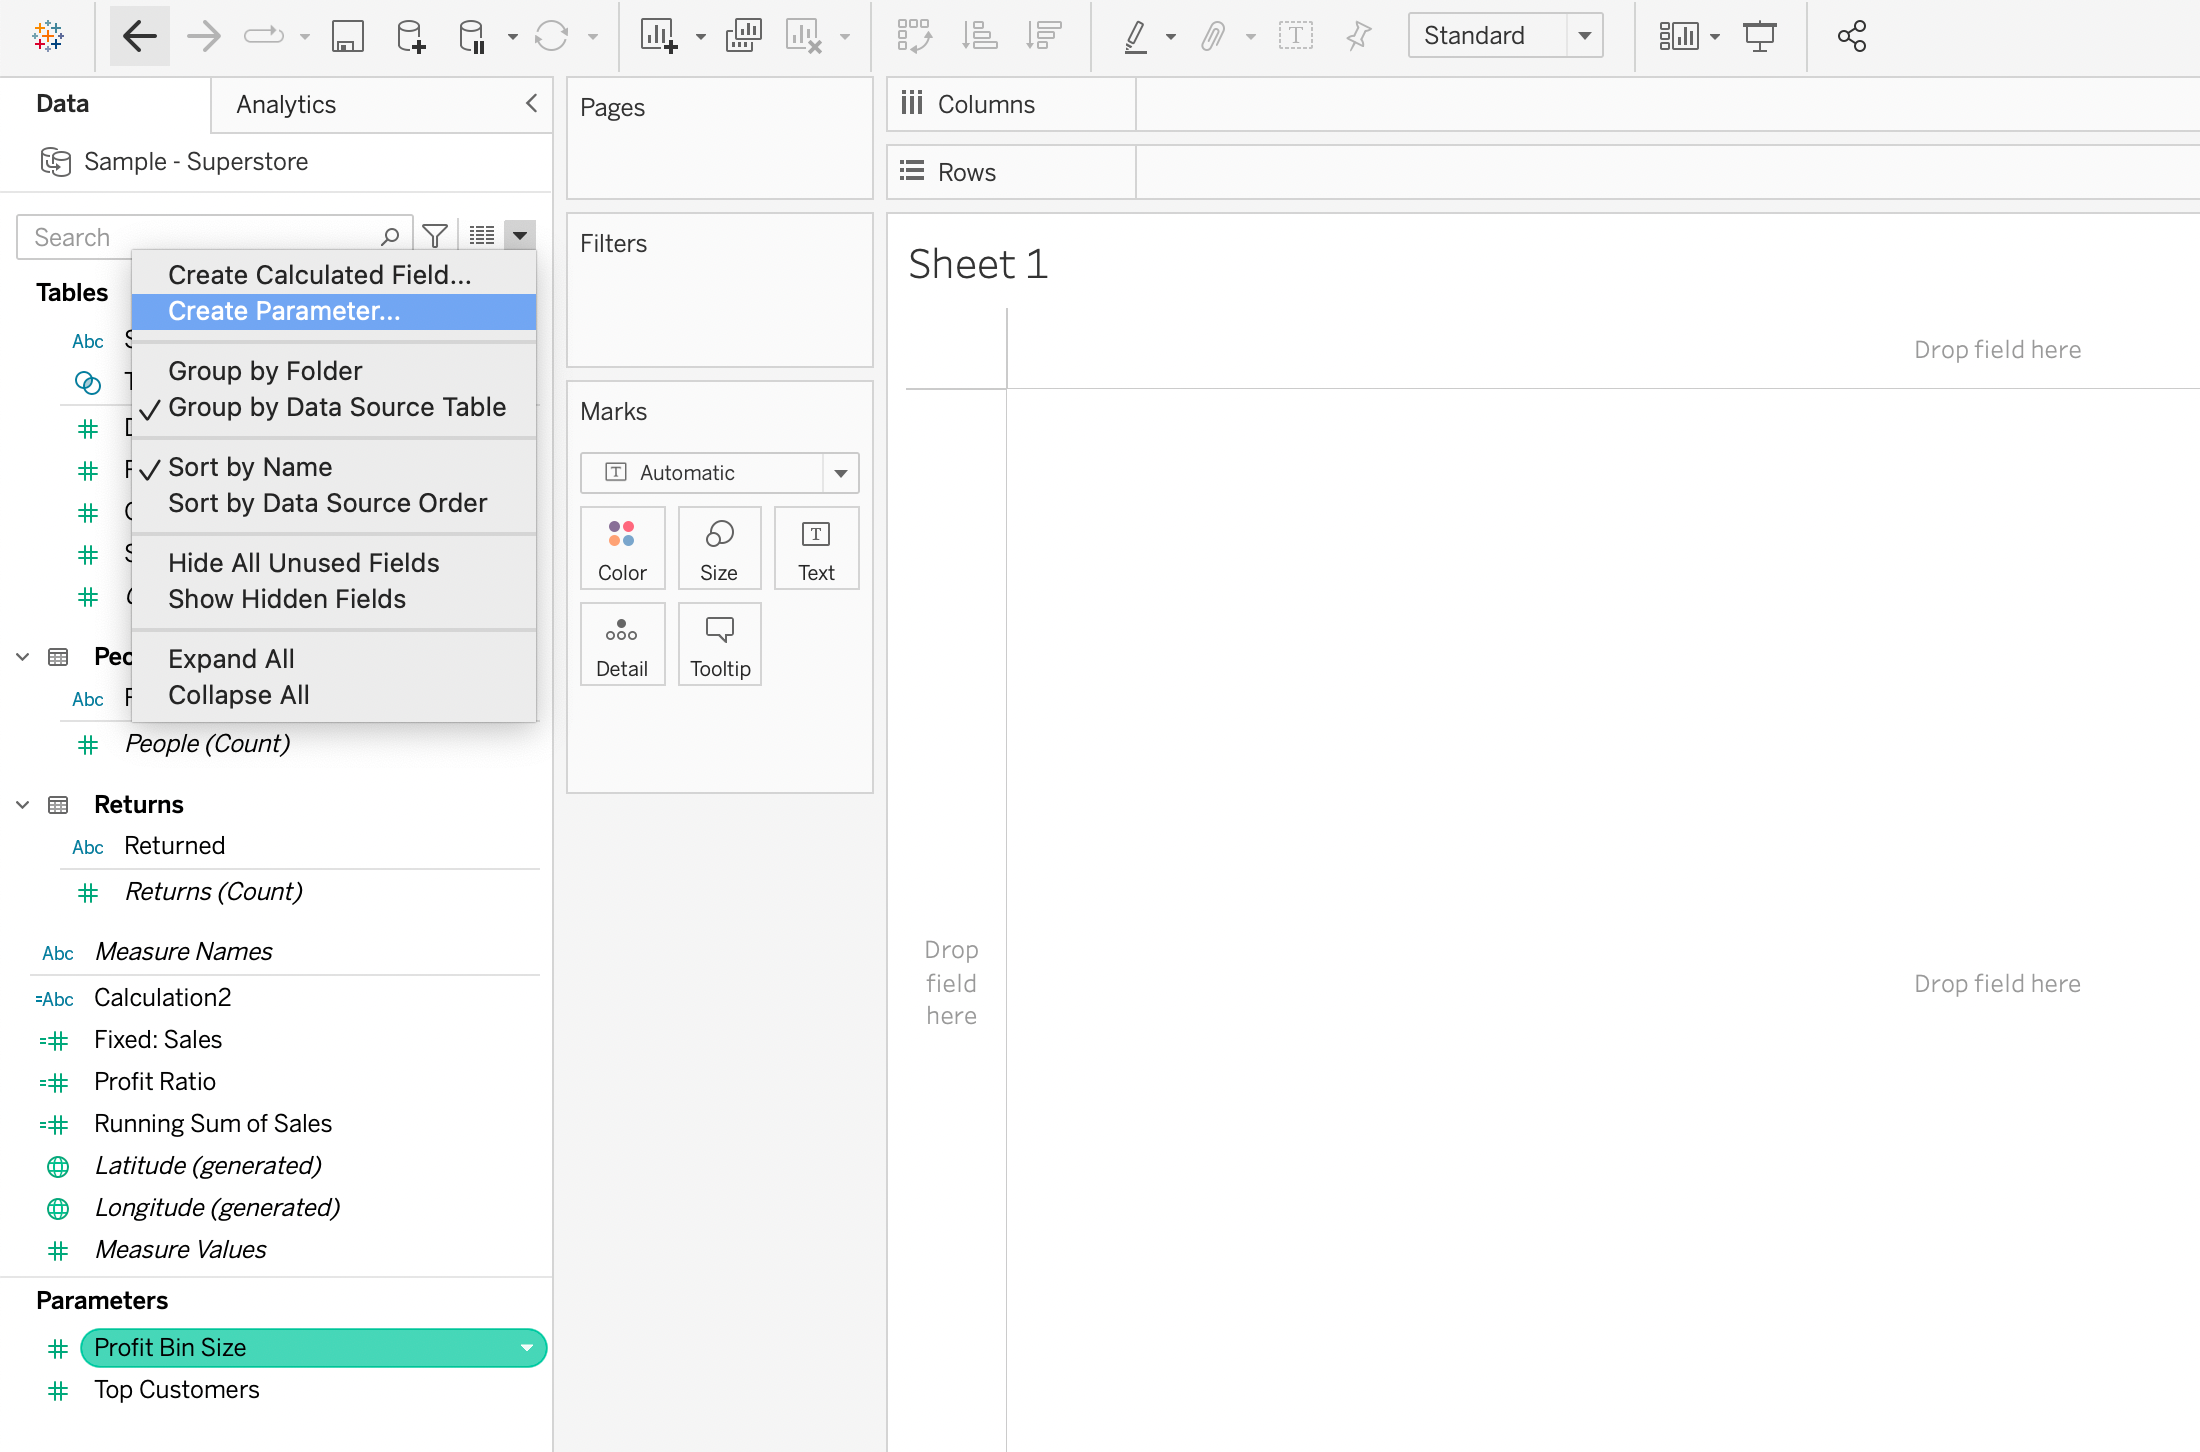
To use parameters in Tableau, you first need to create them by right-clicking in the Parameters area of the Data pane and selecting “Create Parameter”. Then you can adjust its properties. Once created, you can use this parameter in your calculations or filters.


Implementing parameters in Tableau is straightforward, but understanding the concepts and techniques involved is essential for making the most out of this feature. In this article, we will discuss Tableau parameters, their basics, and how to use them in projects.
Let’s get into it!
What Are Parameters in Tableau
Parameters in Tableau are dynamic inputs that replace constant values in calculations, filters, and references.
Parameters add flexibility and interactivity to your visualization. They are global features, meaning that a single parameter retains the same value throughout the entire Tableau workbook, regardless of the connections between sheets and data sources.

Another important feature of Tableau parameters is the ability to pre-define the scope of all the values available for input. You can configure parameters to present a list of predefined values or a range of values, allowing users to choose from a set of specific options.
You can also connect parameters to the data source, enabling them to automatically refresh whenever the underlying field values change.

How to Create Parameters in Tableau
In this section, we will explore the steps necessary to create parameters in Tableau. Each step will be followed by its demonstration to help you better understand the concepts.
Follow the steps given below to create a parameter in Tableau:
1) First, to create a parameter, navigate to the Data pane in your Tableau workspace.
Click the drop-down arrow in the upper right corner and select Create Parameter.
This will open the Create Parameter dialog box where you can configure the parameter’s settings.
2) In the dialog box, begin by giving the field a Name. This should be a clear, concise title that tells viewers what changing the parameter will do.
For example, if the parameter allows the user to choose between different time periods, a suitable name might be Select Time Period.
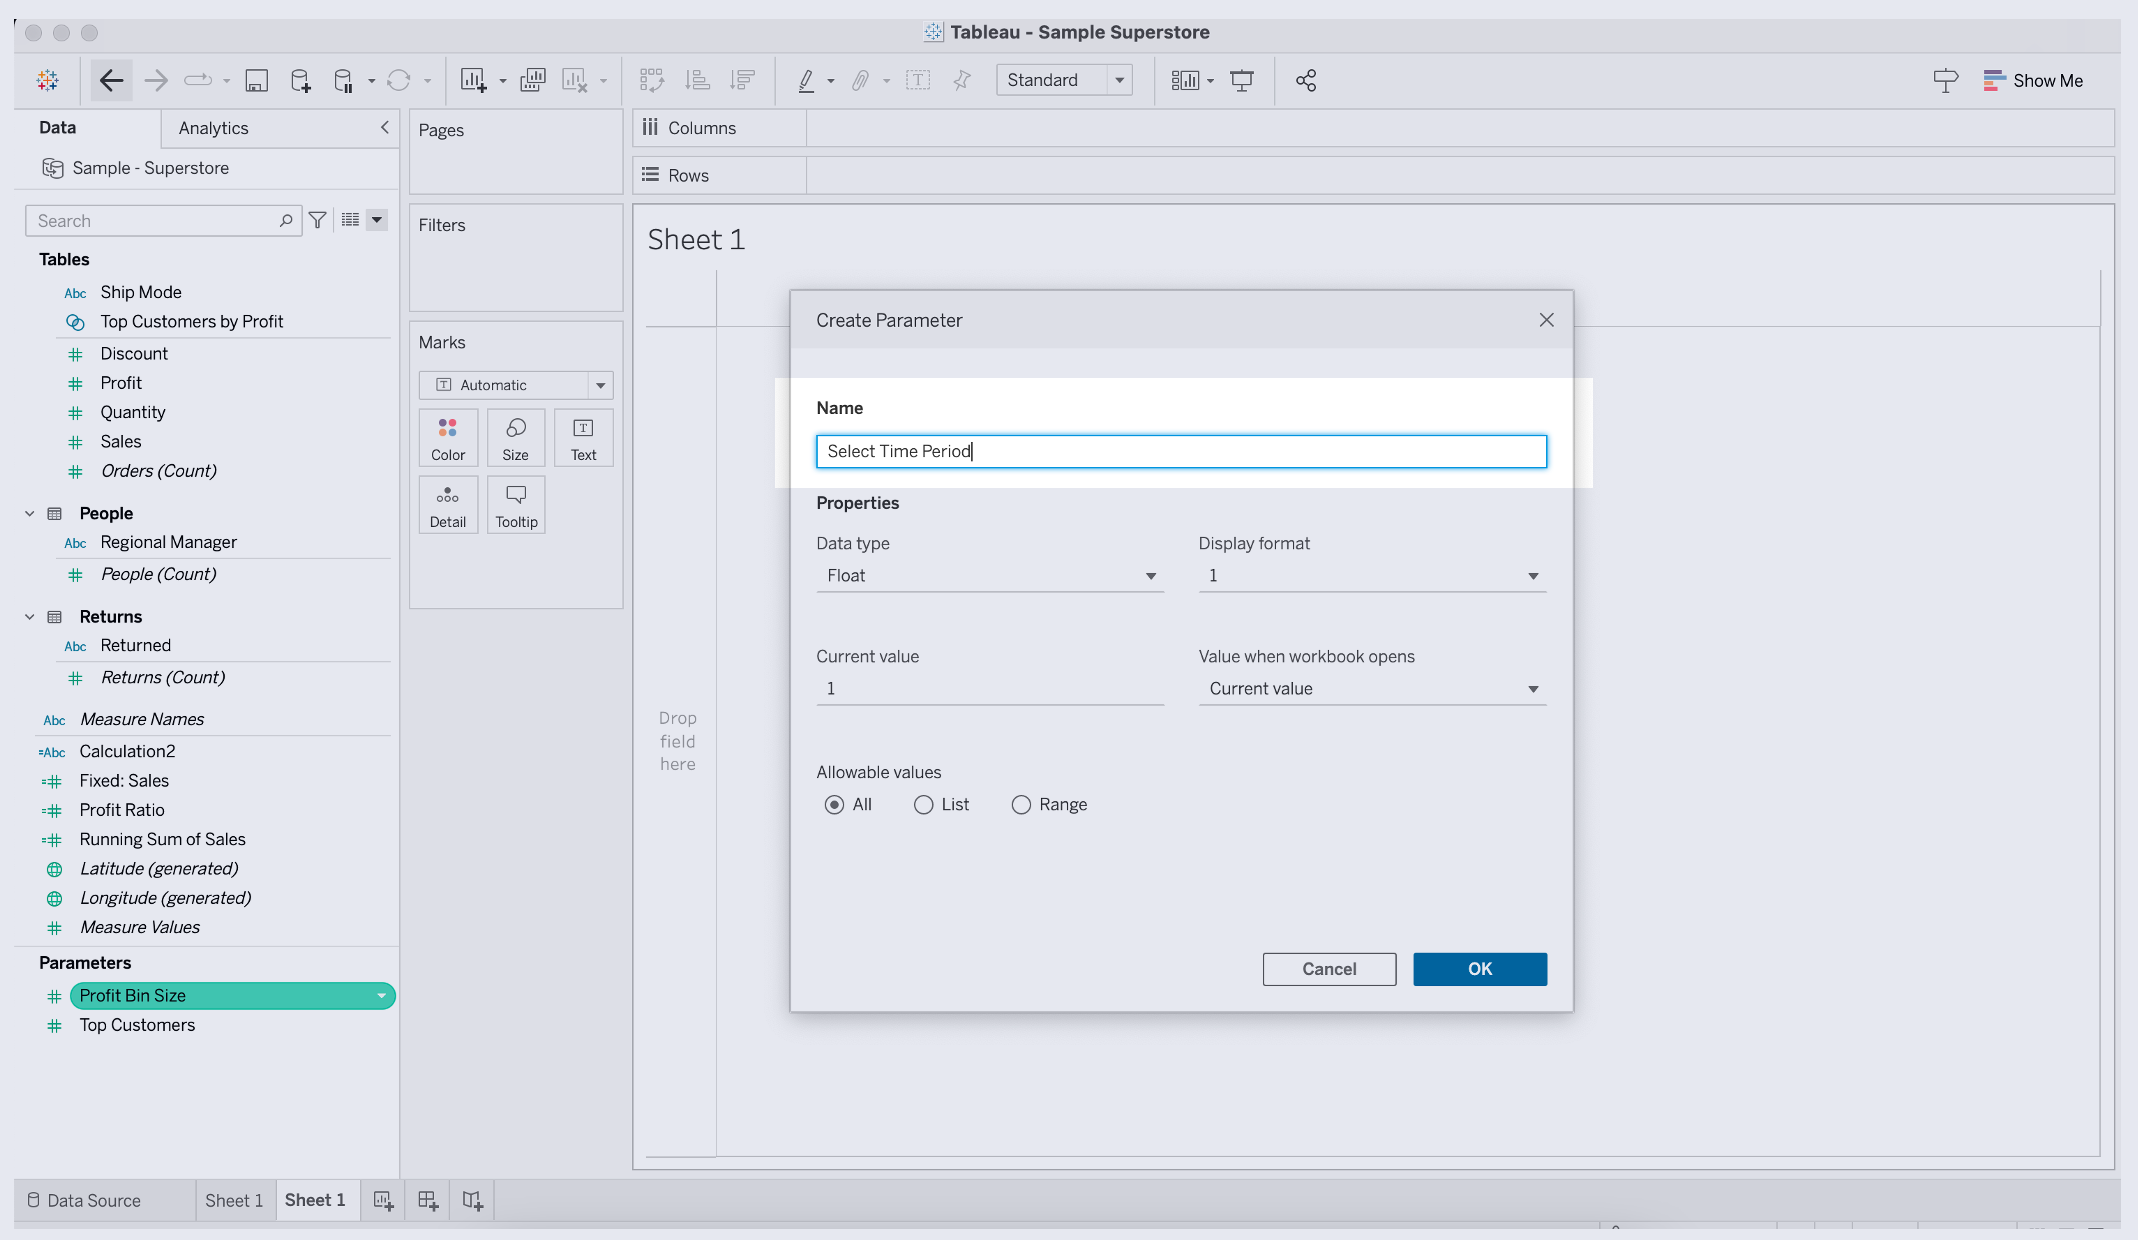
3) Next, specify the data type for the values the parameter will accept.
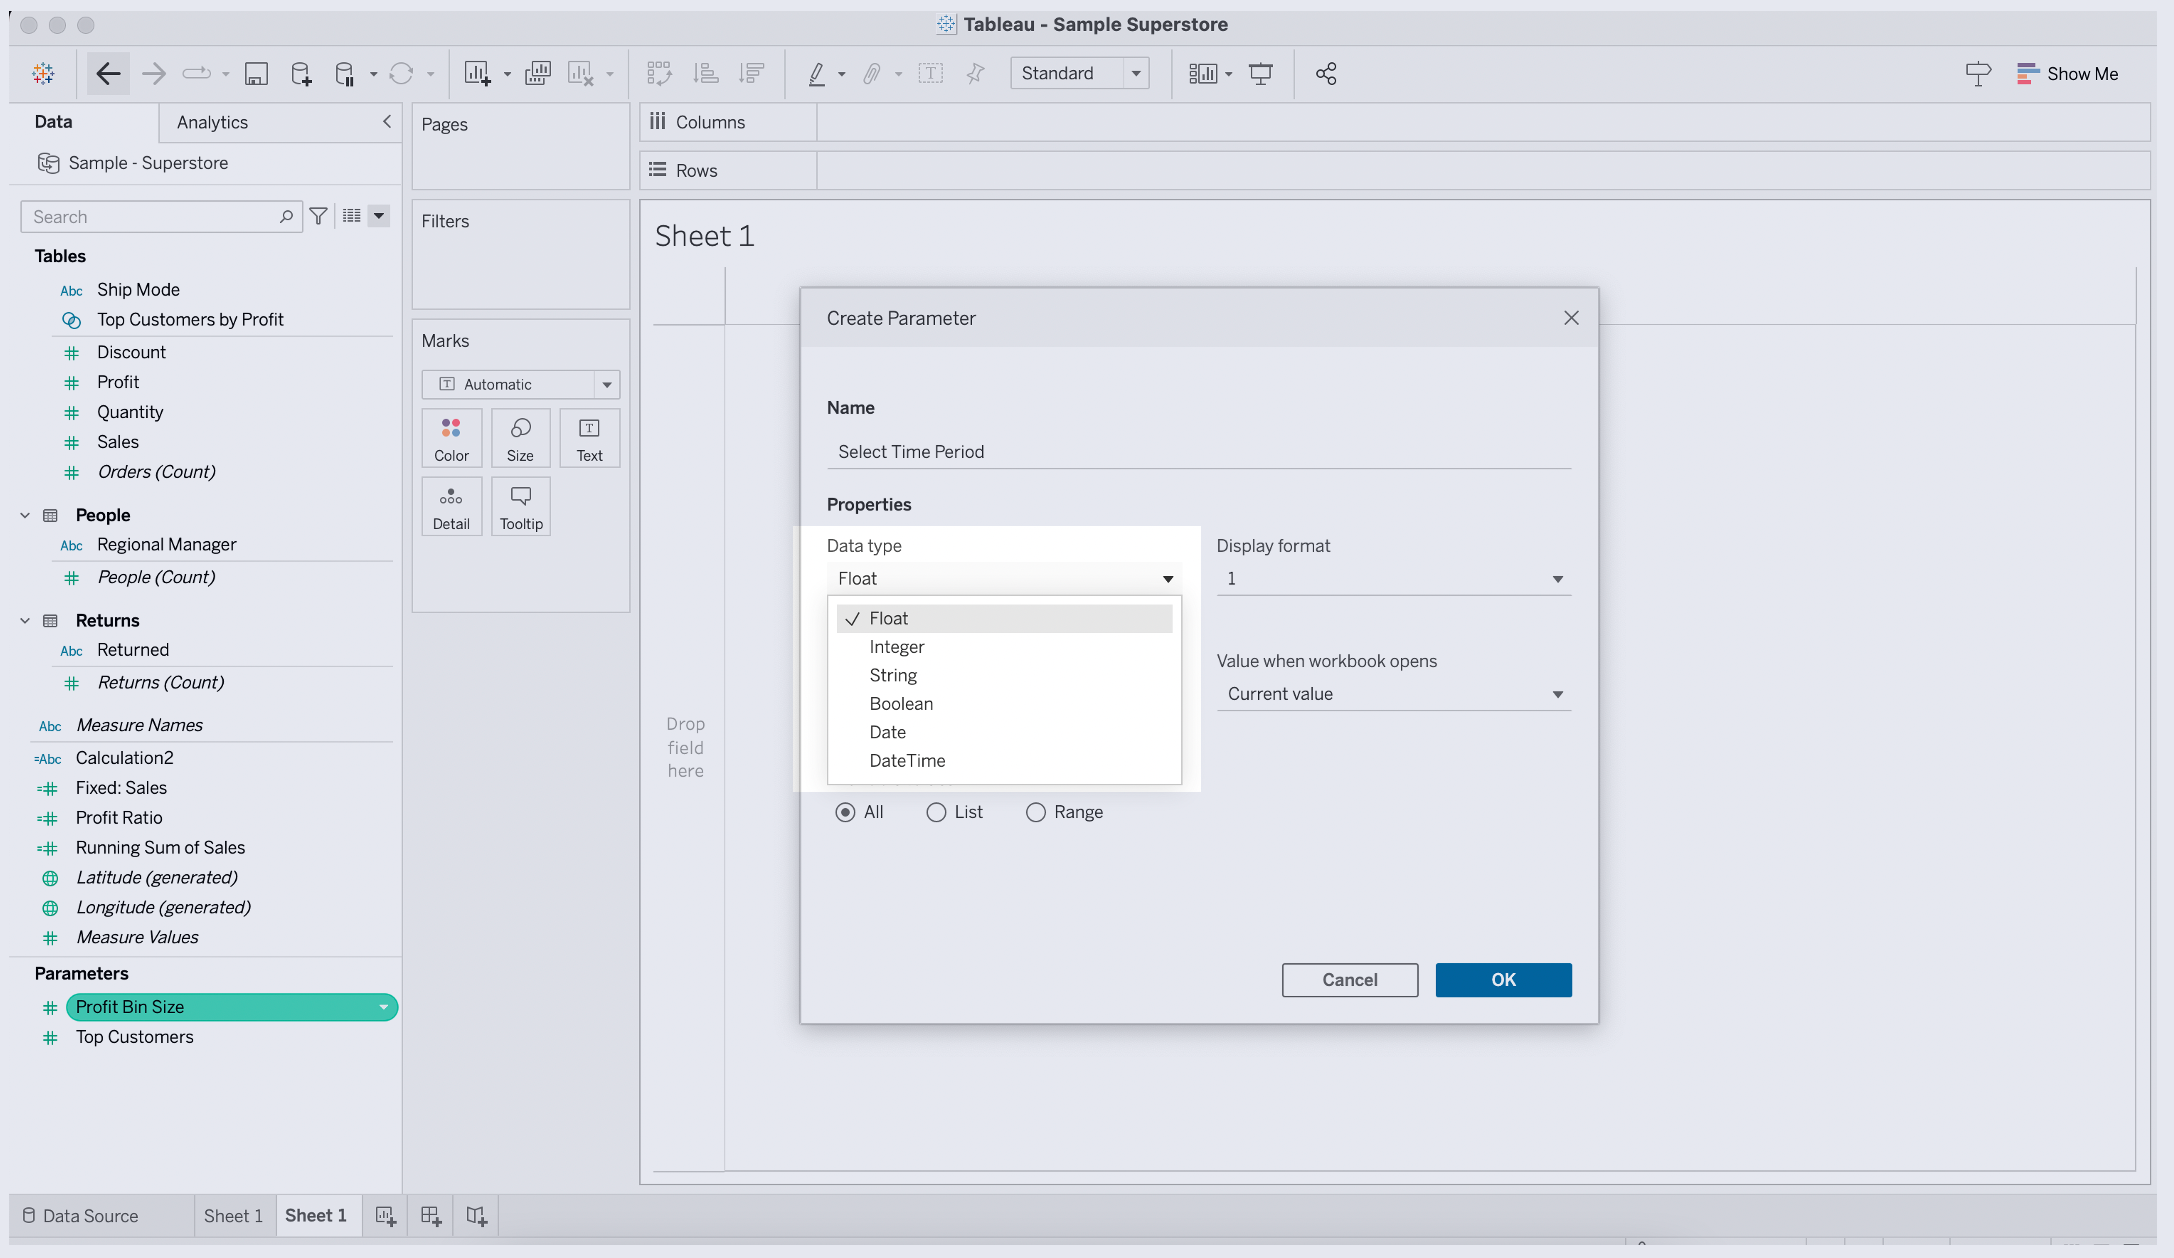
Tableau offers several options for data type, including:
- String: textual data
- Integer: whole numbers
- Float: decimal numbers
- Date: date values
- Date & Time: date and time values
- Boolean: logical True and False values
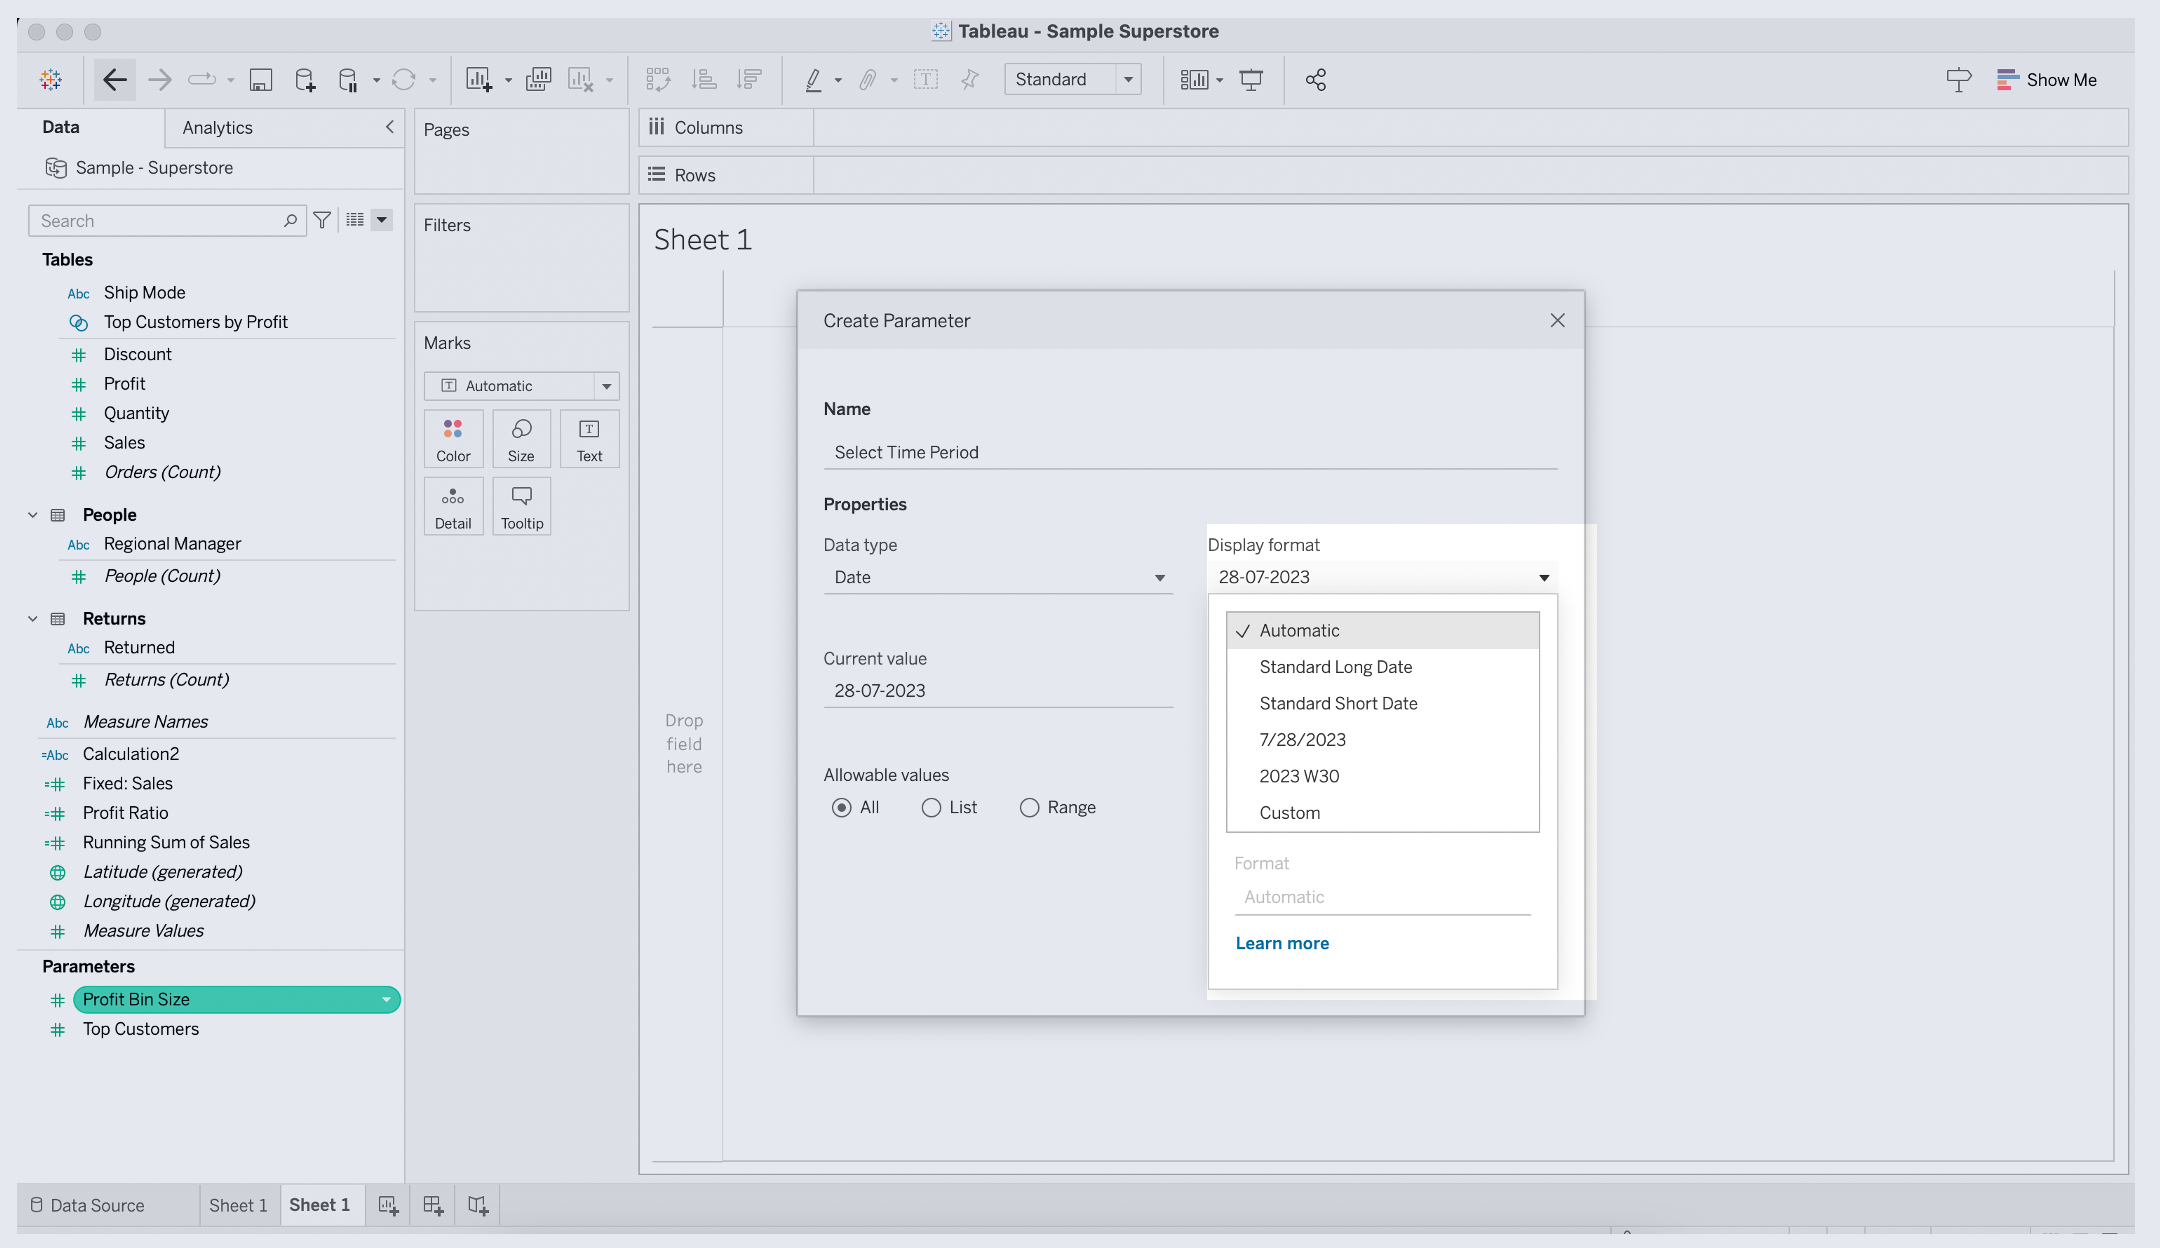
4) Customize the display format.
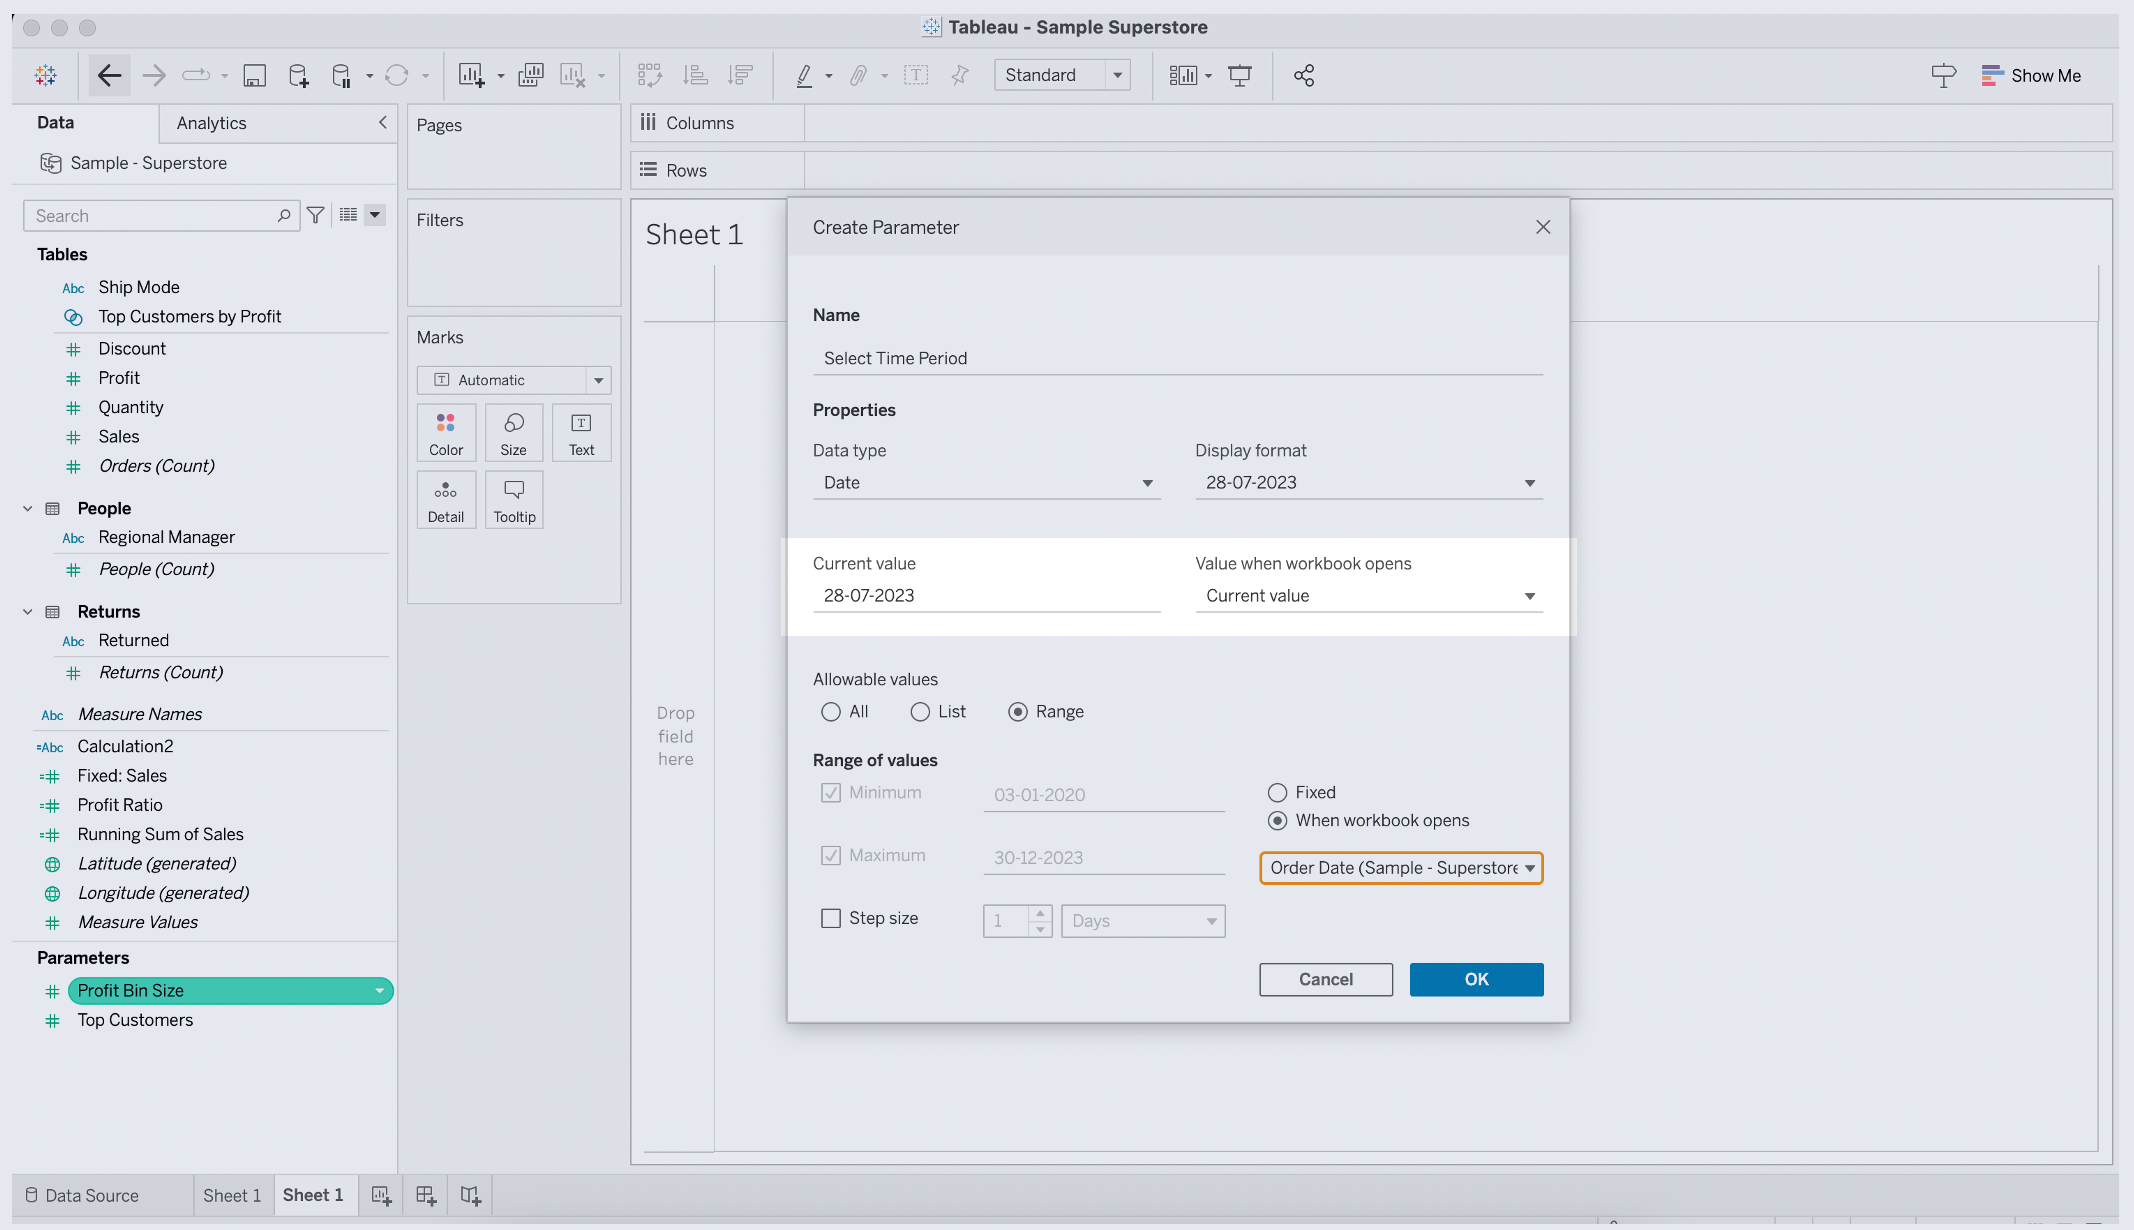
5) Another parameter option to set up is Allowable Values.
There are generally three options for this:
1) All: Allows users to input any value within the specified data type
2) List: Restricts user input to a predetermined set of values
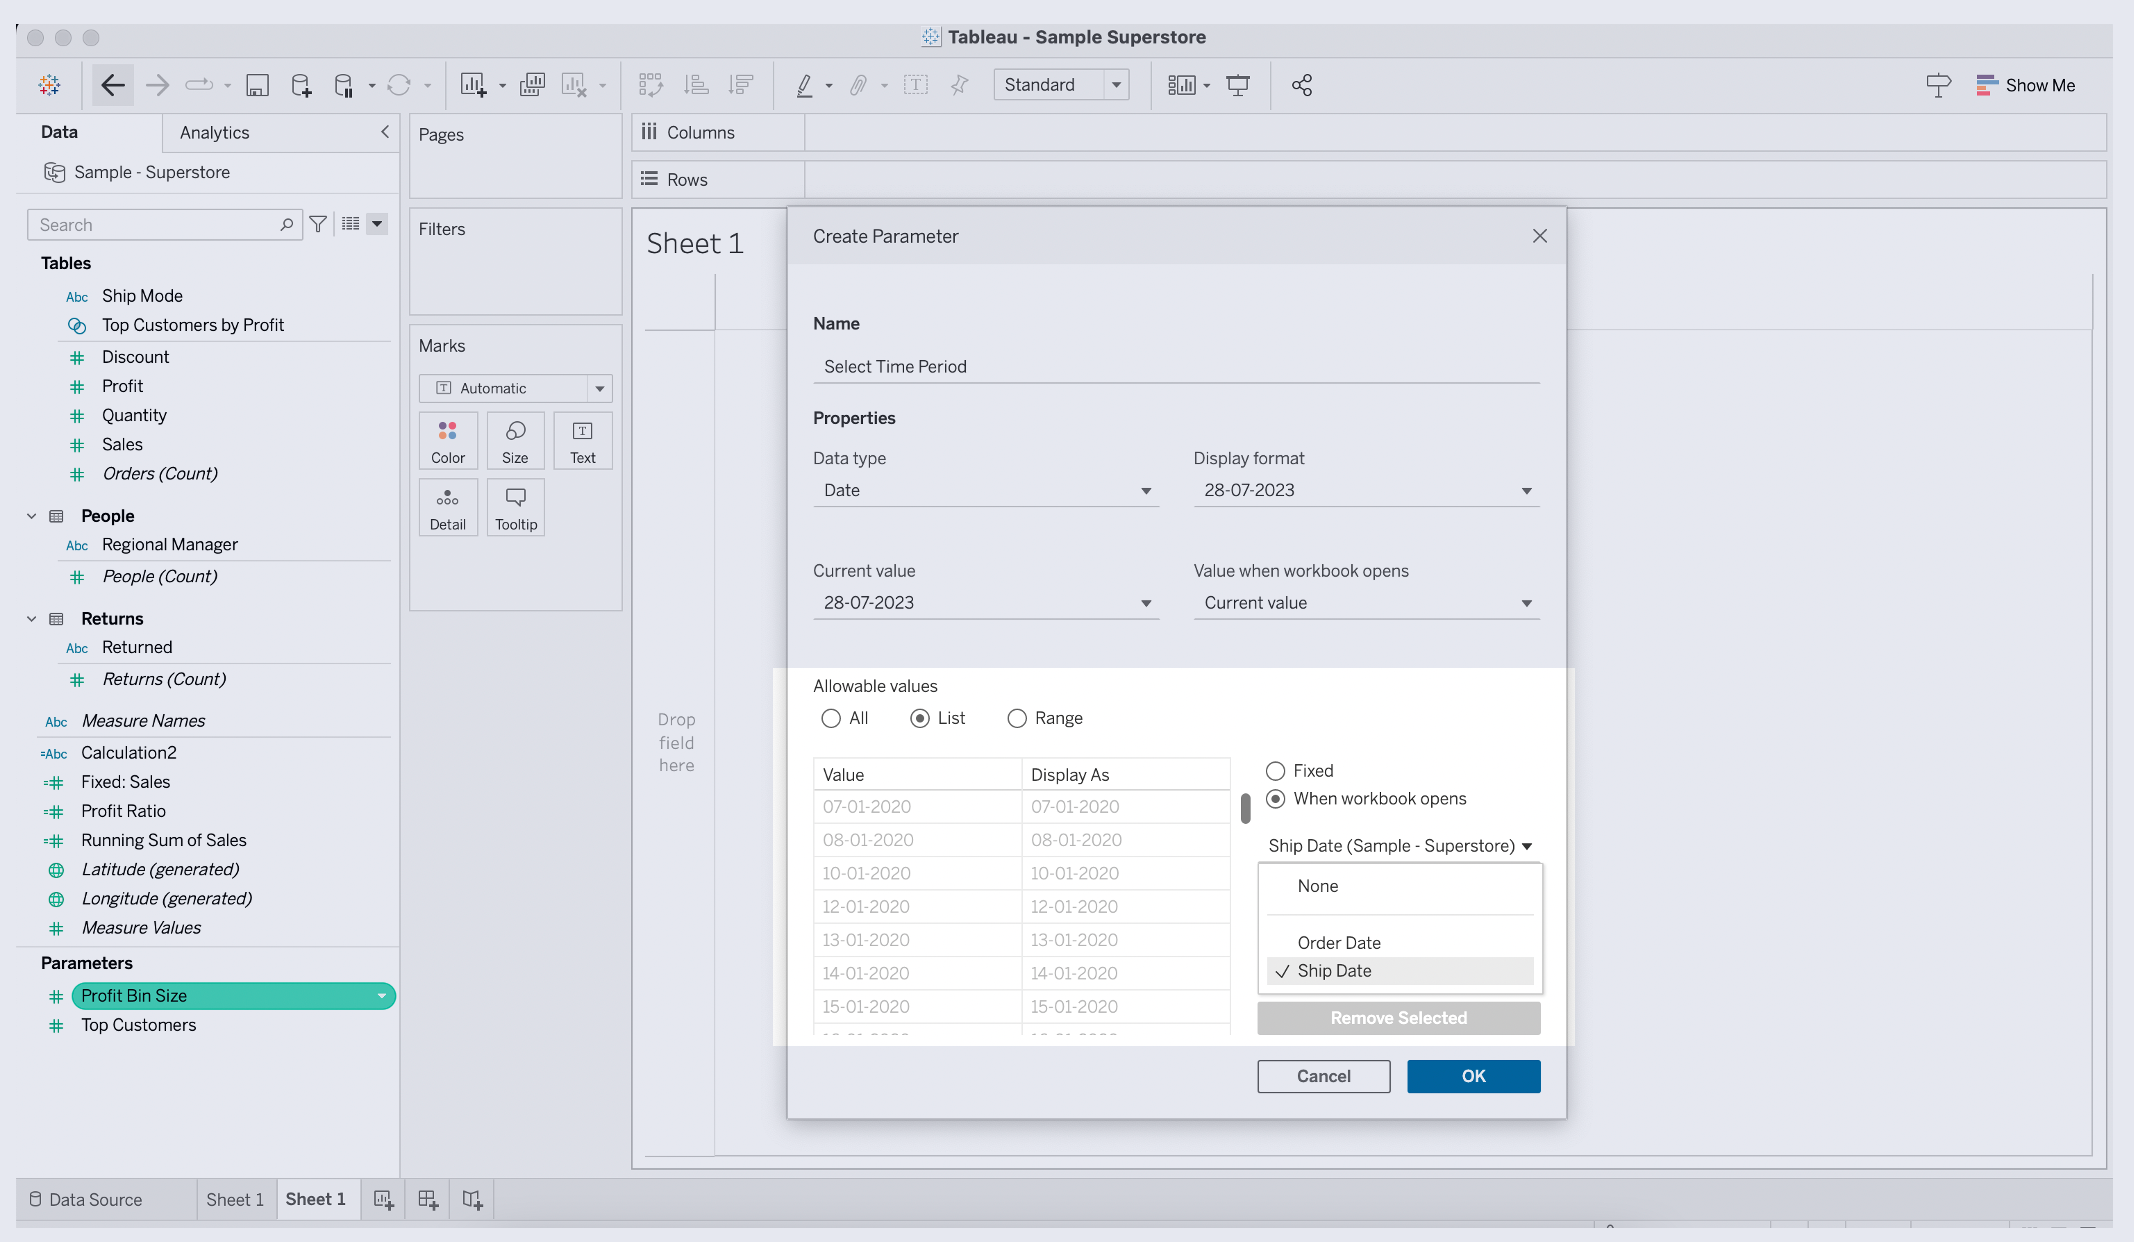
3) Range: Limits user input to a continuous range of values

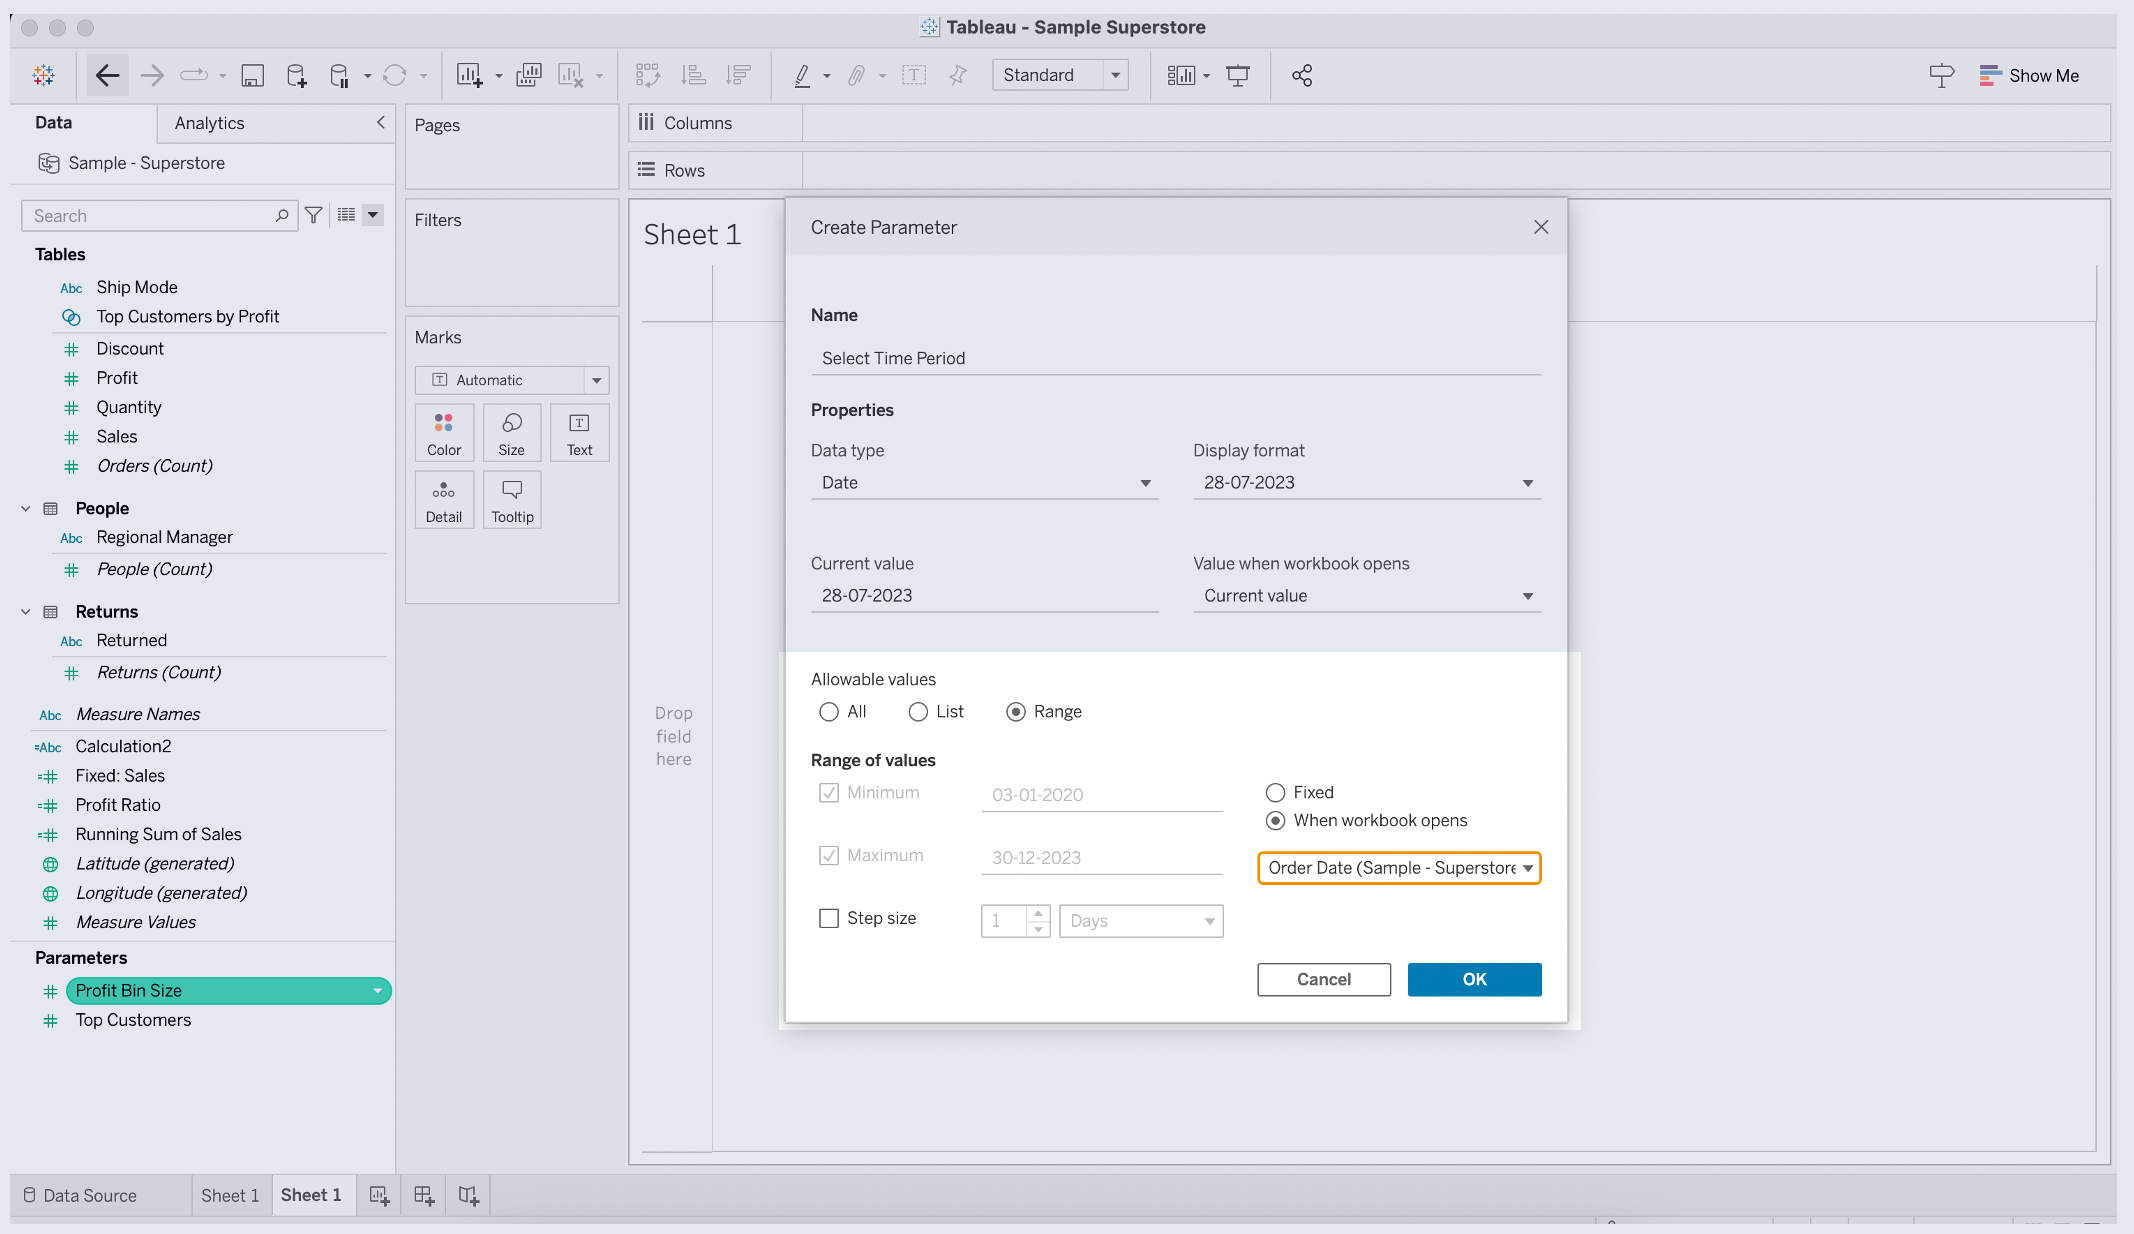
For instance, if you are working with a numeric parameter, such as the quantity of items sold, you can select a range with a specified minimum and maximum value, ensuring the user’s input falls within that domain.
6) Finally, specify a Current Value for the parameter. This value will be pre-selected when users first interact with the visualization and can be updated by the user as needed.
By following these steps, you can confidently create and name a parameter in Tableau that provides clear, interactive options for users while also maintaining a neutral, knowledgeable tone.
How to Show Parameter Control in Tableau
In order to enable user control over parameters, you need to add parameter control to the dashboard.
From the Objects pane on the left, locate the newly created parameter in the “Parameters” section, located under the values section.
Click on a down arrow and select “Show Parameter”.
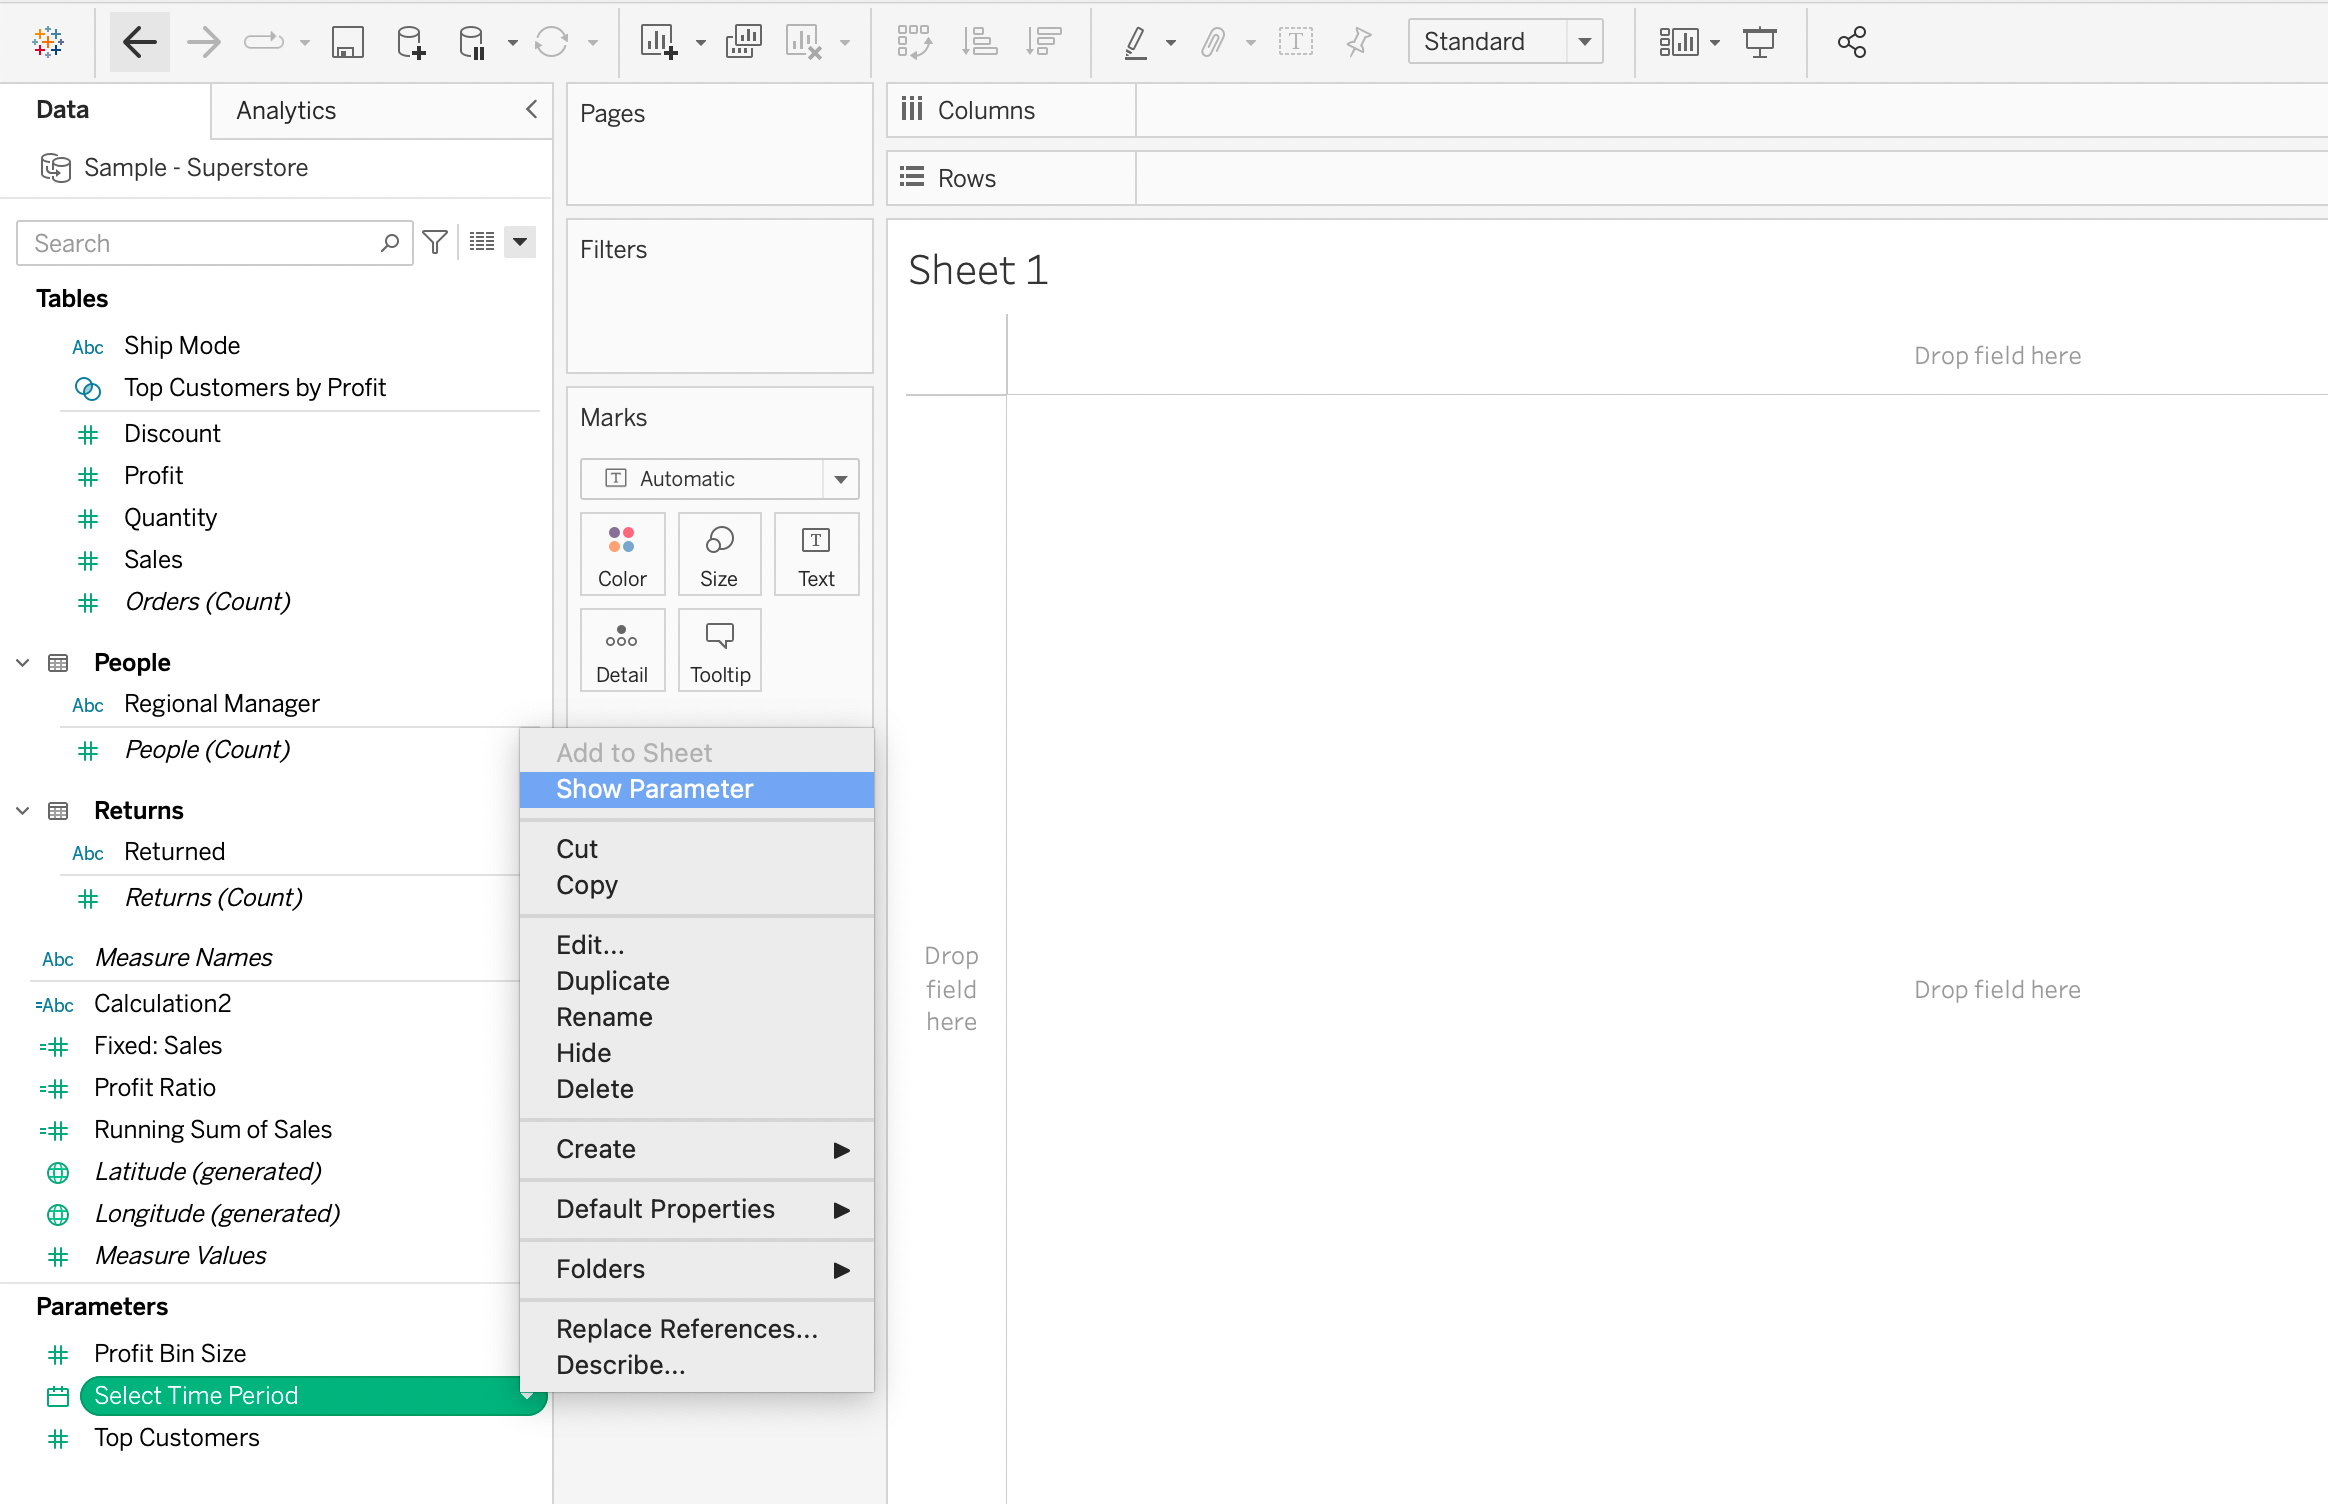
This will allow the user to see the parameter options available to them.
Next, let’s focus on practical techniques of parameter utilization in Tableau workbook.
6 Practical Examples of Parameters Usage
Incorporating parameters into your worksheet can make your visualizations more engaging, and an improved user experience will contribute to more insightful data analysis.
In this section, we will look at examples of using parameters in Tableau. The examples will help you better understand the use cases of parameters.

Specifically, we will go over the following:
- Parameters Inside Calculated Fields
- Adding Parameters to Filters
- Reference Lines and Chart Customization
- Top N Parameter
- Swapping Measures and Dimensions
- Parameters Actions
1) Parameters Inside Calculated Fields
When you create a parameter, you can reference it in a calculated field just like you would with any other data source column.
For example, you can use a parameter to set a threshold value that affects the color or size of marks in the visualization.
By allowing users to adjust the parameter, they can dynamically change the visualization to explore different scenarios and gain deeper insights.
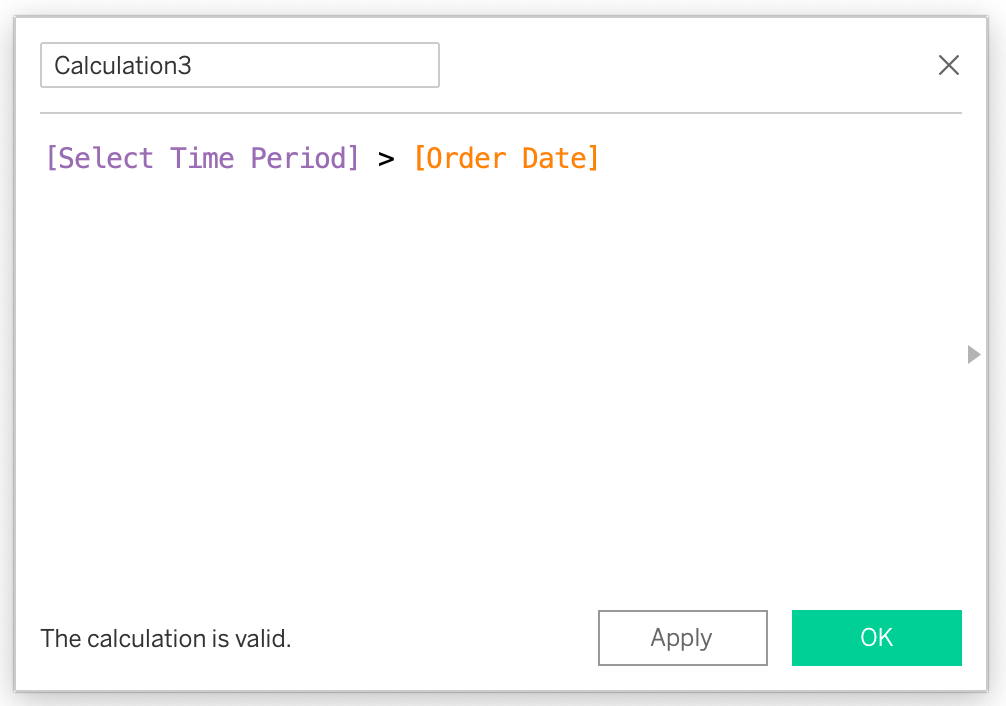
In the calculated field edit window, you’ll notice a color distinction between parameters and data source fields.
Parameters are represented in violet, while data source fields are indicated in yellow.
This color coding makes it easy to identify and differentiate between parameters and data source fields, helping you accurately reference and use them in your calculations.
2) Adding Parameters to Filters
You can add parameters to filters to dynamically alter the displayed data according to user inputs.
For example, let’s say you have a bar graph showing sales data from Sample Superstore dataset.
Let’s use the “Select Time Period” parameter created in “Create Parameters” paragraph.

Follow the steps given below to apply it as a filter:
1) Open a calculated editor and type the following formula:
IF [Ship Date] >= [Select Time Period] THEN TRUE END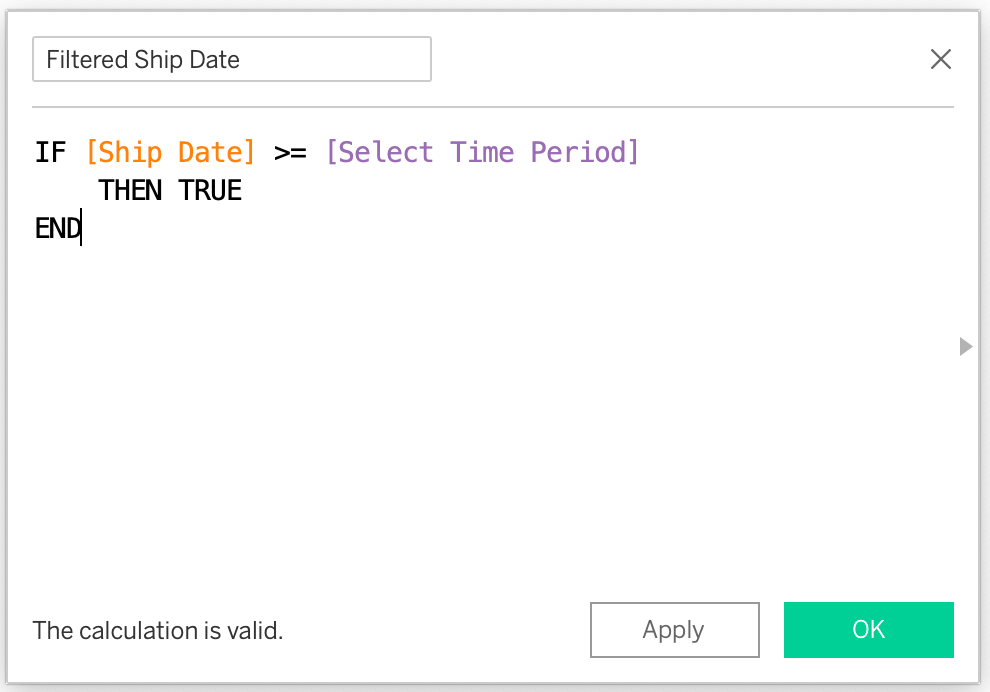
2) Drag this calculated field to the Filters shelf and set it to True.
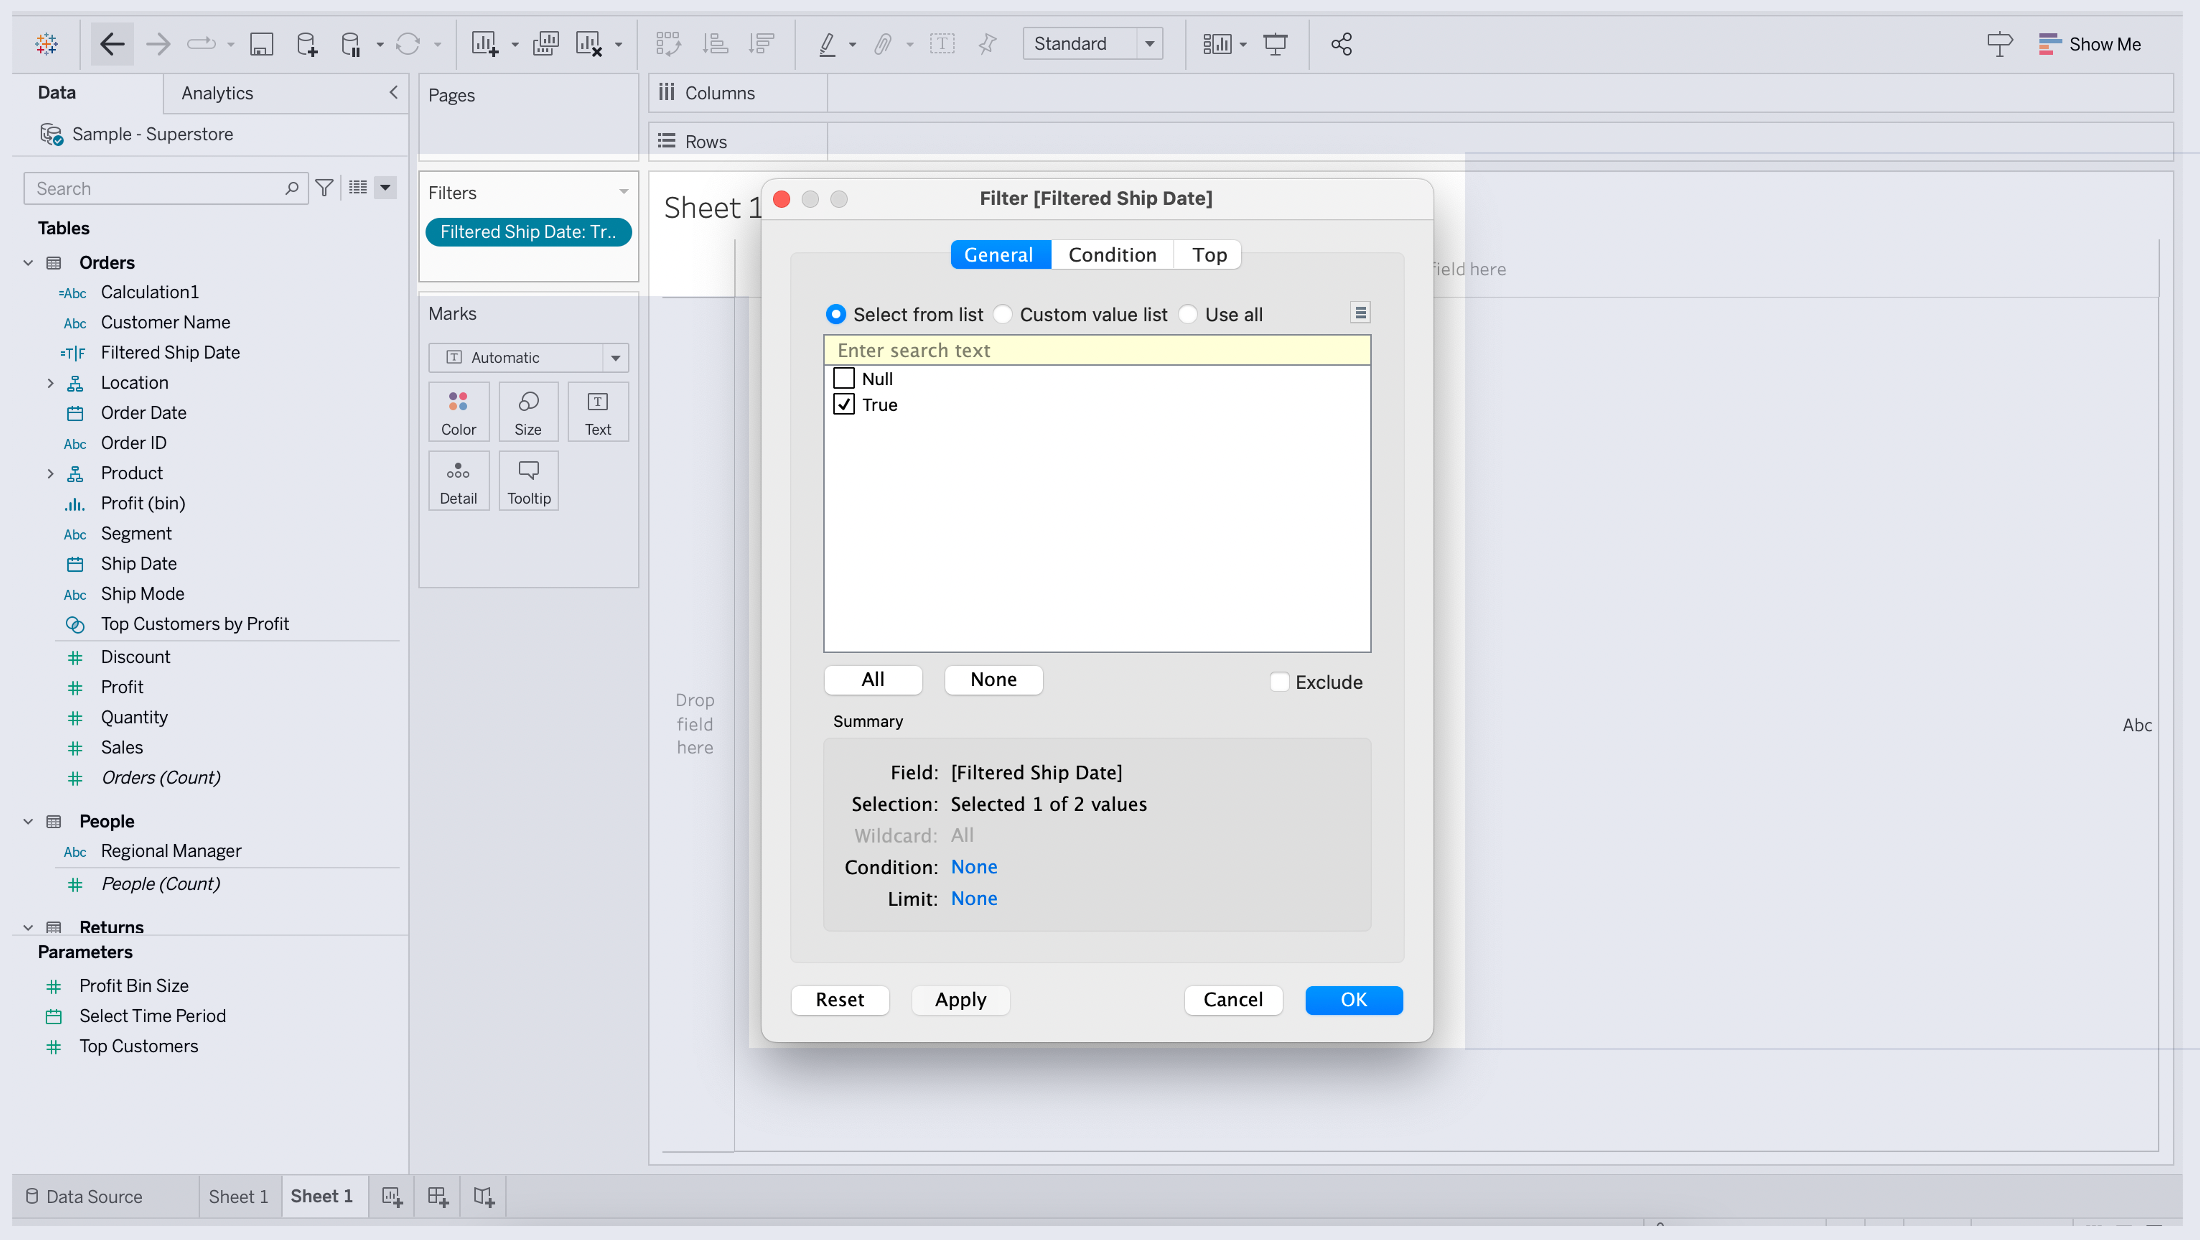
Your chart will now be filtered by Ship Date, limited by the date selected in the parameter.
3) Reference Lines and Chart Customization
Parameters can also be used in combination with reference lines to provide more context to your visualizations.
For example, you can use a parameter or constant value to insert a horizontal line into the bar graph. To do this, you can follow the steps given below:
1) Create a Target that allows users to input a number value.
2) Add a reference line to your bar graph, using the following settings:
In the Analytics pane, select Reference Line.
Drag the Reference Line to the chart and drop it over a table icon
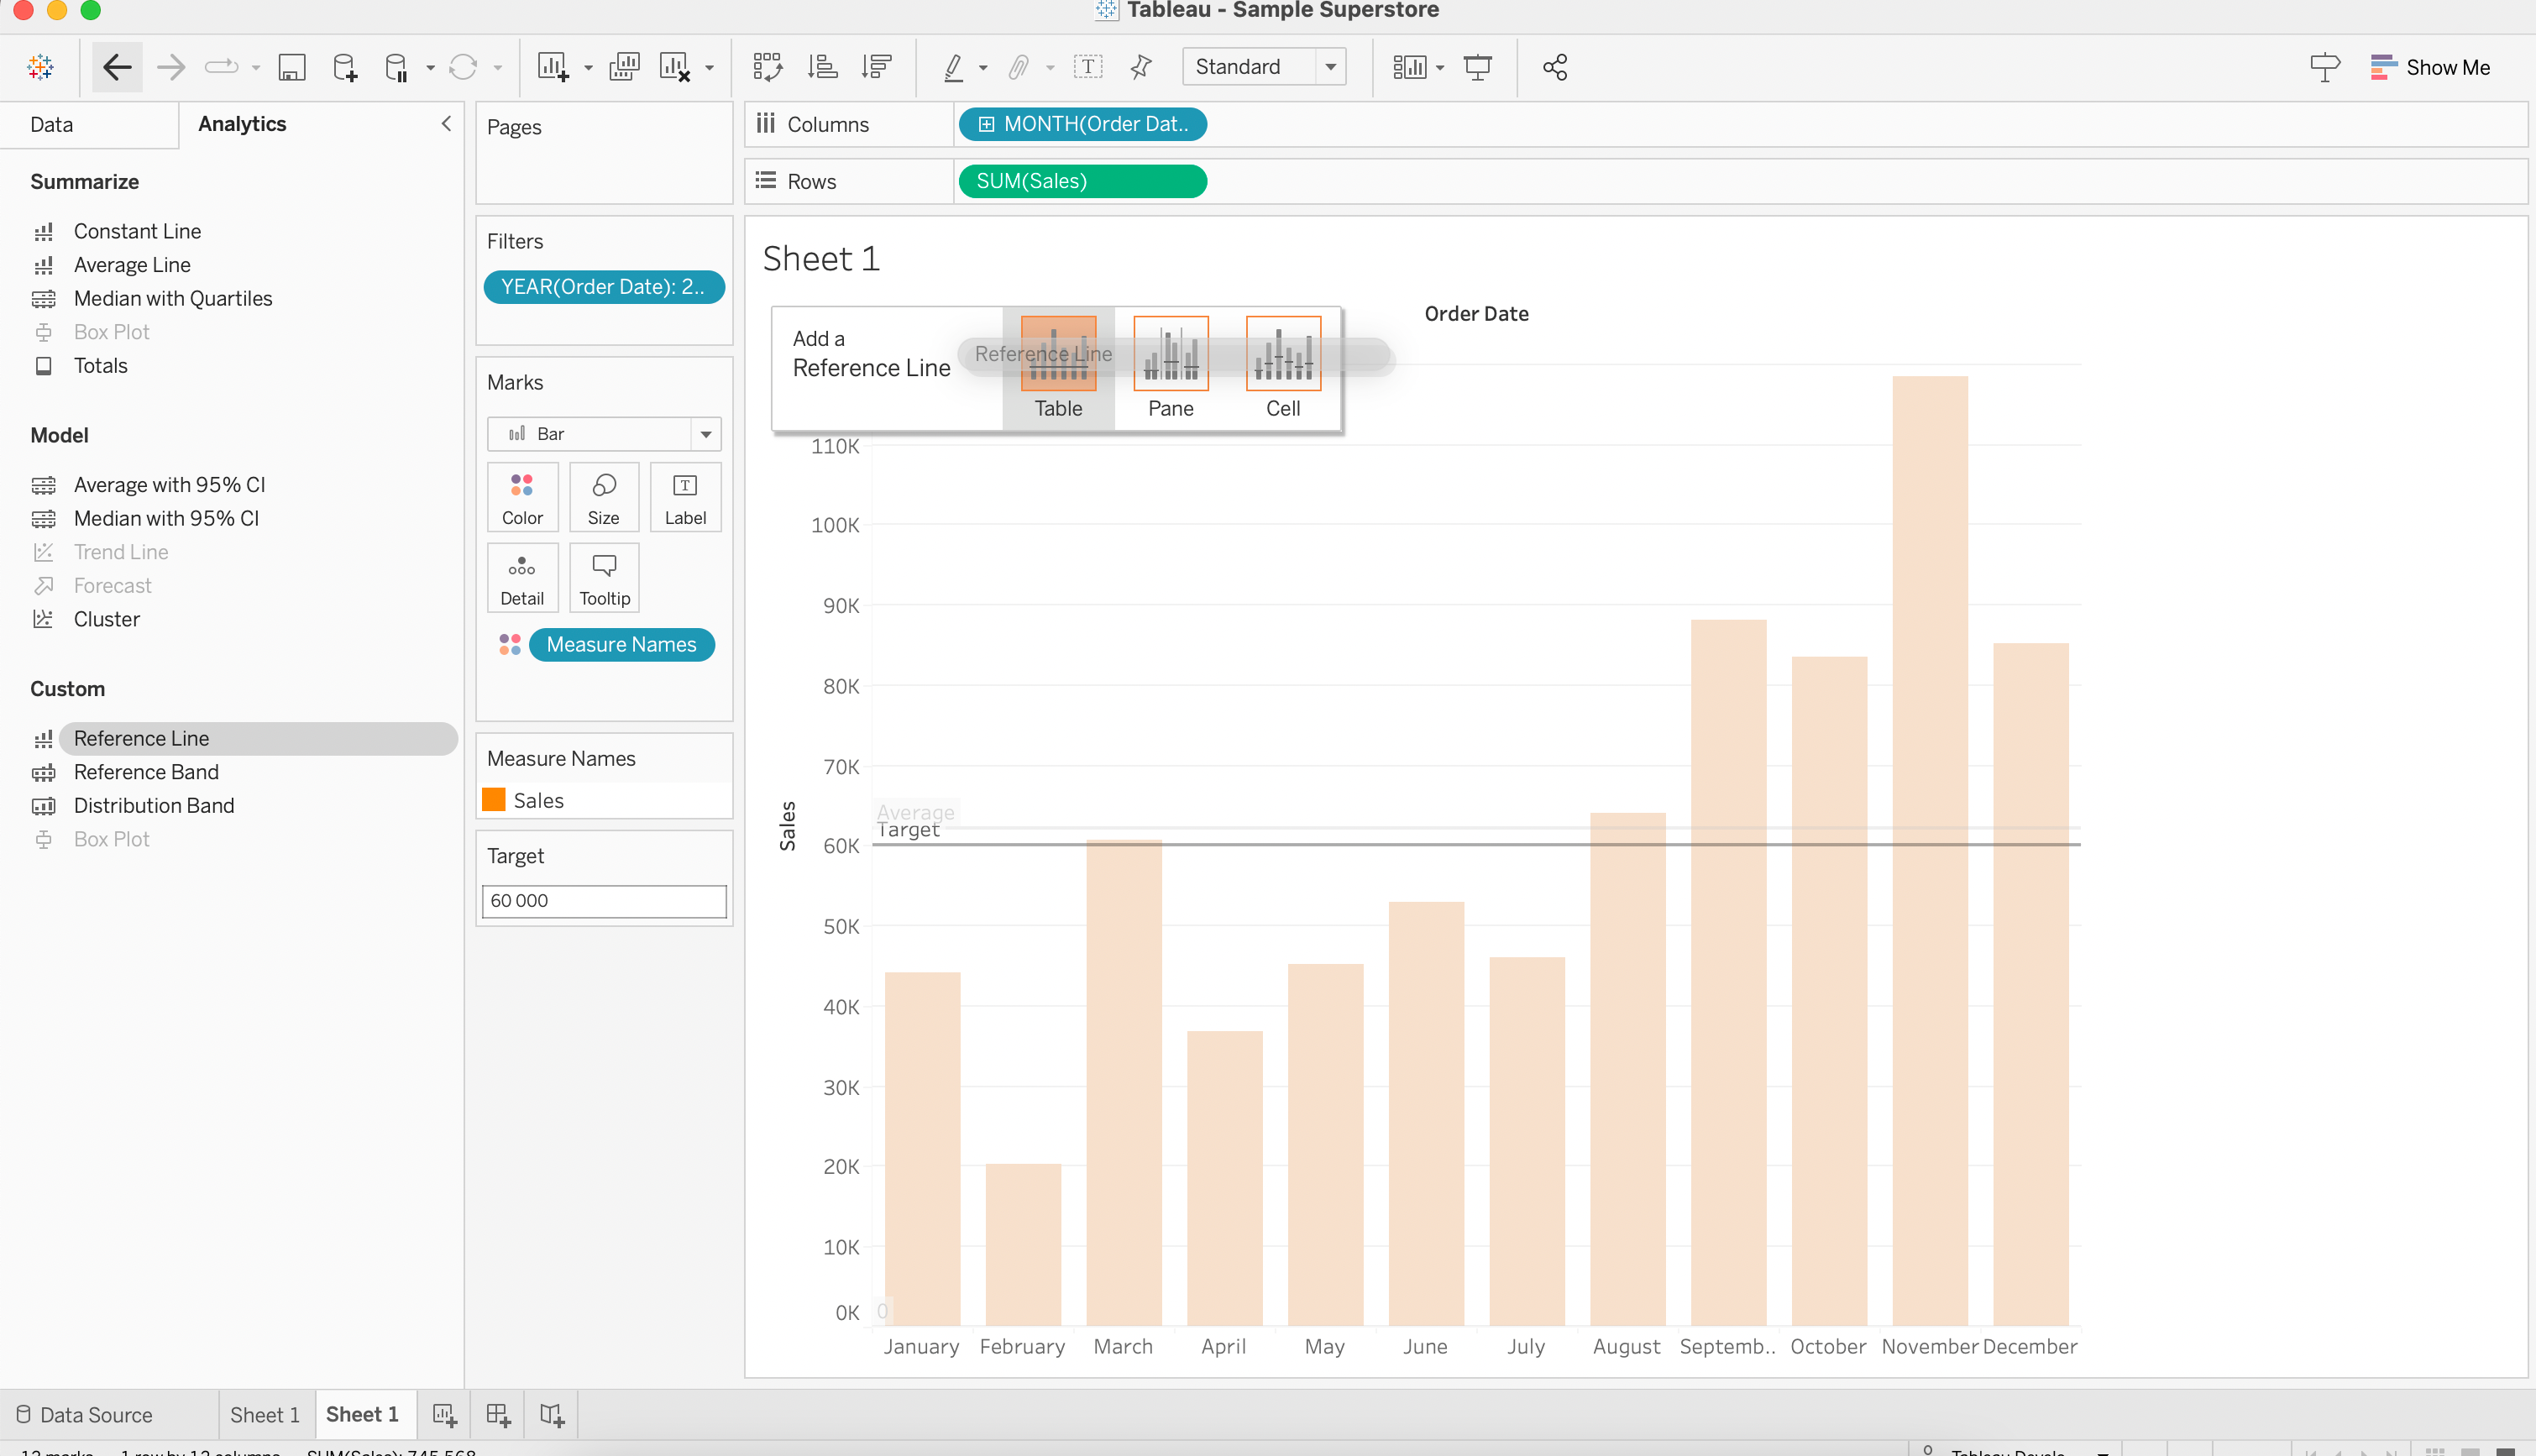
3) Customize options, such as value, label and tooltip.
Value should be connected with a parameter.
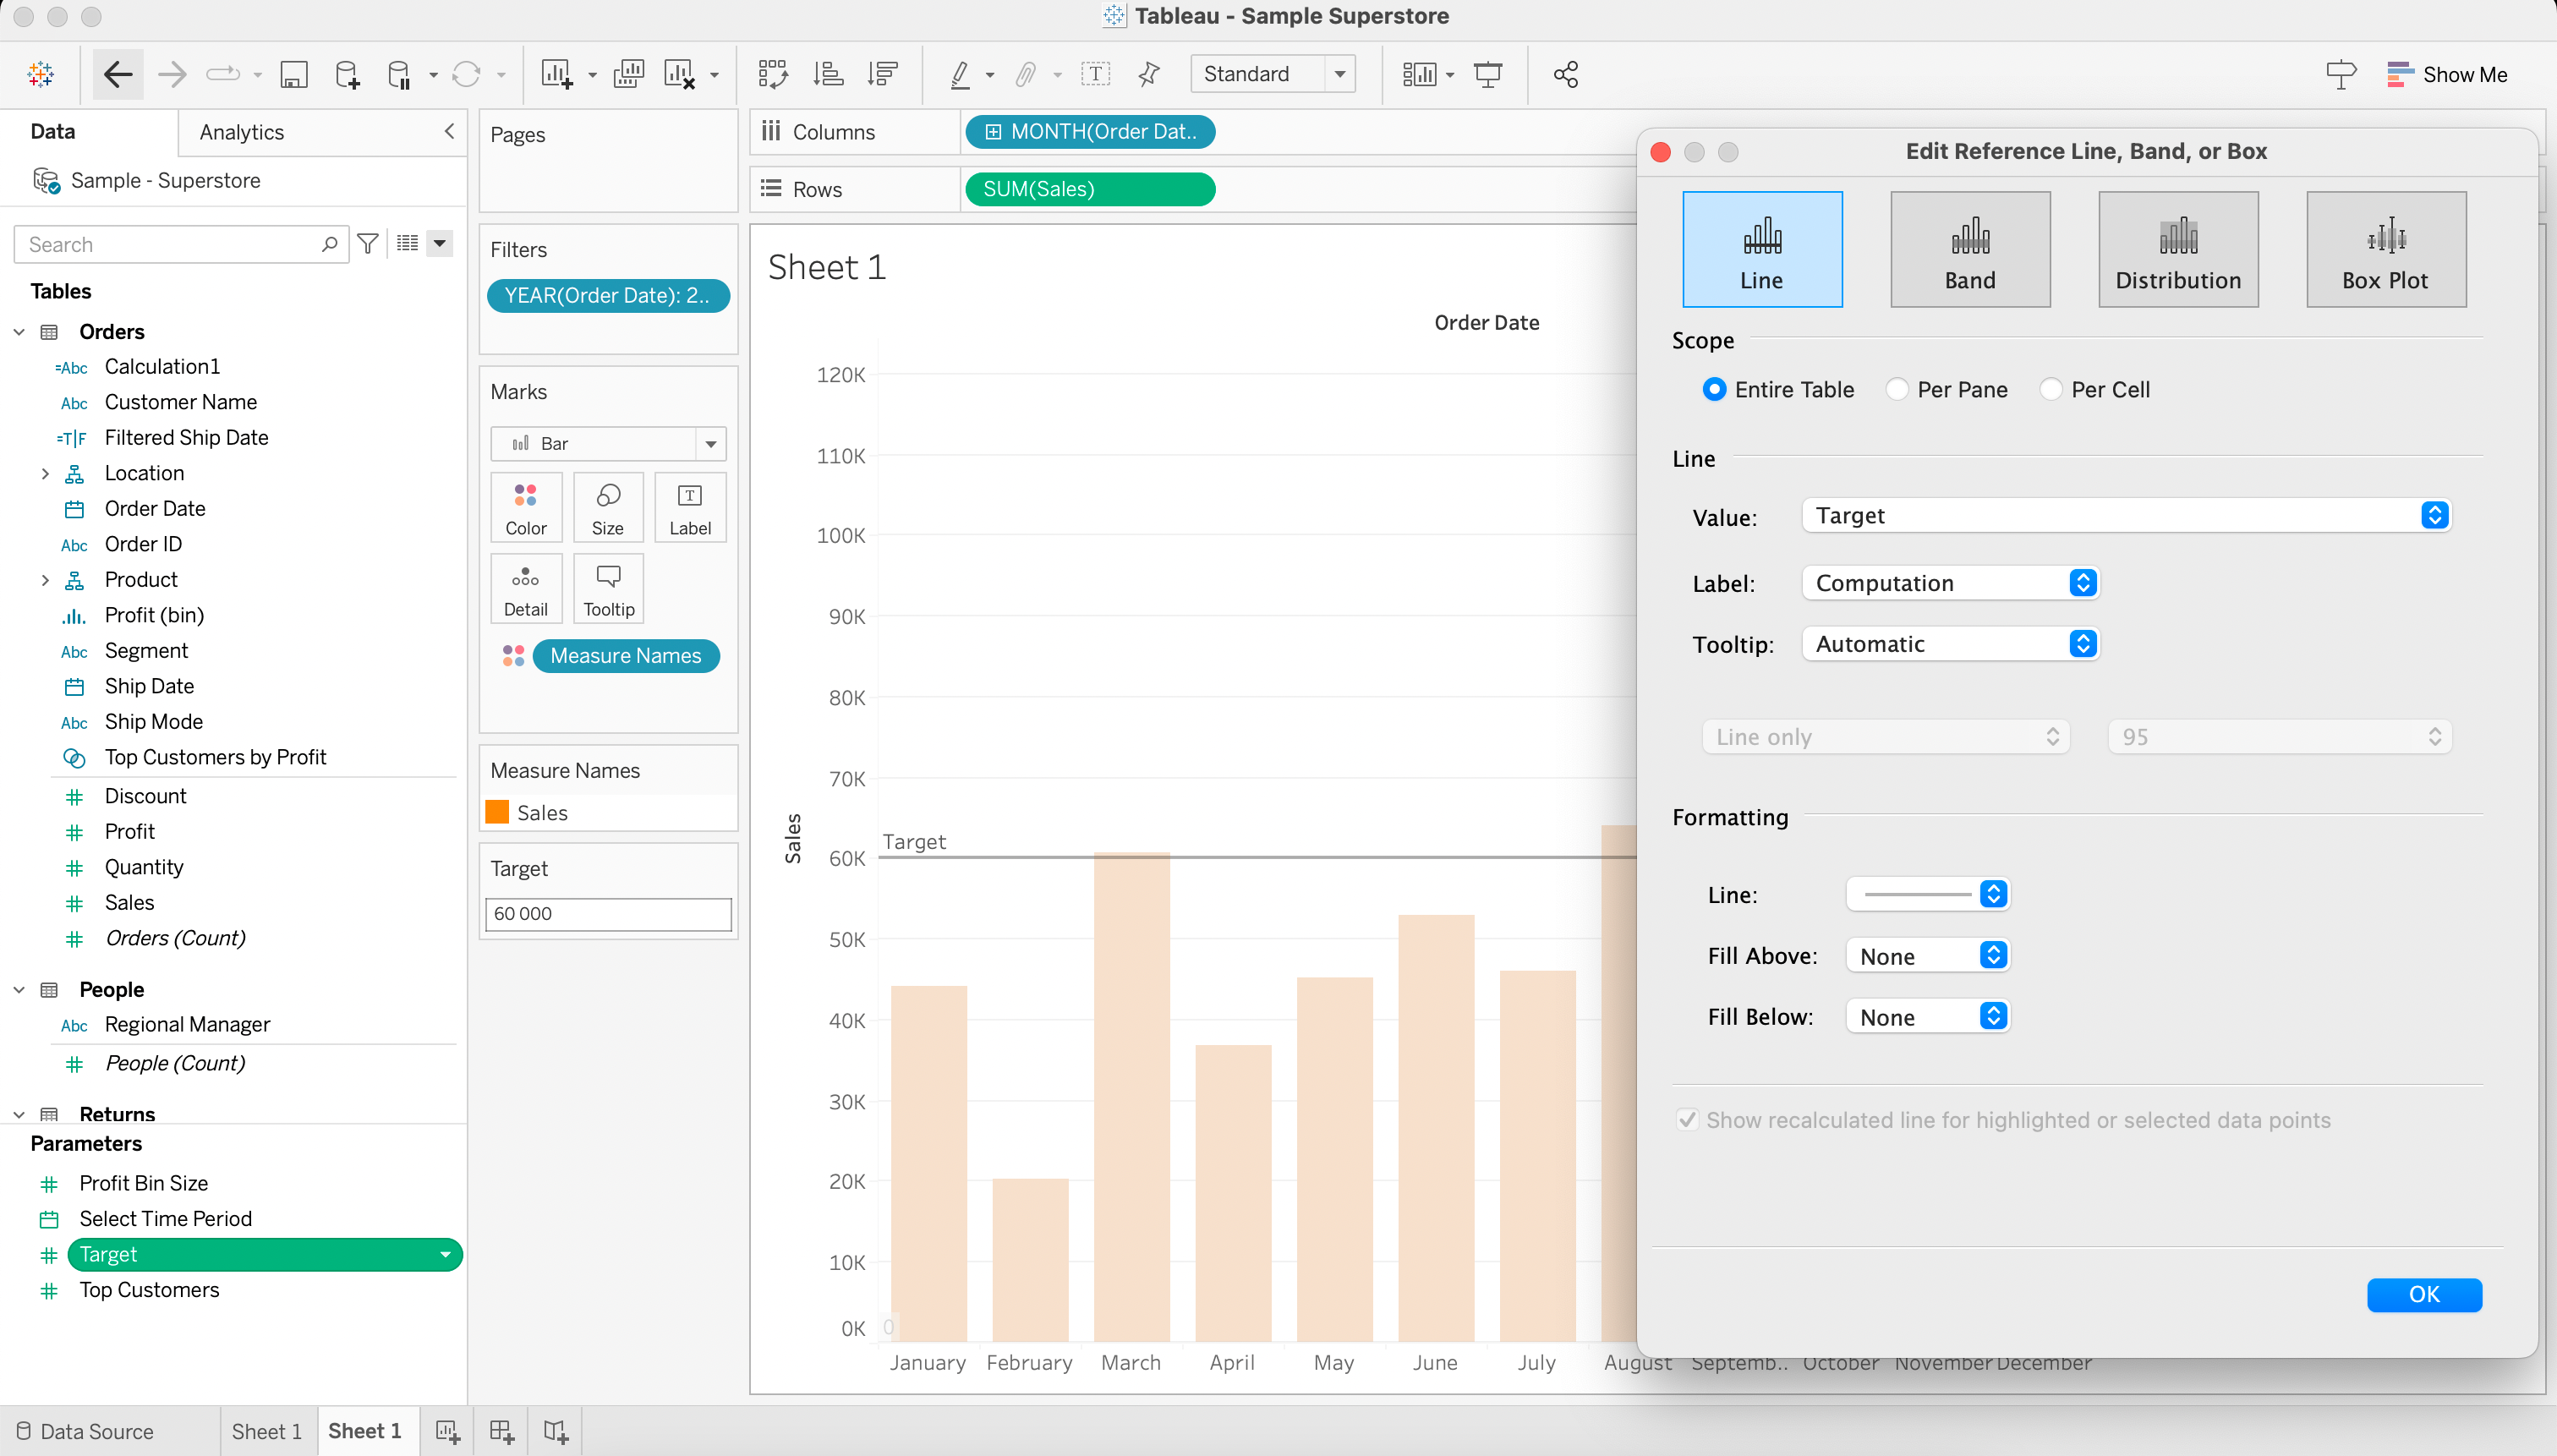
The reference line will now change based on the date the user selects, providing valuable context for the visualization.
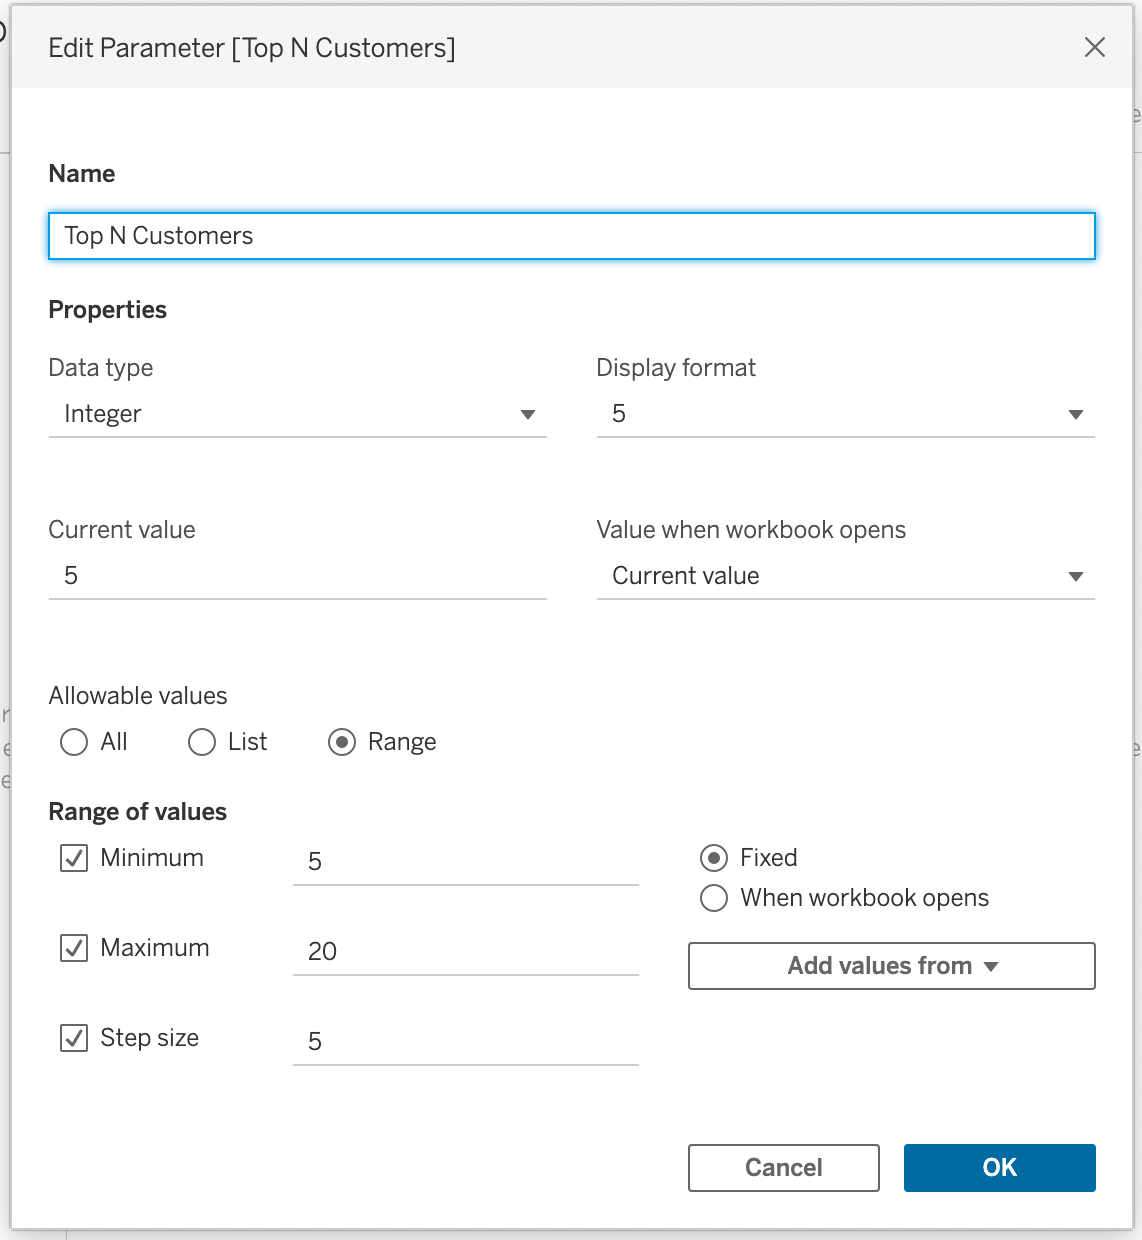
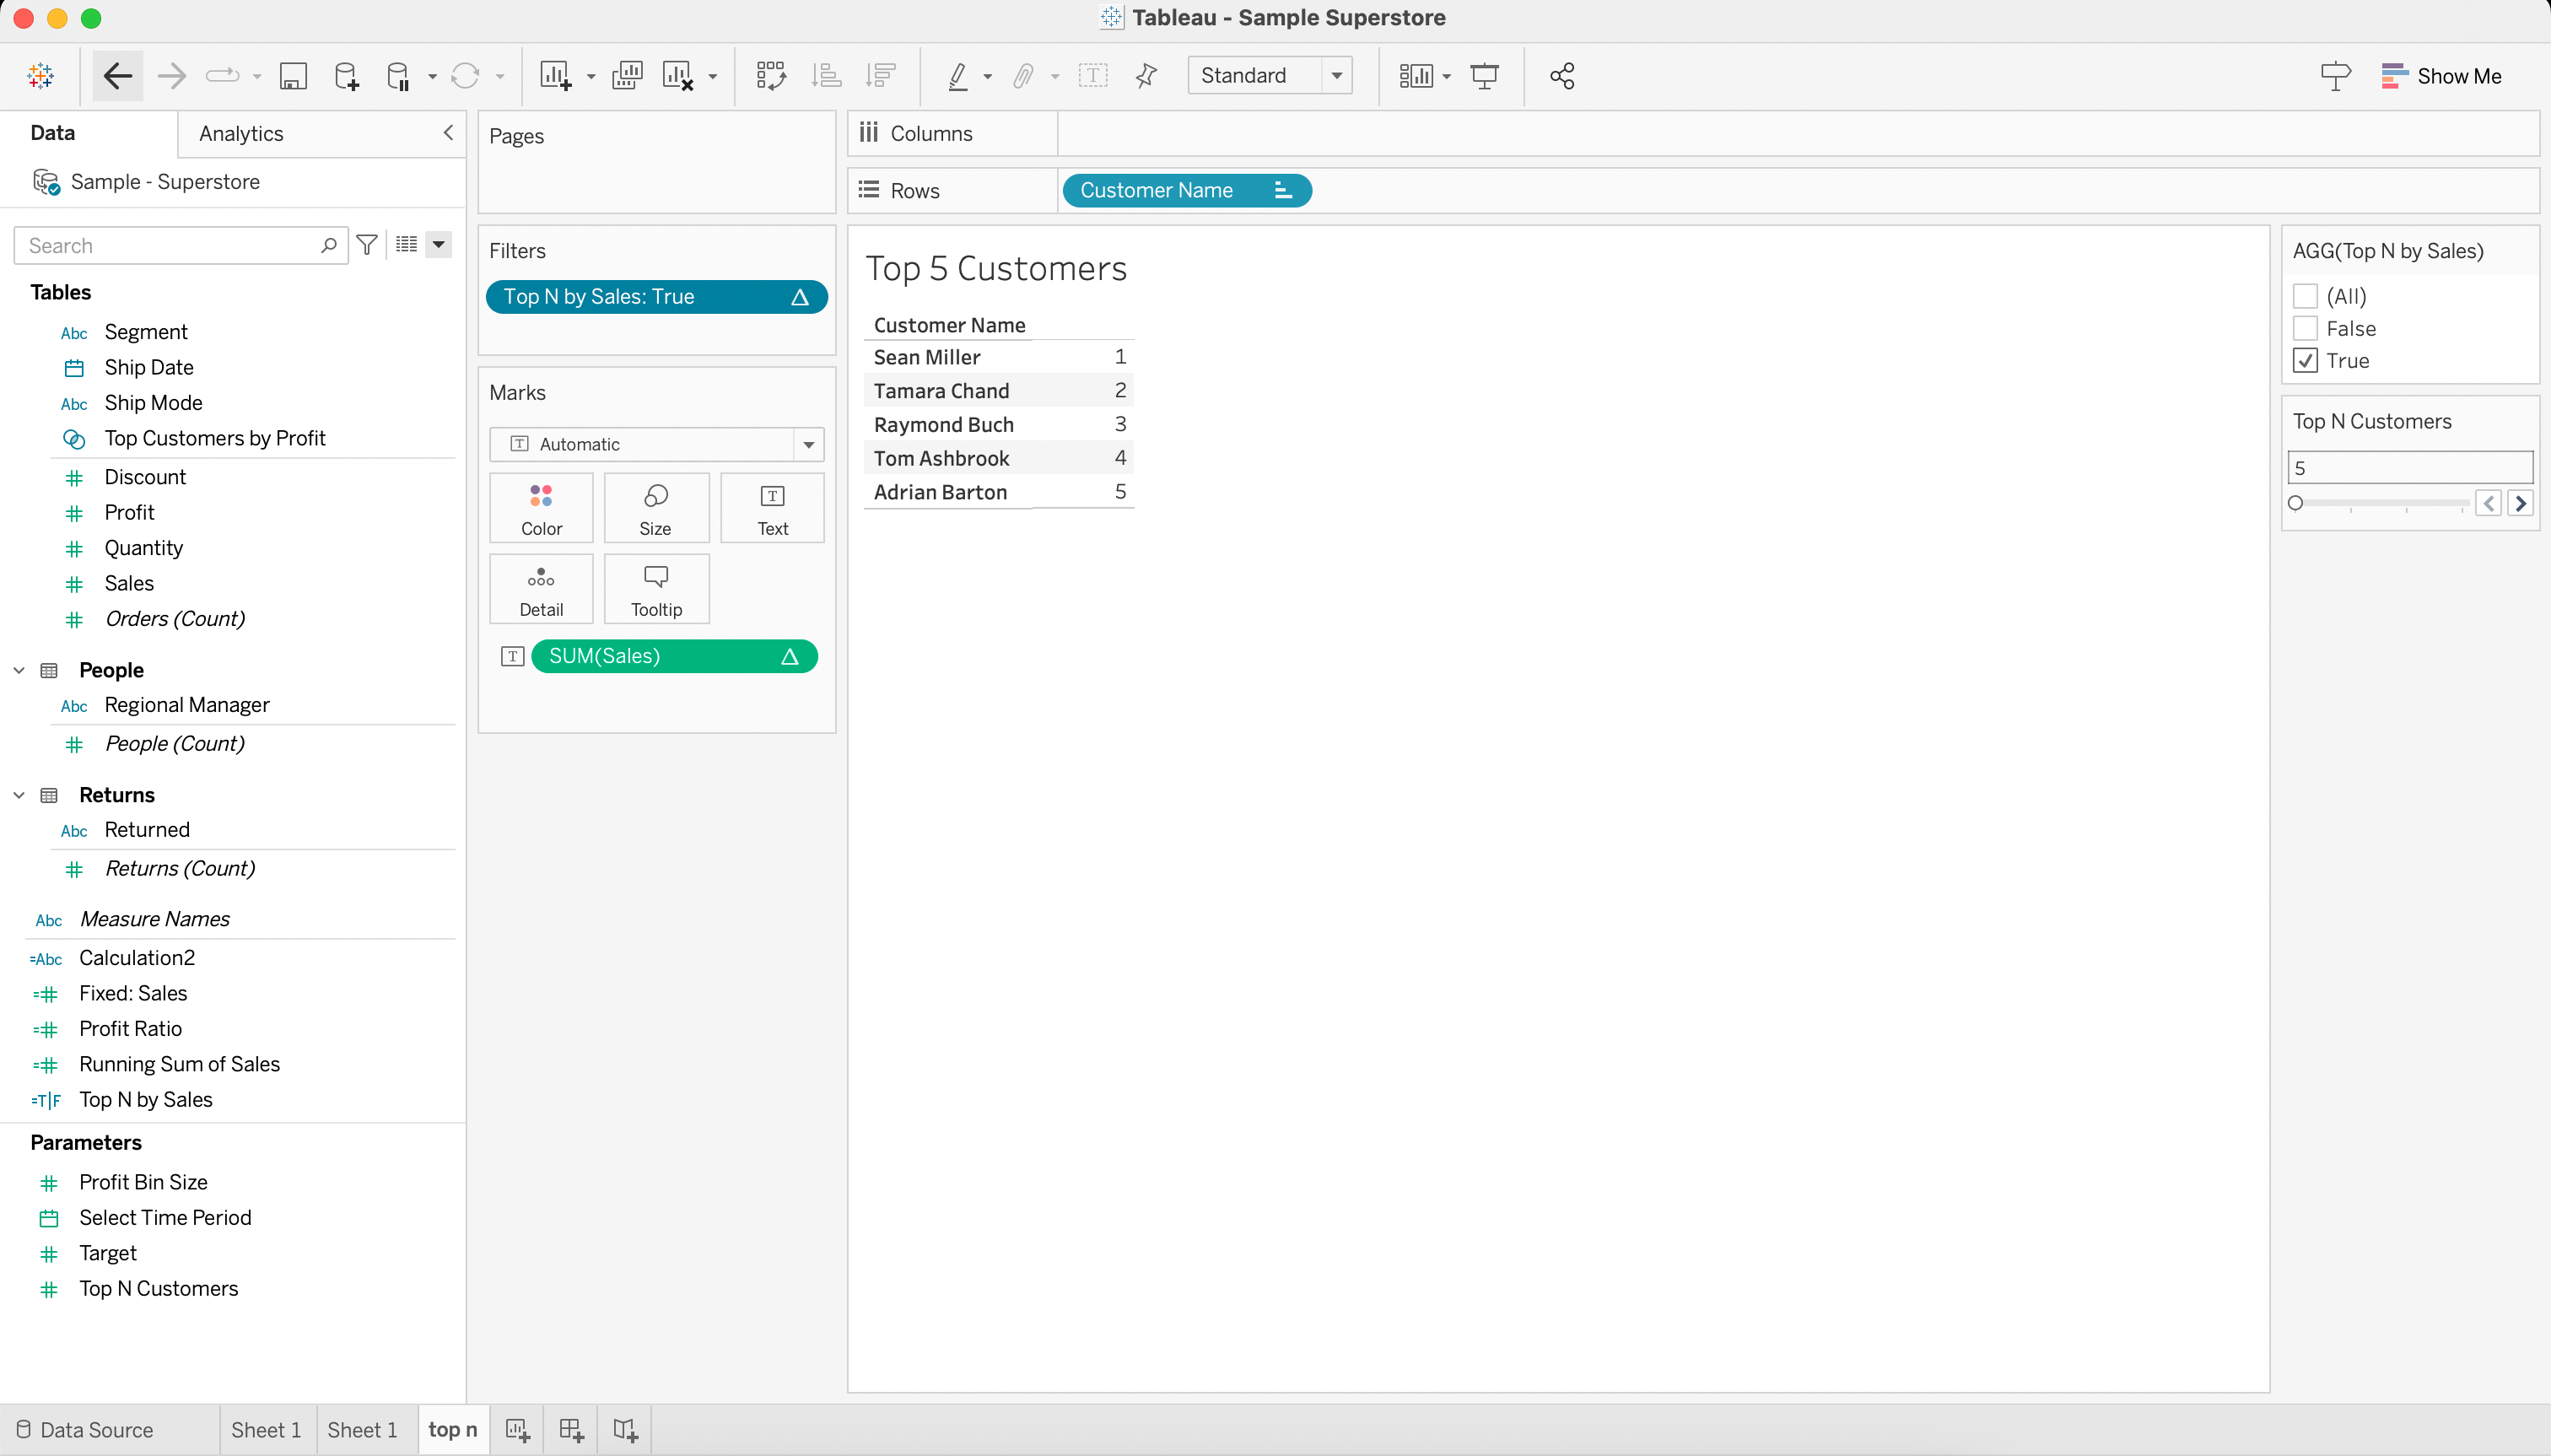
4) Top N Parameter
A Top N parameter allows you to control the number of top results displayed in a visualization.
This is particularly useful when dealing with large data sets where users might be interested in focusing on the top performers, products, or regions.
Here’s how to create a Top N parameter:
1) Create a new parameter and set its data type to Integer.
2) Set the allowable values as a range, specifying a minimum and maximum value.
3) Create a calculated field that ranks your data based on the desired measure and links the rank with the new parameter.
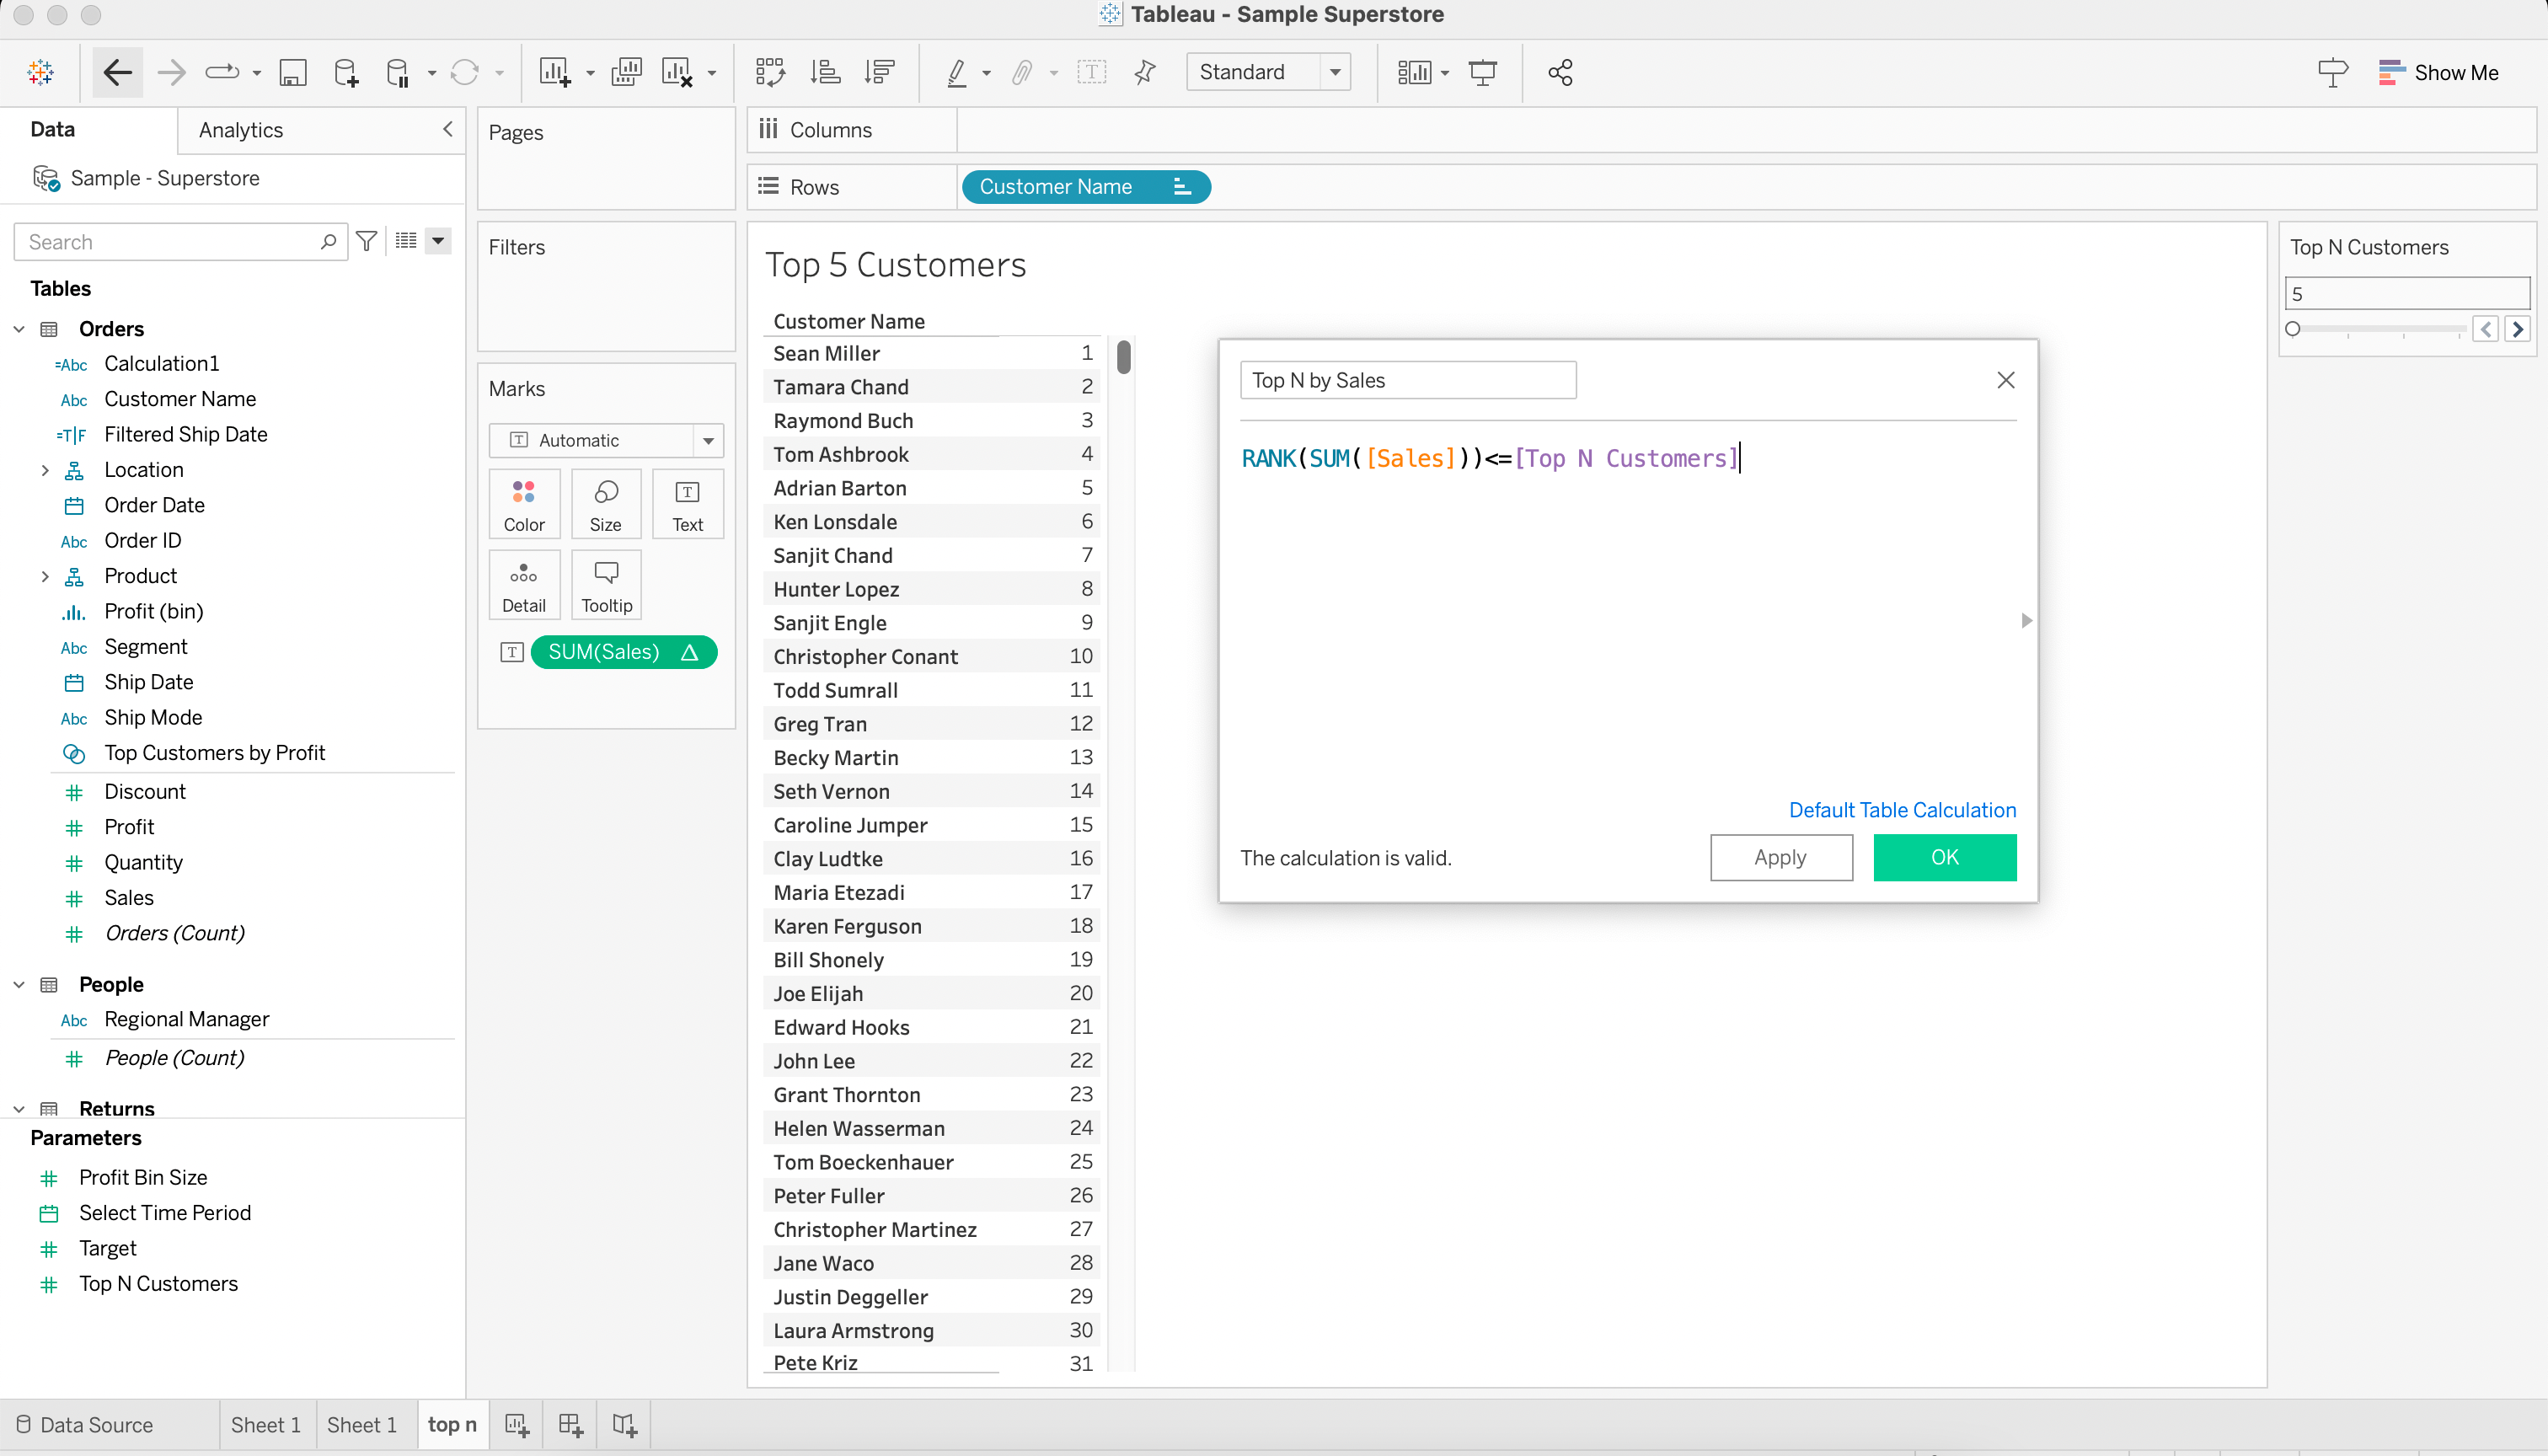
4) Use the calculated field in a filter to display only the top N results based on the parameter.
5) Swapping Measures and Dimensions
Parameters can be useful for changing the measures and dimensions displayed in a visualization, letting your audience view different aspects of the data.
For instance, assume you have a bar chart that shows the sum of sales per customer segment.
You can create a parameter to swap between displaying sales or profit:
1) Create a parameter called Select Measure with a data type of string and a list of allowable values, including “Sales” and “Profit”.
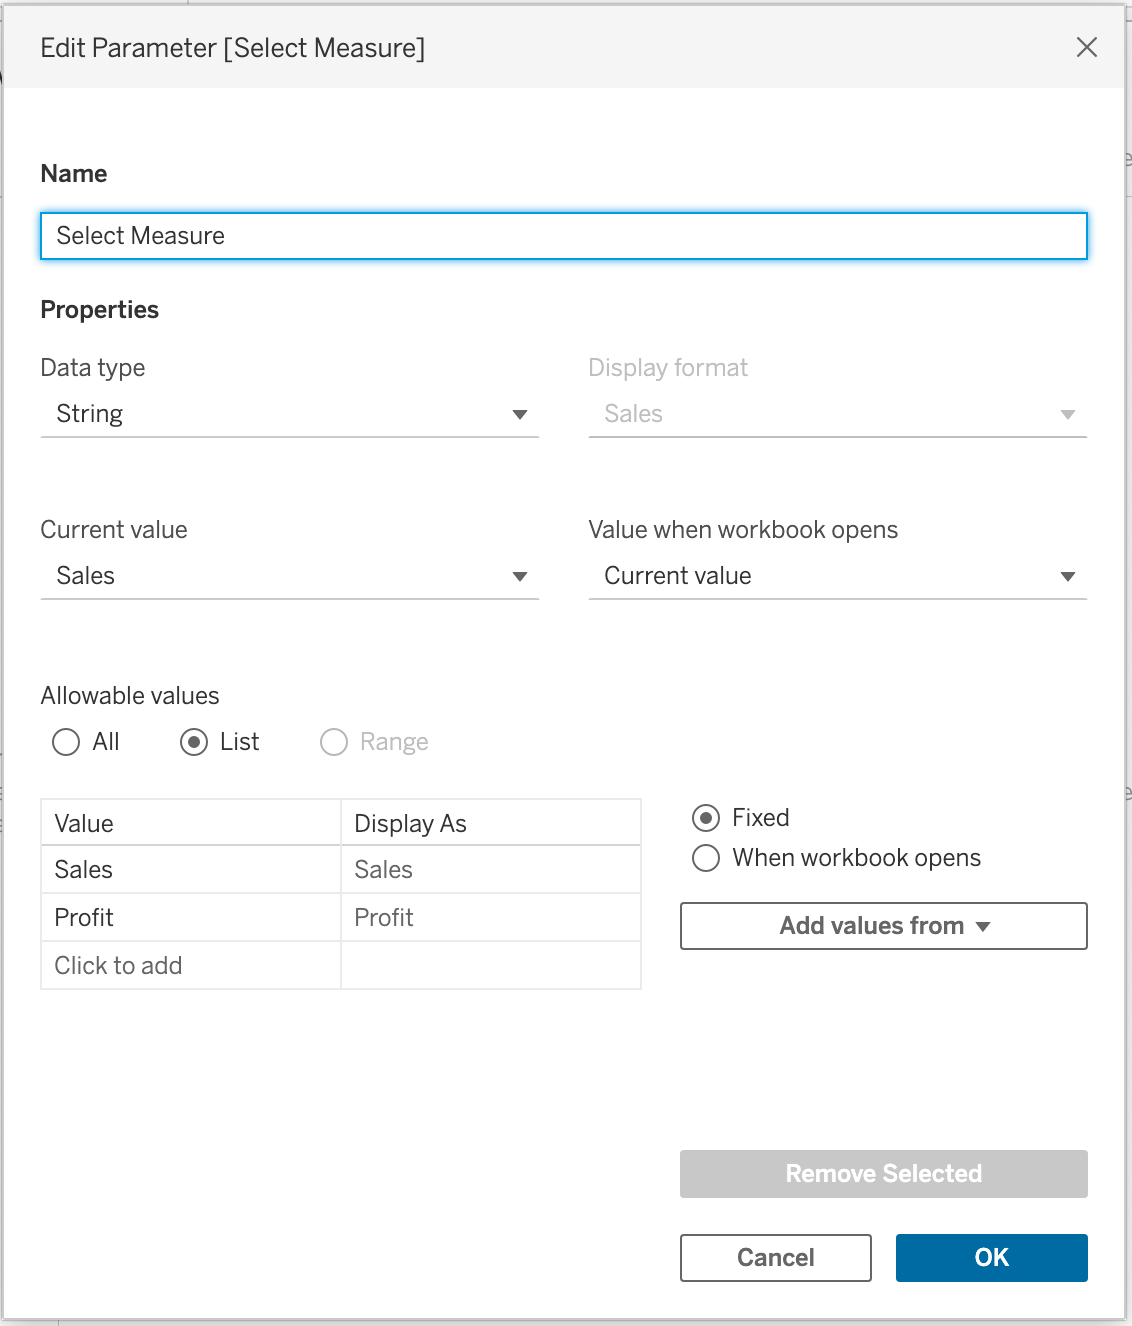
2) Create a calculated field with a formula like:
CASE [Select Measure] WHEN "Sales" THEN [Sales] WHEN "Profit" THEN [Profit] END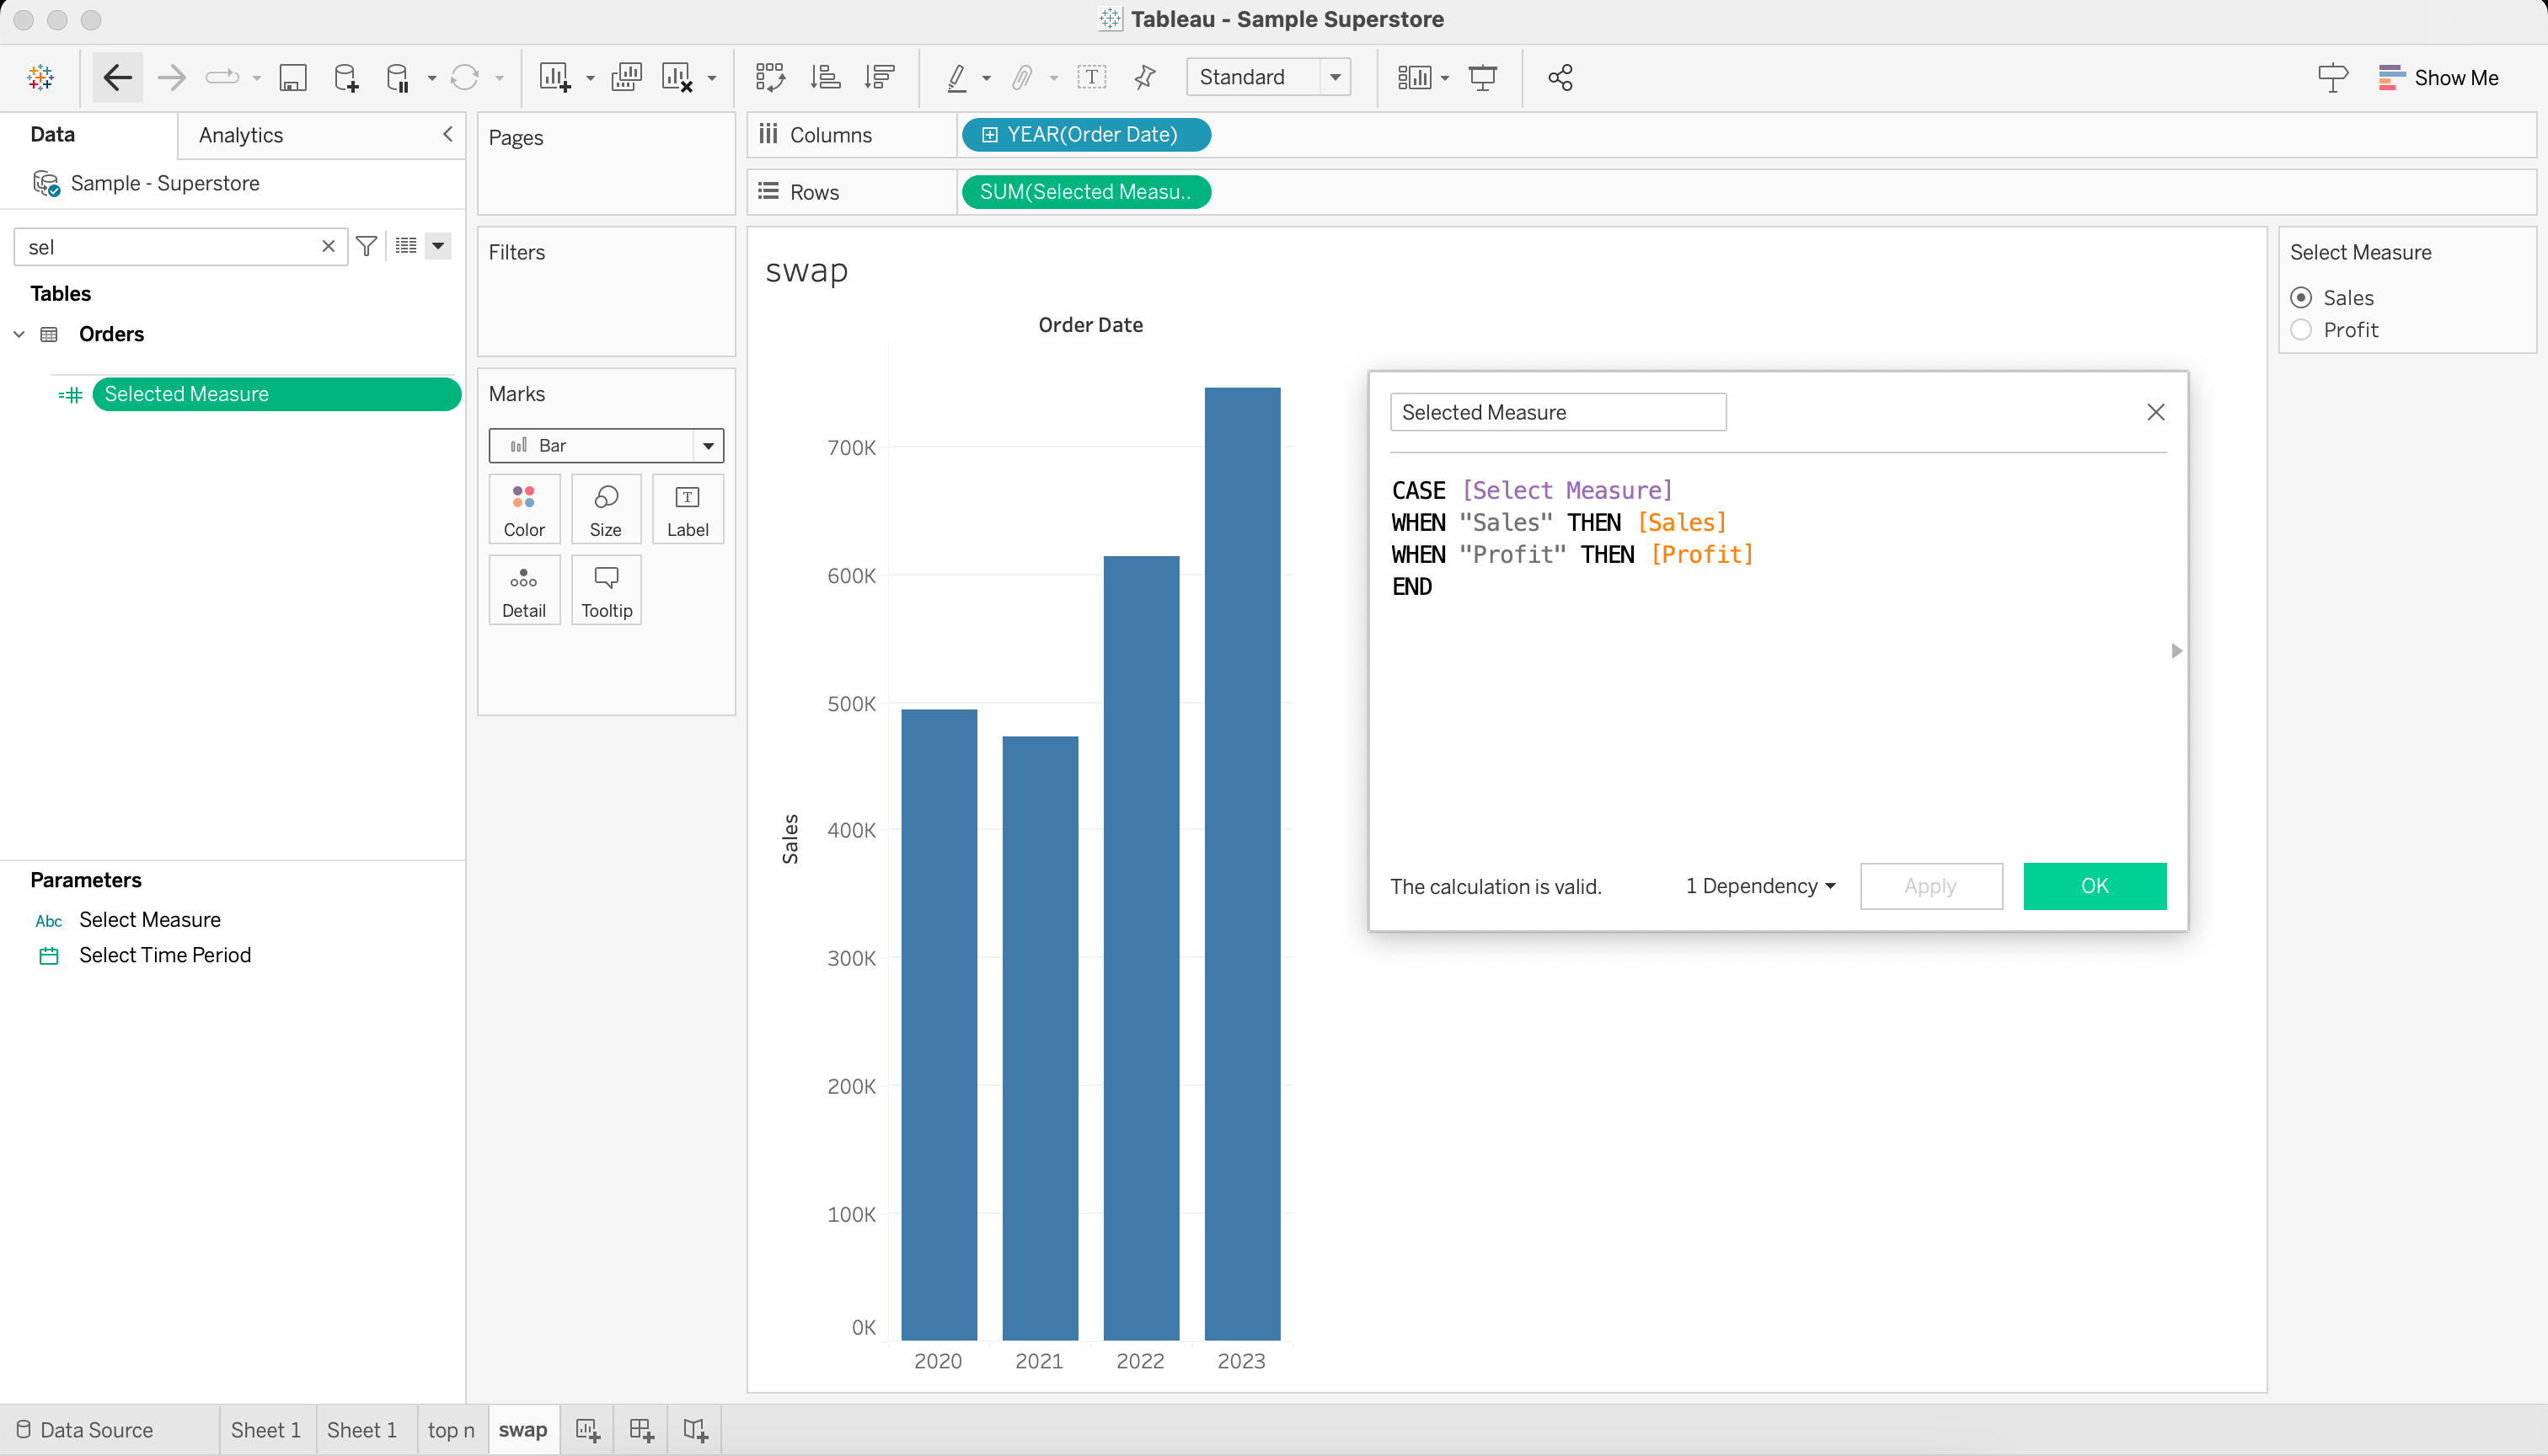
3) Replace the existing measure on your bar chart with the new calculated field.
4) Additionally, you can adjust the chart axis so it displays the value of selection.
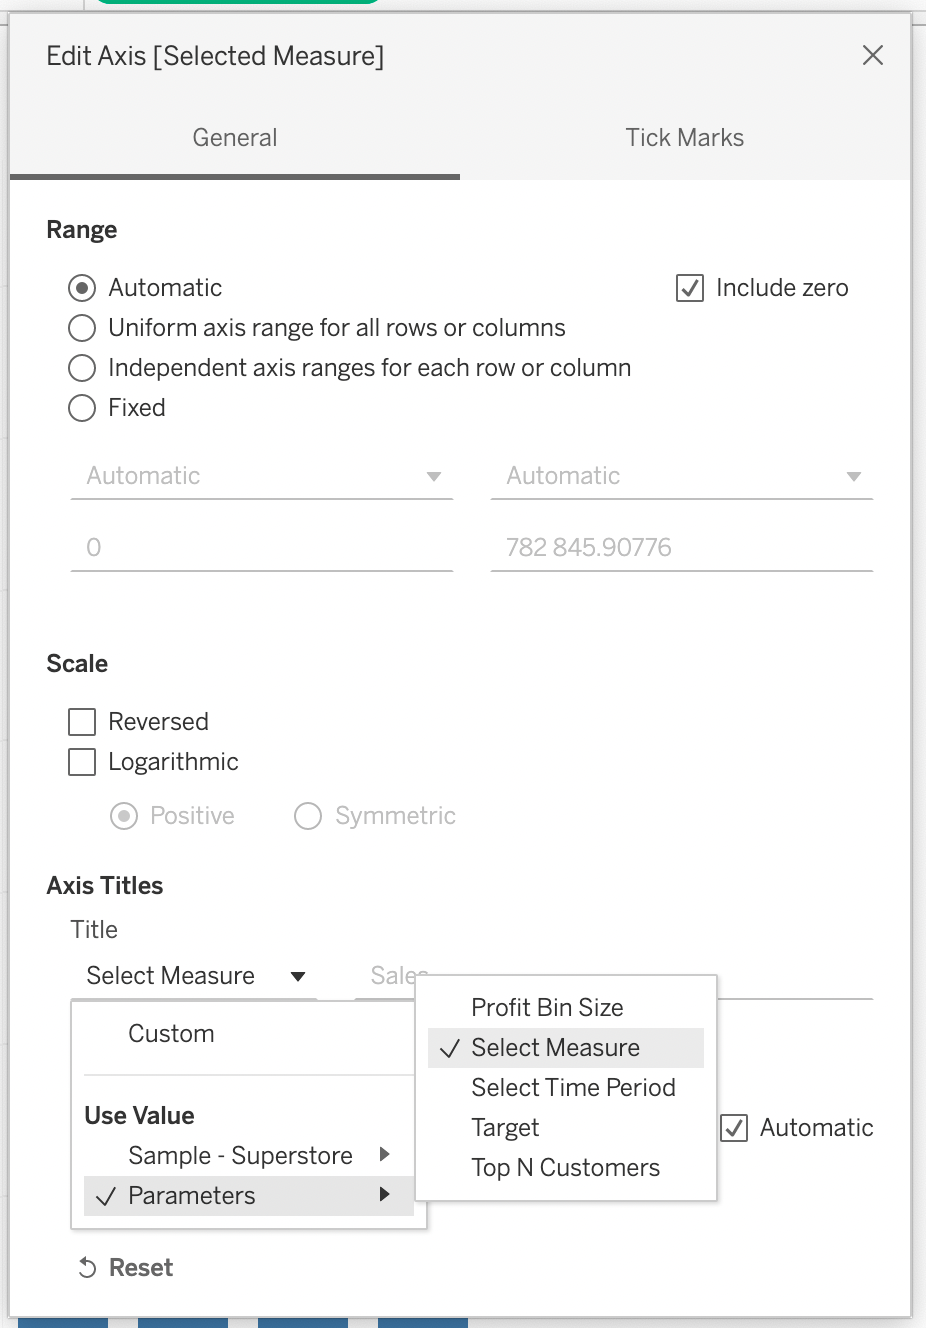
When users change the value of the parameter, the bar chart will display either sales or profit data accordingly.
6) Parameters Actions
In Tableau, a parameter action is a type of user interaction that allows users to modify the parameter’s value directly from a dashboard or worksheet.
When you create a parameter action, you define a source sheet or dashboard object (such as a button, drop-down, or text) and a target parameter.
When a user interacts with the source object, it triggers the parameter action, and the value of the target parameter is updated accordingly.
This, in turn, can dynamically change the data displayed in the visualization, update calculated fields, or adjust various aspects of the dashboard.
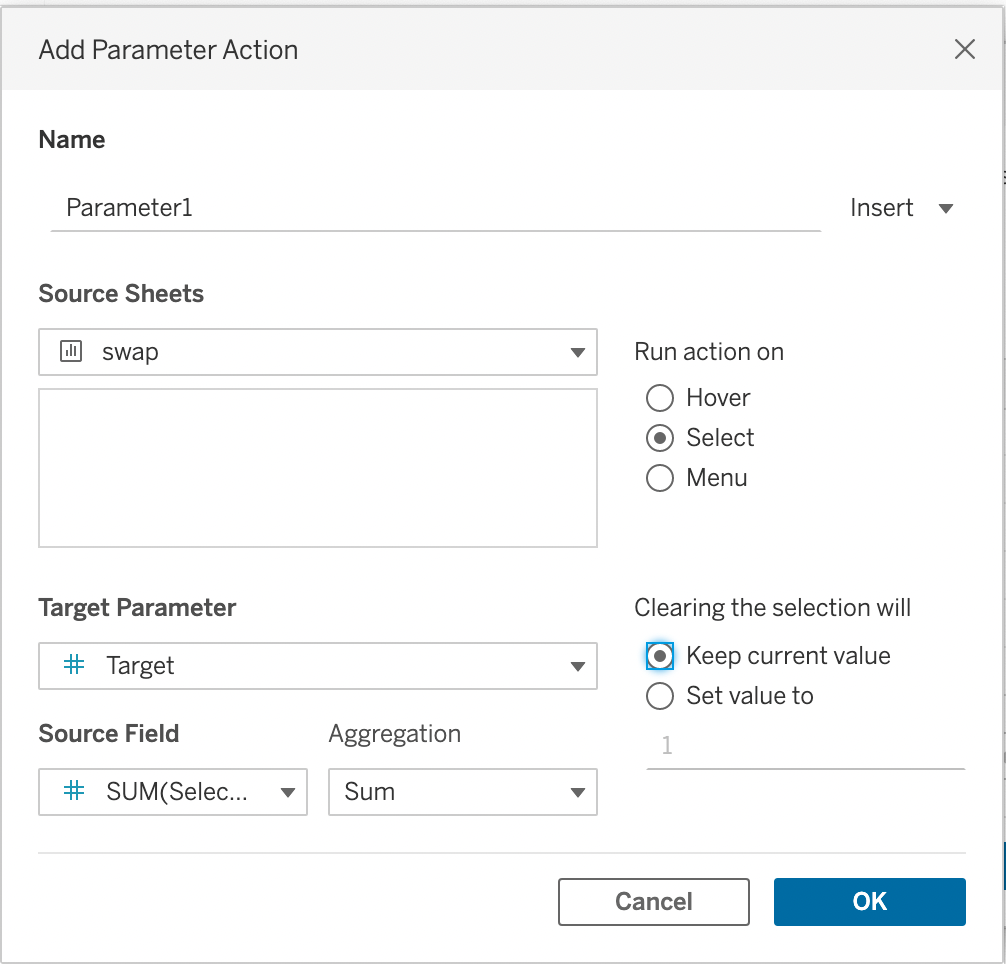
You can use parameter actions to achieve various functionalities, such as filtering data, highlighting specific data points, controlling color schemes, or toggling between different views.
They allow users to have more control over the analysis and exploration of data, providing a more immersive and interactive experience.
Learn how you can supercharge you data analytics journey with ChatGPT by watching the following video: https://youtu.be/at84yjhAmeA
Final Thoughts
Mastering the use of parameters in Tableau is a powerful skill to learn. Parameters lend your data analysis a heightened level of interactivity and customization.
By using them, you’re not only empowering yourself to dive deeper into your data, but you’re also enhancing the viewer’s experience, facilitating a more dynamic, tailored understanding of the insights at hand.
Parameters allow you to pivot and explore different scenarios, leading to more informed decisions. It’s an excellent tool to help you tell data stories more effectively.
Frequently Asked Questions
In this section, you’ll find some frequently asked questions you may have when working with parameters in Tableau.

What is the difference between sets and parameters?
The main difference between Tableau sets and parameters lies in their functionality and purpose.
Tableau Sets: A set is a custom field that defines a subset of data based on specific conditions or criteria. It allows you to group data points that meet the set conditions, creating a separate data subset.
Sets are dynamic and change with the data, but they are limited to discrete fields and can be used for filtering, grouping, and comparing data subsets.
Tableau Parameters: A parameter is a user-defined value that can replace a constant in calculations, filters, or reference lines. Parameters provide interactivity by allowing users to control certain aspects of the visualization.
They are versatile and can be used with both dimensions and measures, providing a way to adjust settings like thresholds, ranges, or filters dynamically.
How can I use multiple values with parameters?
Tableau parameters are designed to store a single value at a time, meaning they can hold only one value at any given moment.
However, you can predefine a list or range of possible values that the parameter can take. This allows you to restrict the available options to a specific set of values, giving users the flexibility to choose from those predefined options.
Setting up the parameter with a list of allowable values ensures that users can only select values within that predefined range, providing a controlled and interactive experience while working with your Tableau visualizations.
How can I configure a parameter range?
Select “Range” from the “Allowable values” options in the Create Parameter dialog box when creating a parameter.
Specify the minimum and maximum values of the range, as well as an optional step size.
This will let users select a value within the specified range, providing more precise control over the parameter’s influence on your visualizations.