
Power BI What-If parameters are a really powerful feature to implement in your models for scenario analysis. You may watch the full video of this tutorial at the bottom of this blog.
Scenario analysis is immensely important from an analytical perspective in Power BI and ‘What-If’ parameters allow you to quickly implement tables and measures for this type of analytics.
Once you select the What-If parameter icon, it opens a popup box up where you can input some variables that will go into making a table.

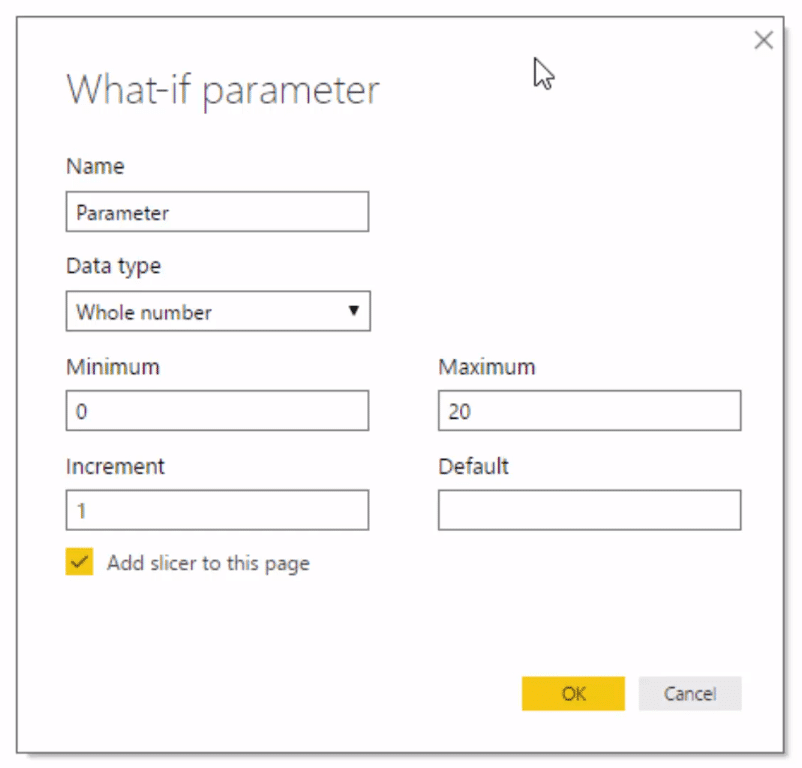
This table will have every iteration or every shock value that you can then lay out on top of your calculations to run these scenarios.
It speeds things up for this type of work. The What-if parameter doesn’t change the way that you actually implement scenario analysis at all, in regards to the DAX formulas etc.
It simply enables you to quickly implement it much faster than it took to set up in the past.
What you’ll find as you get more into scenario analysis is that you can implement multiple parameters.
You might have one What-If parameter, which is focused on demand scenarios, and you might have a pricing parameter, a supplier or costing parameter.
It really just takes away the manual work to set it up or showcase. Now, it’s super easy, and I’m going to show you how it’s done.
Creating A ‘What-If’ Parameter
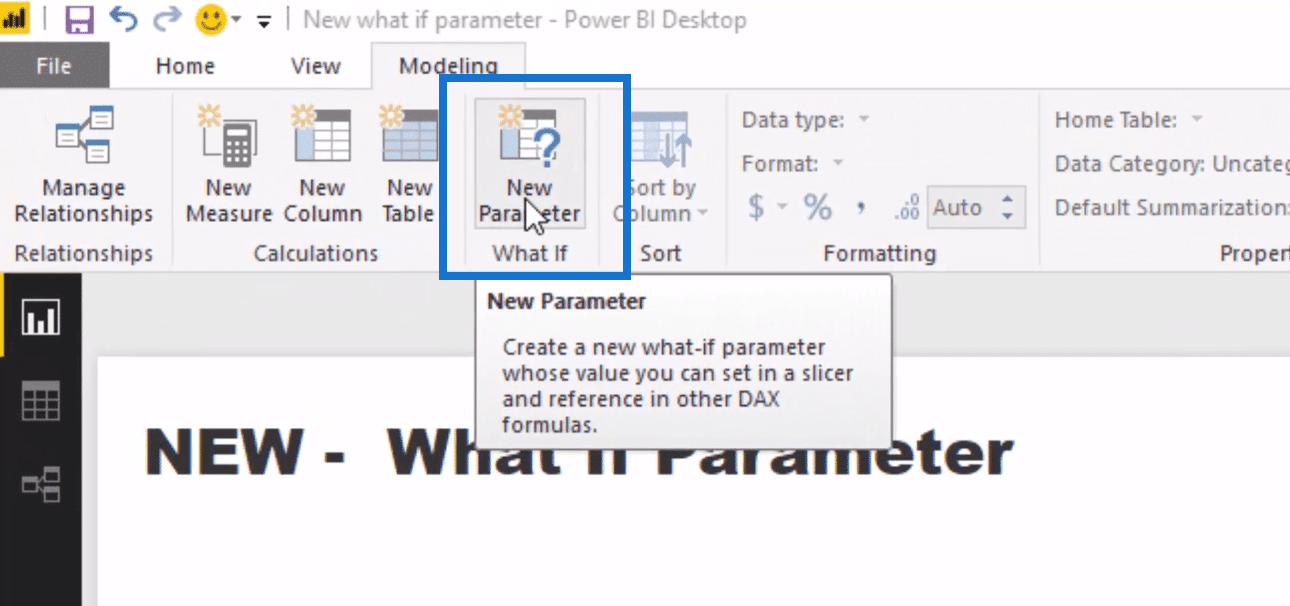
In the modeling ribbon, we’ll see the What-If icon. We click on the New Parameter to create the What If scenarios.

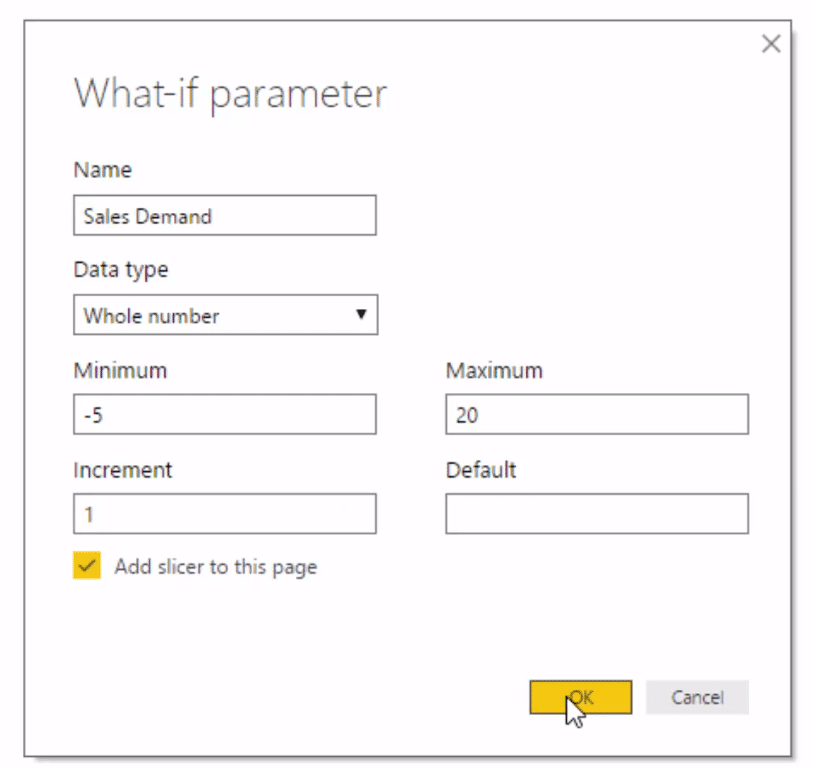
In this example, we will have the scenario of the change in Sales Demand. We can actually choose the Data Type as whole number, decimal number, or fixed decimal number.
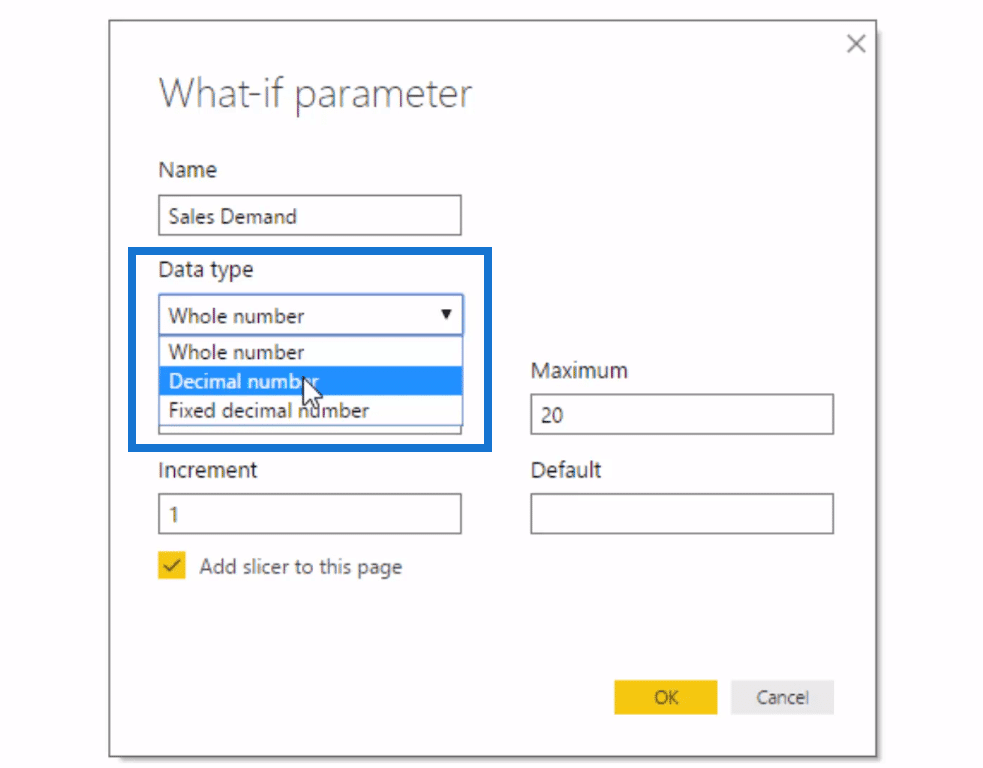
For this Sales Demand scenario, we choose the whole number as the Data type, and we will turn that into a percentage later.
Then, we input the minimum and maximum values. We also have the option for the minimum value as plus and minus, which is great.
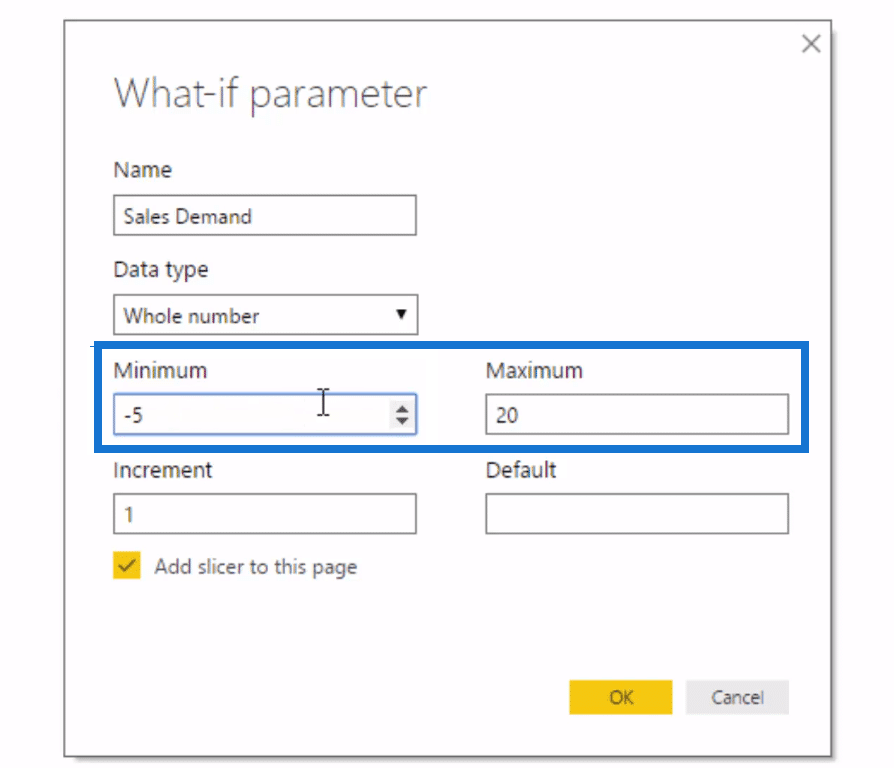
So, here we set the values at -5 to 20%. We set the increment as 1, and then click OK.
Here’s what it does. It creates a slicer, which you can move up and down. And it also creates these tables on the right side here. It actually physically created a table.
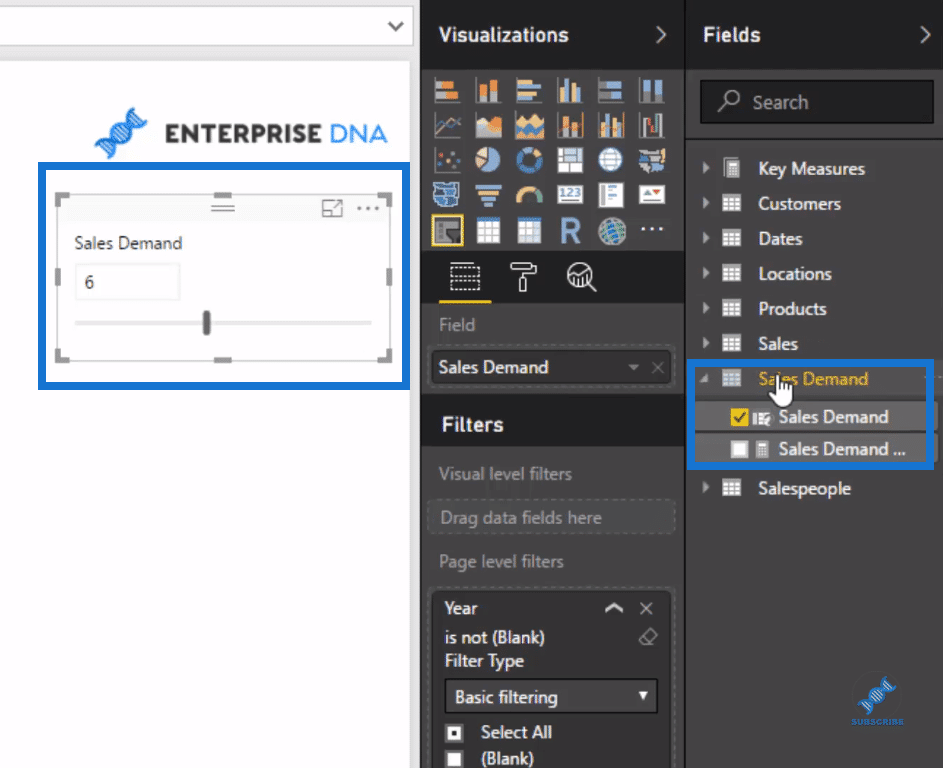
If we go and look at our model, we can see Sales Demand. Before, I have to create this manually. But now, it’s just great that they have it automated.

In this Sales Demand table, we see over here that we got -5 to 20%. Again, we didn’t have to manually create that table.
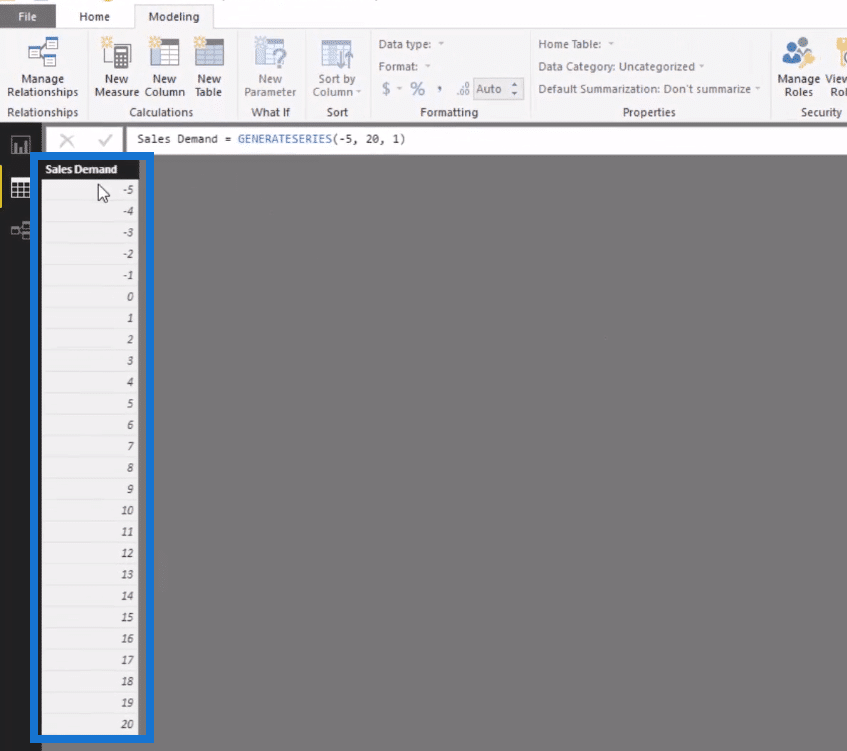
It utilizes a DAX formula called GENERATESERIES. Think of how you could use this yourself for any table you need.

It also created a measure here, the Sales Demand Value. It’s just awesome how we don’t need to do it manually anymore.

Since this is already in a measure, we can just integrate it into our calculations.
Integrating ‘What-If’ Parameter Into Calculations
For instance, we look at total sales by the month and year, we simply drag from the key measure Total Sales. Then, drag Month and Year from the Dates table into the axis.
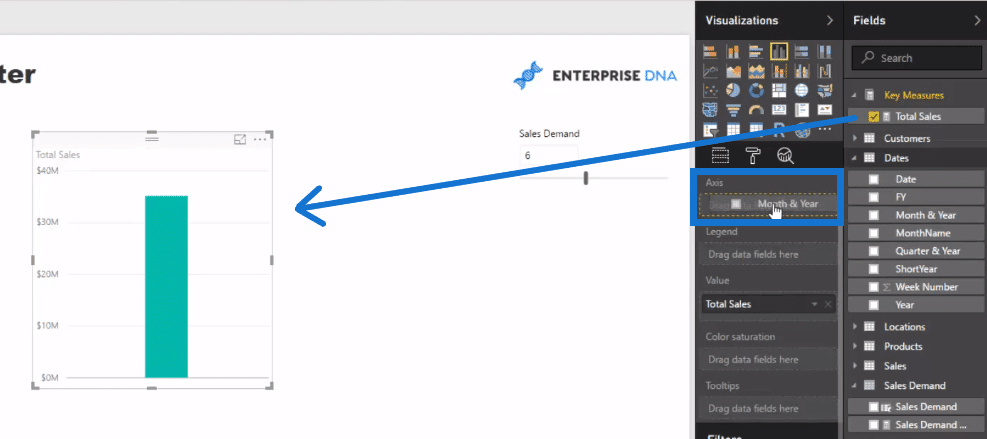
Let’s drill into a specific time frame say, 2017 and draw the table out. Then, we can create a new measure, integrating the Sales Demand Value.
To do this, we click on New Measure, and let’s call the measure Scenario Sales. We type in equal to Total Sales multiplied by 1 plus the Sales Demand Value. Close it off and go OK.

Drag this Scenario Sales key measure in, and we’ll see that we have a value here.
We could also get this into a percent.

There’s a number of ways you can do this and one is to make the adjustment inside the measure itself.
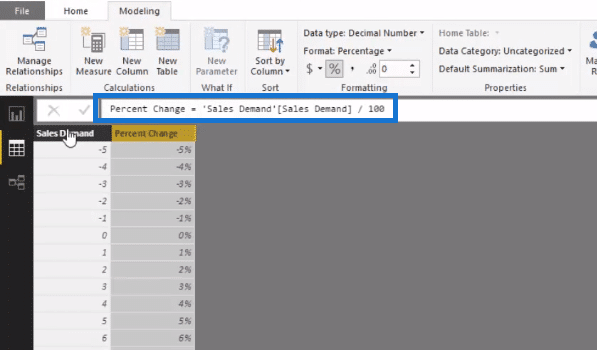
Since our Sales Demand Value is a whole number, instead of turning it into a decimal, we divide it by 100.

We have full flexibility in this table, which allows us to also make the adjustment here. Just click New Column and type in Percent Change.
Now we got the slicer, which we could move up and down. We also have the ability to turn it into a drop down or a list.

Conclusion
This feature in Power BI has definitely taken away the manual work of all of the things that I’ve showcased in the past around what you could do with scenario analysis or whatever analysis.
Now you could create quickly and easily that multi-layer analysis.
This allows you to create the sequencing of What-If scenarios, which is what really creates the true value. You’re doing almost predictive analysis and see what outcomes will involve if those scenarios happen.
All of these parameters can be layered into your scenario analysis, and that is when you can create some truly quite powerful analytical work inside of Power BI.
If you want to dive into scenario analysis, check out my course at Enterprise DNA Online called Scenario Analysis Deep Dive.
This is where I run into a number of different techniques around all of the things that you need to think about analytically and theoretically when implementing really great scenario analysis on top of your own data.
Sam
[youtube https://www.youtube.com/watch?v=7IEYHMvqZHY?rel=0&w=784&h=441]
***** Related Links *****
How To Start Using ‘What If’ Parameters Inside Power BI
Multiple ‘What If’ Parameter Handling In Power BI
Scenario Analysis Techniques Using Multiple ‘What If’ Parameters – Advanced DAX
***** Related Course Modules *****
Best Practices & Feature Reviews
Scenario Analysis Deep Dive
Advanced Data Transformations & Modeling
***** Related Support Forum Posts *****
What If? Parameter Without Min-Max Value
Scenario Analysis on Specific Attributes – What If Parameters Setup, Power BI
Advanced Scenario Analysis Techniques for Power BI w/DAX
For more what if parameter support queries to review see here….


