Data is an incredible tool, especially when presented in a way that’s easy to understand. The Content Data team at OpenAI has curated a top 10 must-see datasets you must explore.
Every industry is a goldmine of data waiting to be tapped. Whether you’re a seasoned data scientist or just curious about the world, there’s a dataset out there that can help you answer your questions.
An interesting dataset contains a large amount of information and provides insights into a particular topic. This could be anything from consumer behavior to climate patterns.

The most interesting data to analyze is often the data that has the potential to uncover new trends or patterns, or that can be used to make informed decisions.
In this article, we’ll examine some fascinating datasets spanning various industries.
We believe that learning from data can be playful, beautiful, and engaging, so we intentionally included a mix of enjoyable data to play with.
So whether you’re a seasoned data scientist, a student, or someone who loves to peek behind the curtains to understand the world better, you’ll find something fascinating in this article.
Shall we begin?
Now, let’s dive into the first dataset: NYC Taxi Trips!

1. NYC Taxi Trips Data Set

We start the list with an excellent dataset from the Big Apple to get things rolling. Everyone loves a good New York City story, and what better way to explore the city’s dynamics than by analyzing its taxi cab trips?
This dataset, which covers a slice of time in 2013, offers fascinating insights into the ebb and flow of urban life.
In addition to exploring human movement in the concrete jungle, the dataset also serves as an ideal starting point for learning or refining data science skills, especially if you’re interested in fields like urban planning or transportation.
Attributes that might nuance the data stories are the day of the week and month the cab trips occurred, the trip’s duration, starting and ending locations, and other geo data.
Wait, what, you can analyze the Play Store? Let’s take a deeper look.
2. Google PlayStore Apps and Reviews

The official Google Play Store houses millions of apps, offering users many options to enhance their digital lives. This dataset gives you access to millions of app details and user reviews.
Your analyses could consider data attributes such as the app name, category, rating, review sentiment, and frequency of installations.
Whether you’re a budding app developer or a marketer looking to understand the Android app ecosystem, this dataset is your ticket to gaining deep insights and making informed decisions about everything Google Play.
Ready to dive into the world of Android culture and understand more about the apps that define today’s digital landscape? Consider analyzing this dataset available on Kaggle.
Have you heard of bitcoin? I’m sure you have? With this dataset, you can analyze historical data and use it to become a wise investor or maybe a considerable risktaker?
3. Bitcoin Historical Price Data

Bitcoins, bitcoins, bitcoins… Come on, you’ve heard of them! They’re like the rockstars of the digital currency world, with their values bouncing around like a ball in a pinball machine.
But how does a data aficionado like you make sense of all this chaos?
Well, you look at historical Bitcoin price data, of course! With this dataset in hand, you can go back to when Bitcoin was just a few bucks and track its wild, phenomenal ride to becoming the stuff of Wall Street legend.
What makes this data exploration particularly exciting is that you can spot all sorts of trends, patterns, and anomalies.
You can also look at real-world events and see how they affected Bitcoin prices. It’s the perfect playground for anyone learning about financial markets, economics, and cryptocurrency.

This dataset is available as a CSV file for download on Kaggle.
Ready to take a trip back in time to relive the glory and drama of the Olympic Games?
4. 120 Years of Olympic History
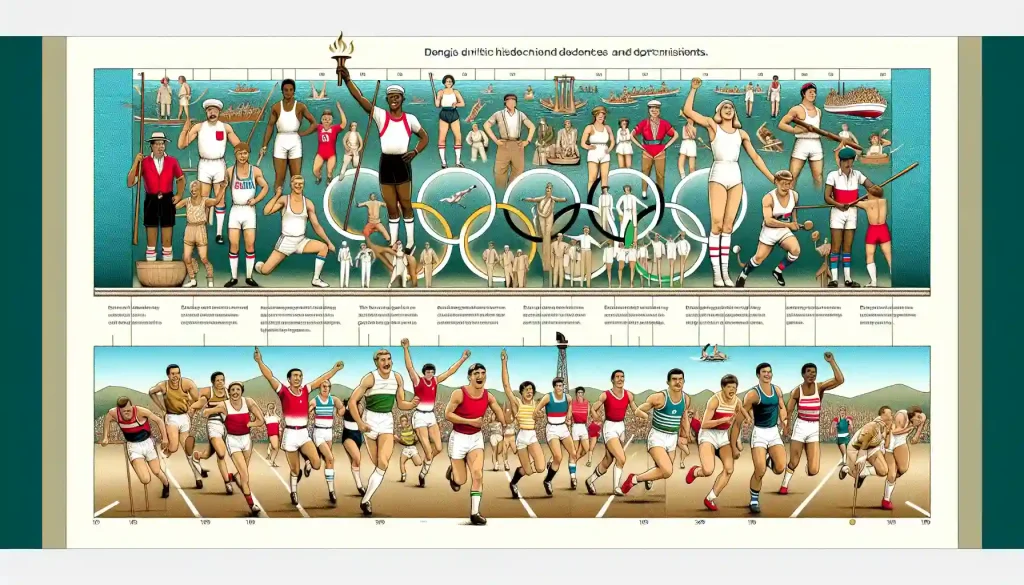
Ready to travel back in time and relive the glory and drama of the Olympic Games? The 120 Years of Olympic History dataset captures the spirit of the world’s most celebrated sporting event.
From the first modern Olympiad in 1896 to the more recent games, this comprehensive dataset offers a treasure trove of information on every aspect of the Olympic experience.
This dataset includes alerts that are historical moments, such as the two World Wars, South Africa’s apartheid regime, and the boycotts of the Moscow and Los Angeles games in 1980 and 1984, which shaped the Olympics throughout the years.
If you’re a data scientist or a sports enthusiast, this dataset is a must-have for your collection.
So, whether it’s exploring the evolution of sports, analyzing trends, or discovering incredible achievements, there’s a wealth of knowledge waiting to be uncovered in this dataset, available for download on Kaggle.
Now, let’s dive into the fascinating world of birdsong classification and explore the melodies of the wild!
5. Birdsong Classification

Go ahead and explore the fascinating world of birdsong classification.
This dataset allows you to train and test your models for classifying bird songs. It contains a subset of avian sounds from the Xeno-Canto dataset, giving you a rich collection of audio clips and their corresponding bird species information.
This dataset is fascinating for data scientists or anyone interested in audio processing, signal analysis, and machine learning.
You can dive into fields such as audio signal processing and data augmentation techniques, which can be used on audio data.
So, if you’re a fan of feathered friends or love to embrace the sounds of nature in your data work, this dataset is a must-have in your collection.
Now, let’s take a behind-the-scenes peek into the world of cinema with the IMDB Movie Metadata dataset!
6. IMDB Movie Metadata Dataset

Movie buffs and data lovers unite! The Internet Movie Database, or IMDB as its friends call it, has all the juicy details about your favorite films, from quotes to trivia to ratings.
The IMDB Movie Metadata dataset is the ultimate backstage pass, giving you access to a wealth of information about the silver screen. With this treasure trove of data, you can explore the rise and fall of genres, dissect actor and director profiles, and uncover hidden gems.
This dataset is perfect for data scientists, movie enthusiasts, and anyone who loves a good story. It’s a valuable resource for creating recommendation systems, conducting sentiment analysis, and understanding audience preferences.
So, whether you’re a blockbuster or indie flicks fan, this dataset will surely be a hit in your data arsenal. You can find the dataset on Kaggle.
Next, let’s take a look at the GOT dataset.
7. Game of Thrones TV Scripts

The world of Westeros is an epic tapestry of power, betrayal, and ambition. It’s the place that makes you want to dive deep into the data behind it all.

This dataset contains scripts from every episode of the Game of Thrones TV show, offering a rich source of information for fans and data enthusiasts alike. You can use it to dissect dialogue patterns, explore character arcs, or even predict plot twists.
Whether you’re a programmer, a data scientist, or a die-hard fan, this dataset is a treasure trove of insights and surprises.
Are you ready to unravel the intrigues of Westeros and dive deep into the world of Game of Thrones? This dataset, which is in JSON format, is available for download on Kaggle.
For the optimal experience, consider using data analysis software like Python with the panda’s library.
Now, let’s venture into the heart of New York City’s vibrant data landscape with the Uber Pickups dataset!
8. Uber Pickups in New York City

New York City is known for its hustle and bustle, and with this dataset, you can get a front-row seat to all the action.
The Uber Pickups in New York City dataset contains information about over 4.5 million Uber pickups in the city from 2014.
By exploring this dataset, with its over 4.5 million Uber pickups in the city from 2014, you can gain valuable insights into the dynamics of urban transportation, uncovering patterns in the flow of people and vehicles throughout the day.
Whether you’re a data scientist, a transportation planner, or just a curious mind with a love for numbers, you’ll find this dataset to be a treasure trove of knowledge and a journey into the heart of the Big Apple.
This dataset is in CSV format and available for download on Kaggle.
Are you a Pokémon fan? If so, you’re in for a treat!
9. Pokemon with Stats for Battle
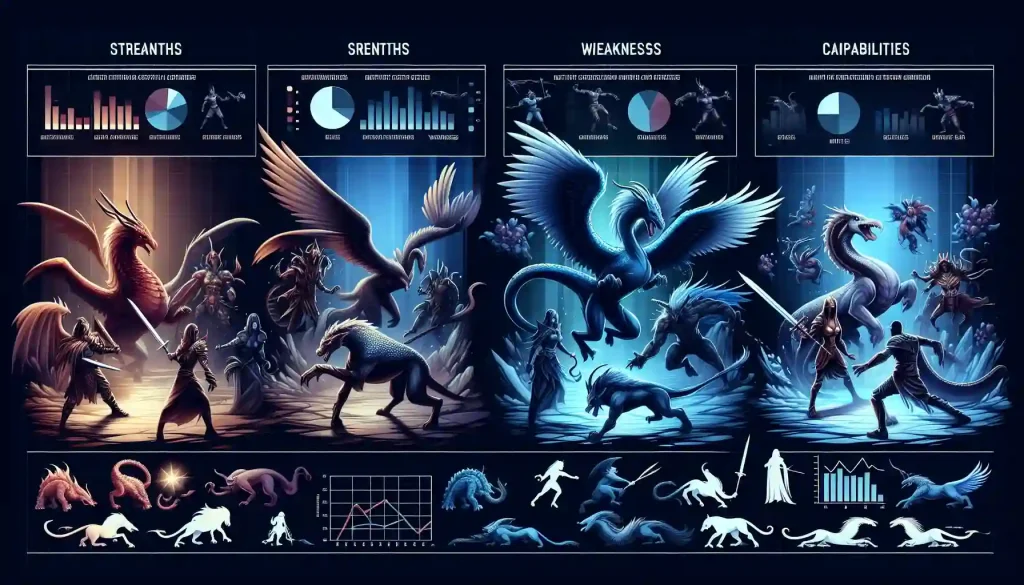
Are you a Pokémon fan? If so, you’re in for a treat! With this dataset, you can immerse yourself in the world of Pokémon and explore their stats and battle prowess.
Ready to embark on a journey to become a Pokémon Master and possibly discover the power that’s inside?
This dataset covers all the Pokémon from the first seven generations, with information about their type, stats, and abilities. Whether you’re playing the games or watching the shows, you’ll find this dataset to be a valuable resource.
Using the data you’ve collected, you can analyze, compare, and even predict the outcome of Pokémon battles!
This dataset is available for download as a CSV file on Kaggle.
Now, let’s unravel the intriguing medical mystery behind heart disease with the Heart Disease UCI dataset!
10. Heart Disease UCI

The Heart Disease UCI dataset is valuable for anyone interested in healthcare and clinical analysis.
This dataset includes information about individuals and their medical histories. The ultimate goal is to use various attributes to predict the presence of heart disease.
It provides an excellent opportunity for budding data scientists, medical professionals, and anyone interested in health analytics to explore and gain insights into one of society’s most pressing health issues.
The dataset includes age, sex, chest pain type, resting blood pressure, cholesterol levels, fasting blood sugar, resting electrocardiographic results, maximum heart rate achieved, exercise-induced angina, and more.
This is particularly useful for those interested in machine learning, as it allows for developing and testing models for disease prediction.
The Heart Disease UCI dataset is available for download on the UCI Machine Learning Repository.
Finally, let’s reflect on some of these main points
Final Thoughts

These datasets offer a rich playground for data enthusiasts and professionals from various fields.
Each dataset provides unique insights for analysis, from urban mobility in NYC and Android app trends to the historical saga of the Olympics, birdsong classification, and the cinematic world of IMDB.
The Game of Thrones scripts, Uber pickups in NYC, Pokémon stats, and heart disease data further expand this diverse collection, catering to various interests and analytical pursuits.
Whether you’re delving into urban planning, financial analysis, sports history, natural science, film studies, fantasy TV, transportation, gaming, or medical research, these datasets are gateways to a world of discovery and innovation.
Check out this informative video by EnterpriseDNA on the new data mentor AI Code generator:
Frequently Asked Questions
How can I start to explore these top 10 datasets?
To start exploring these top 10 datasets, you’ll want to open a data analysis tool like Microsoft Excel or Google Sheets. Then, import the dataset by going to File>Open, and selecting one of the files from the dataset download.
Once inside a data analysis tool, you can visualize your data, create charts, and perform data analysis like sorting and wrapping text.
What is the best way to analyze these datasets?
The best way to analyze these datasets is by combining data visualization and exploring different variables.
First, you should explore the dataset’s structure by finding the headers and data and checking for missing values or outliers.
Next, you should analyze different variables to find patterns or relationships and use data visualization to make your findings more accessible to others.
Can I use these datasets to practice my skills?
Yes, you can use these datasets to practice your data analysis skills. It’s a great way to hone your abilities as a data analyst and understand more about our world.
What are the best tools for exploring these datasets?
Many tools are available for exploring and analyzing datasets, and the best tool to use depends on your needs and skill level. If you’re new to data analysis, a spreadsheet program like Excel or Google Sheets is an excellent place to start.
You might want to look at the following options:
SQL: A language for managing and analyzing data in relational databases.
Python: A programming language with libraries like pandas for data analysis and visualization.
R: A programming language for statistical computing and graphics.
Tools like Tableau and Power BI allow you to create interactive charts and dashboards from your data with minimal programming if you’re primarily interested in data visualization.
How difficult is it to set up a data analysis tool?
The difficulty level of setting up a data analysis tool depends on your chosen tool and your expertise level.
For example, setting up Excel or Google Sheets is generally straightforward and requires little to no programming knowledge. These tools are also user-friendly, with intuitive interfaces and extensive documentation to help you get started.