Are you using Tableau and have data points on a map or scatterplot you want to group together? Welcome to the Tableau Lassoo Tool
The lasso tool in Tableau is a powerful feature that allows users to select marks by drawing a freehand shape around them. This functionality is particularly useful when focusing on specific data points and excluding others in close proximity. The tool provides an efficient way of making detailed selections, streamlining data analysis and visualization tasks.
In this article, we embark on a journey to explore the capabilities and significance of the Tableau Lasso Tool, delving into its utility, applications, and the art of data exploration it enables.

Whether you’re an adept analyst or an aspiring data enthusiast, join us in unlocking the potential of this tool to elevate your data exploration prowess.
Understanding the Lasso Tool in Tableau
The Lasso Tool in Tableau is a powerful feature that allows users to freely select data points within their visualizations.
By offering a freehand selection method, the tool enables users to efficiently capture specific data points or groups of data without being confined to the rectilinear constraints of the rectangular selection tool.
Using the lasso tool is straightforward. In map or scatterplot visualizations, users can make a lasso selection, for example, particular cities in the selection area, by choosing the lasso selection option from the toolbar menu, then clicking and dragging the cursor freely around the desired data points.
This flexibility is advantageous when selecting certain data points while avoiding adjacent ones.
The tool also facilitates easy manipulation of selected marks. First, select marks with the lasso tool button and combine them in a single group or set.

In summary, the lasso tool is an essential feature for making precise and controlled selections in various types of visualizations.
Its user-friendly interface and capability to support multiple selection techniques contribute to its value in data analysis, making it a staple element in the Tableau user experience.
Now, lets run through how to start using it in 4 simple steps.
How to Start Using the Lasso Selection Tool in 4 Simple Steps
Here is a step-by-step guide to using the lasso selection tool in Tableau:
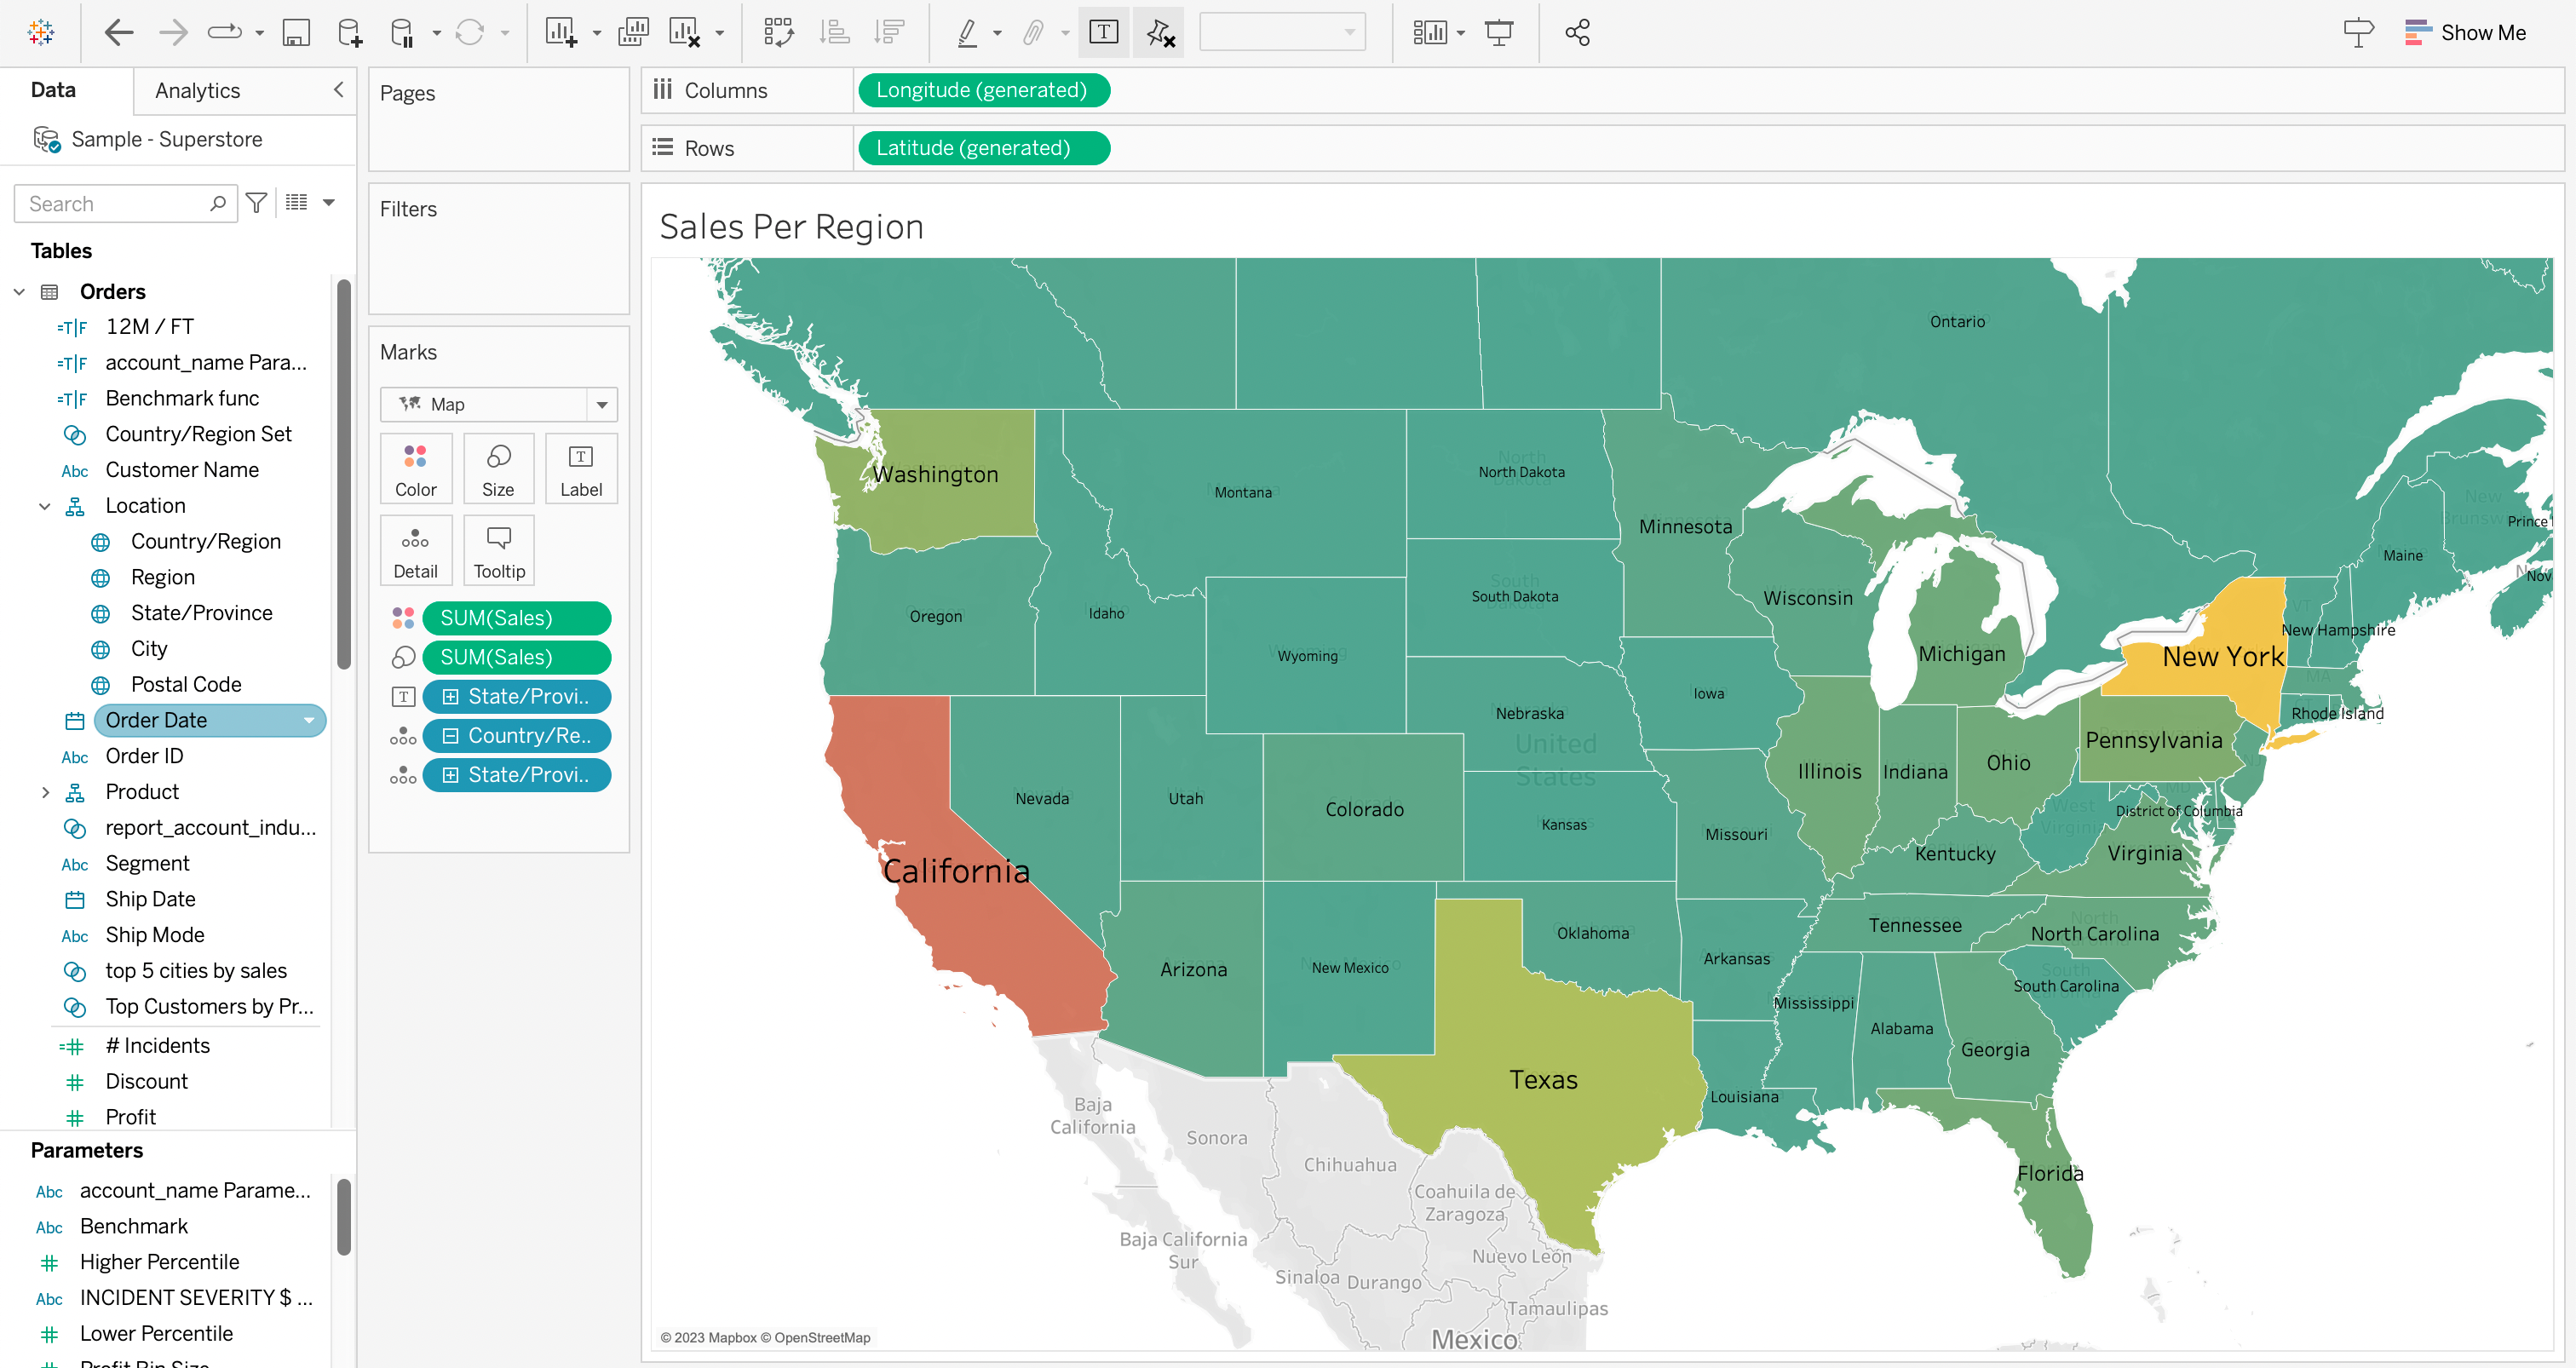
- In a Tableau workspace, create a visualization that contains the data points you want to analyze. This is often a map view, but the lasso tool can also be used with other visualization types that have distinct marks.
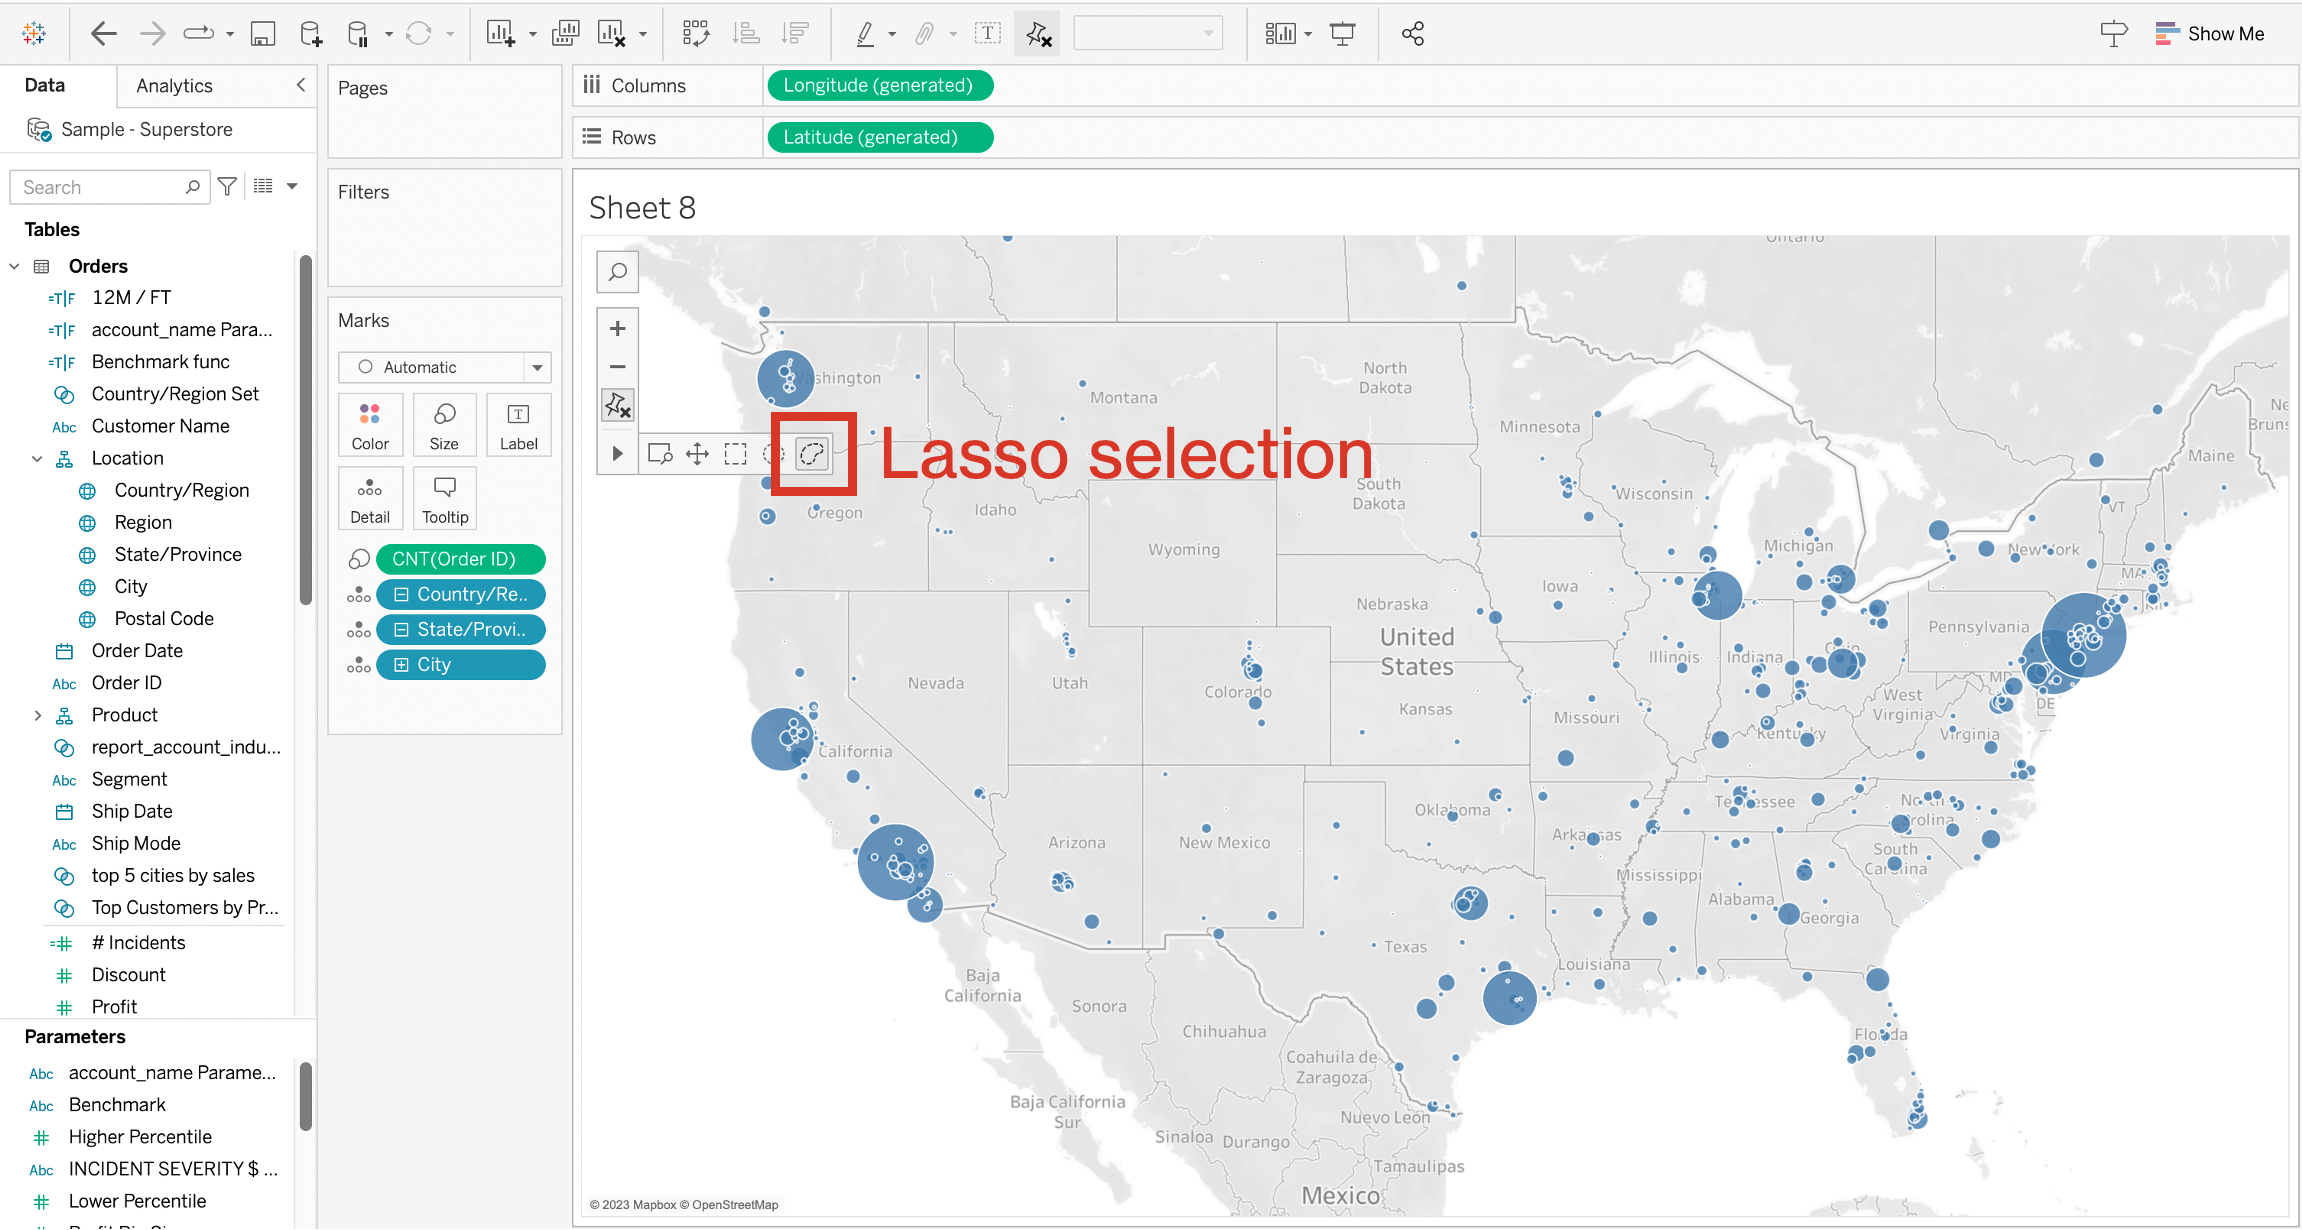
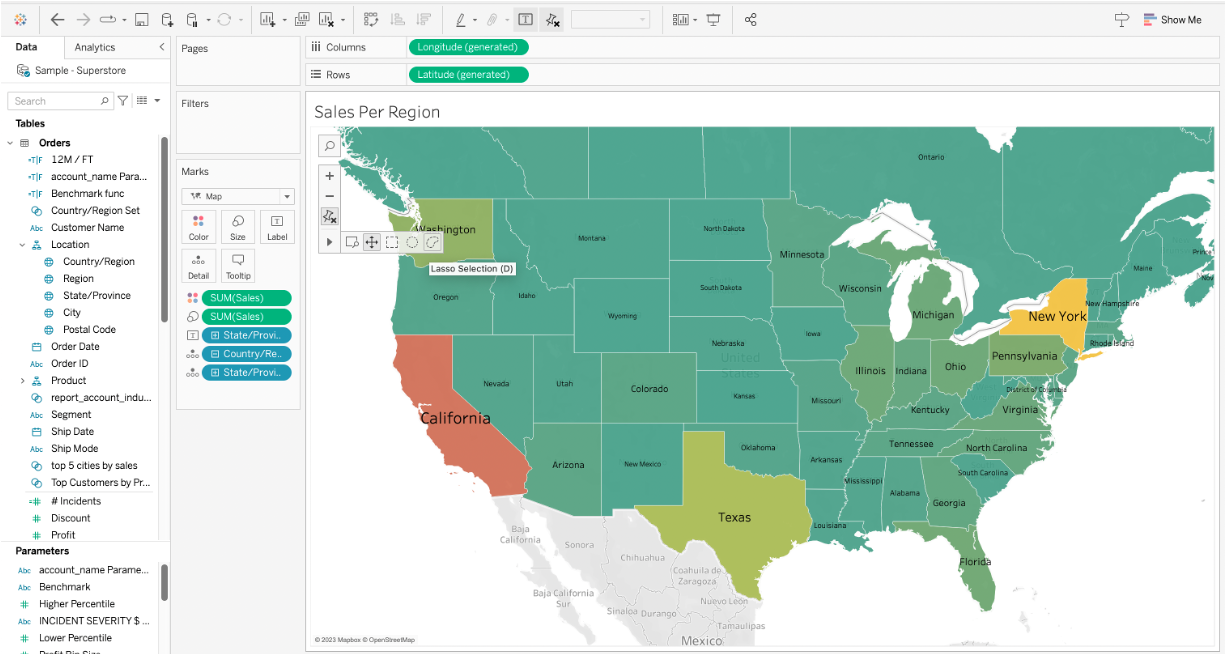
- On the view toolbar, hover over the arrow and select the lasso tool (usually represented by a lasso icon).

- Click and drag your cursor over the visualization to draw a freeform shape around the marks you want to select.
- Once all desired data points are included within the drawn shape, release the left mouse button to complete the lasso selection.
If you’re already acquainted with the power of the lasso selection tool, it’s time to delve into the practical use cases that demonstrate its potential.
Practical Use Cases
This selection tool is one of the three prominent mark selection tools in Tableau, including the rectangular and radial Selection Tools.
Contrary to the rectangular and radial selection tools, the lasso tool is a freehand feature for data exploration that allows users to select marks by drawing a projection over the map.
This selection method is especially useful when you want to select certain data points and avoid specific ones around them, making it a valuable tool for data exploration.
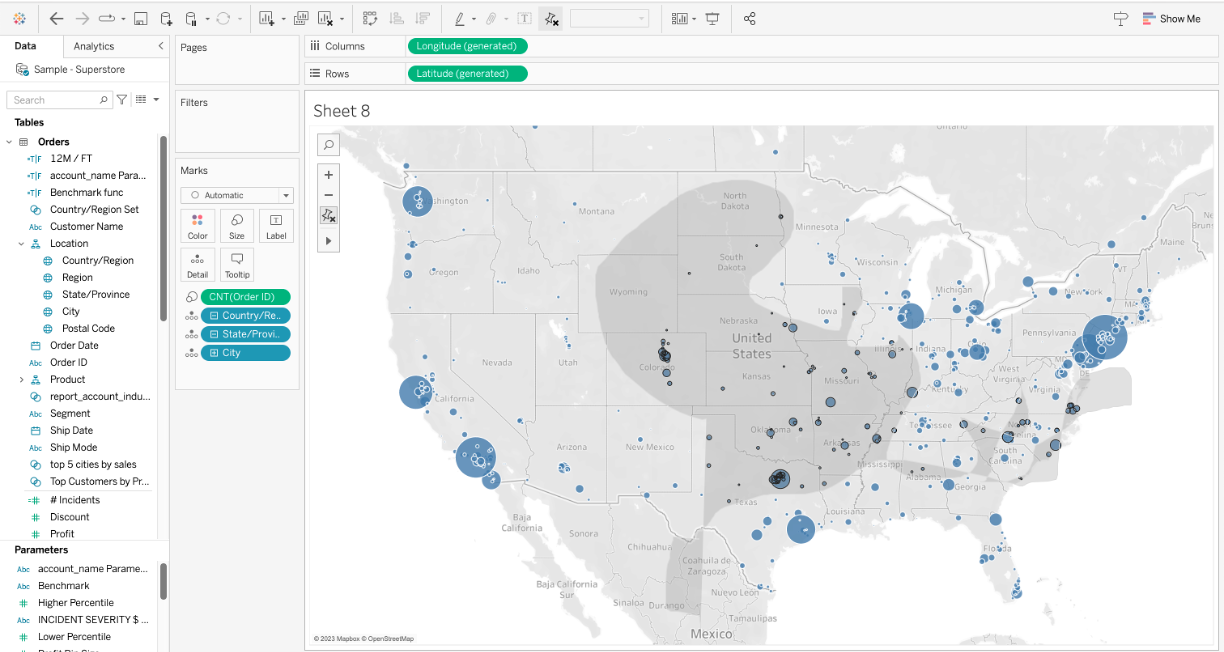
One of the primary use cases is for analyzing geographic data. For instance, imagine you are working with data on store locations and their respective sales.
In this case, you can use the tool to easily select the stores within a specific region and analyze their sales trends without accidentally including points of data from neighboring areas.
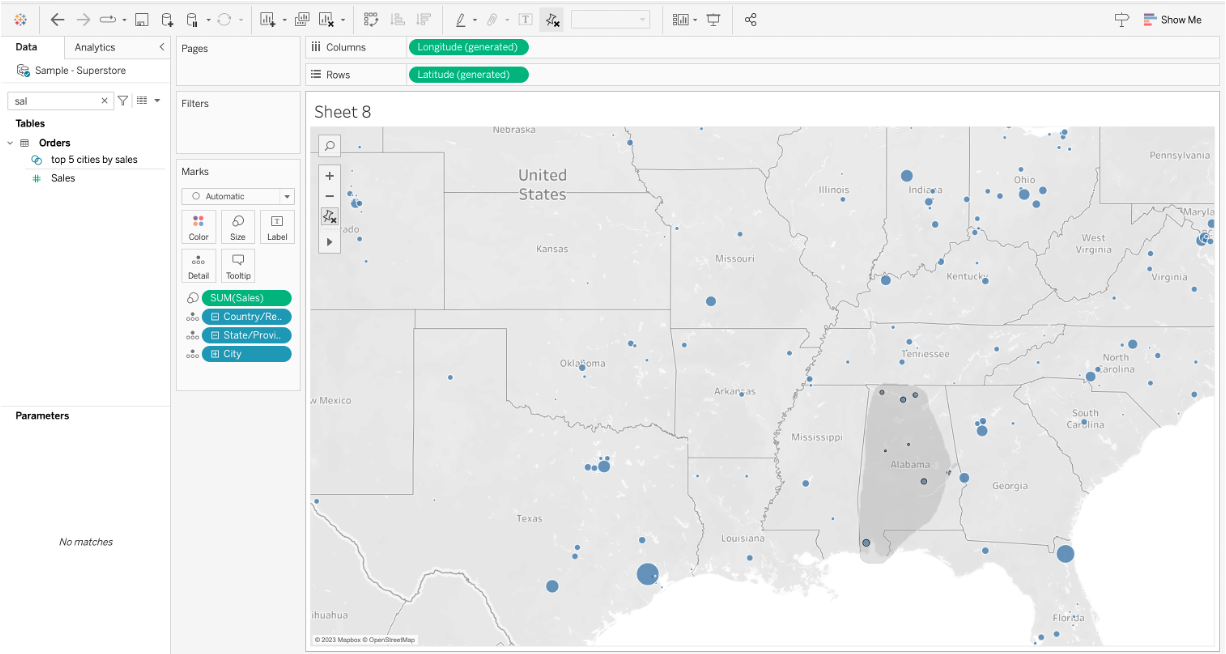
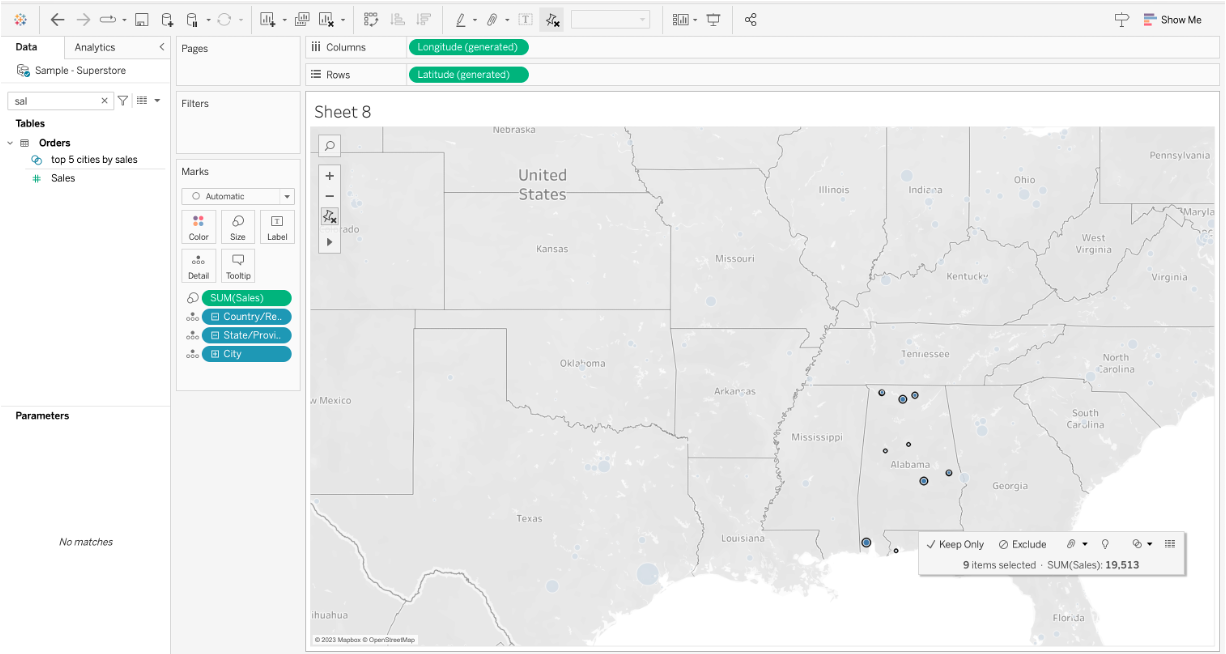
In the picture below, you can see the selection connected with location – in this case, all cities from Alabama were selected.
Furthermore, using a rectangular selection tool wouldn’t be ineffective for this use case.
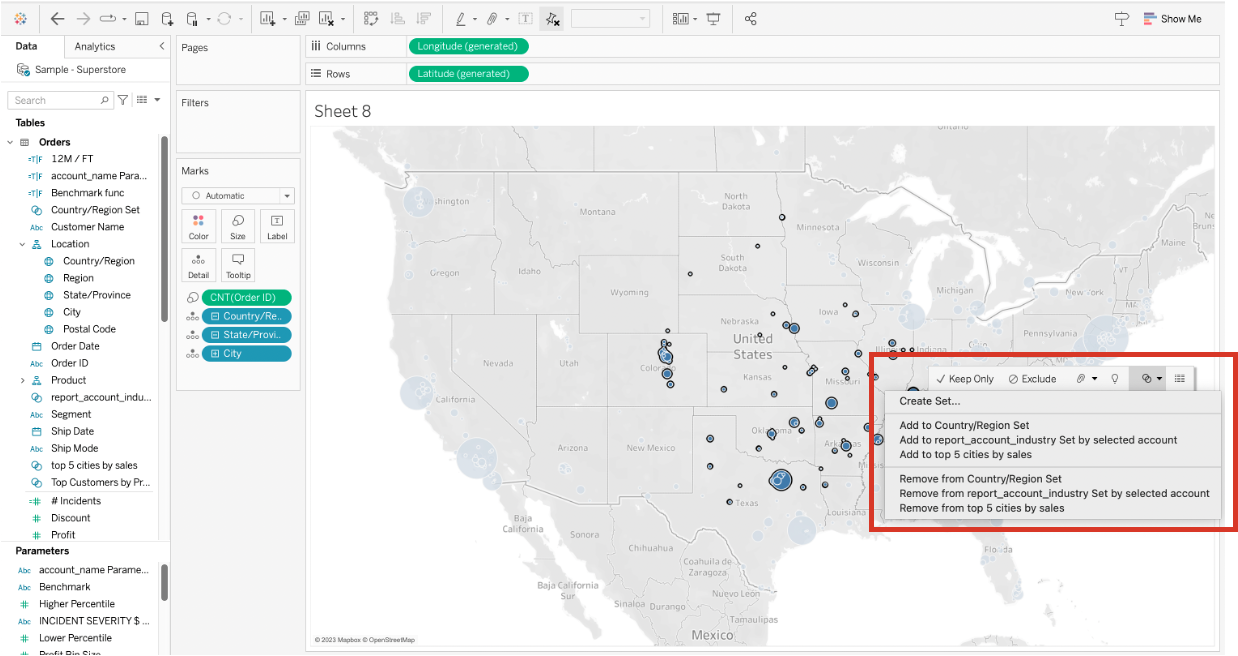
Another critical aspect of data exploration with the lasso tool is that it can help you learn more about the relationships between different data points.
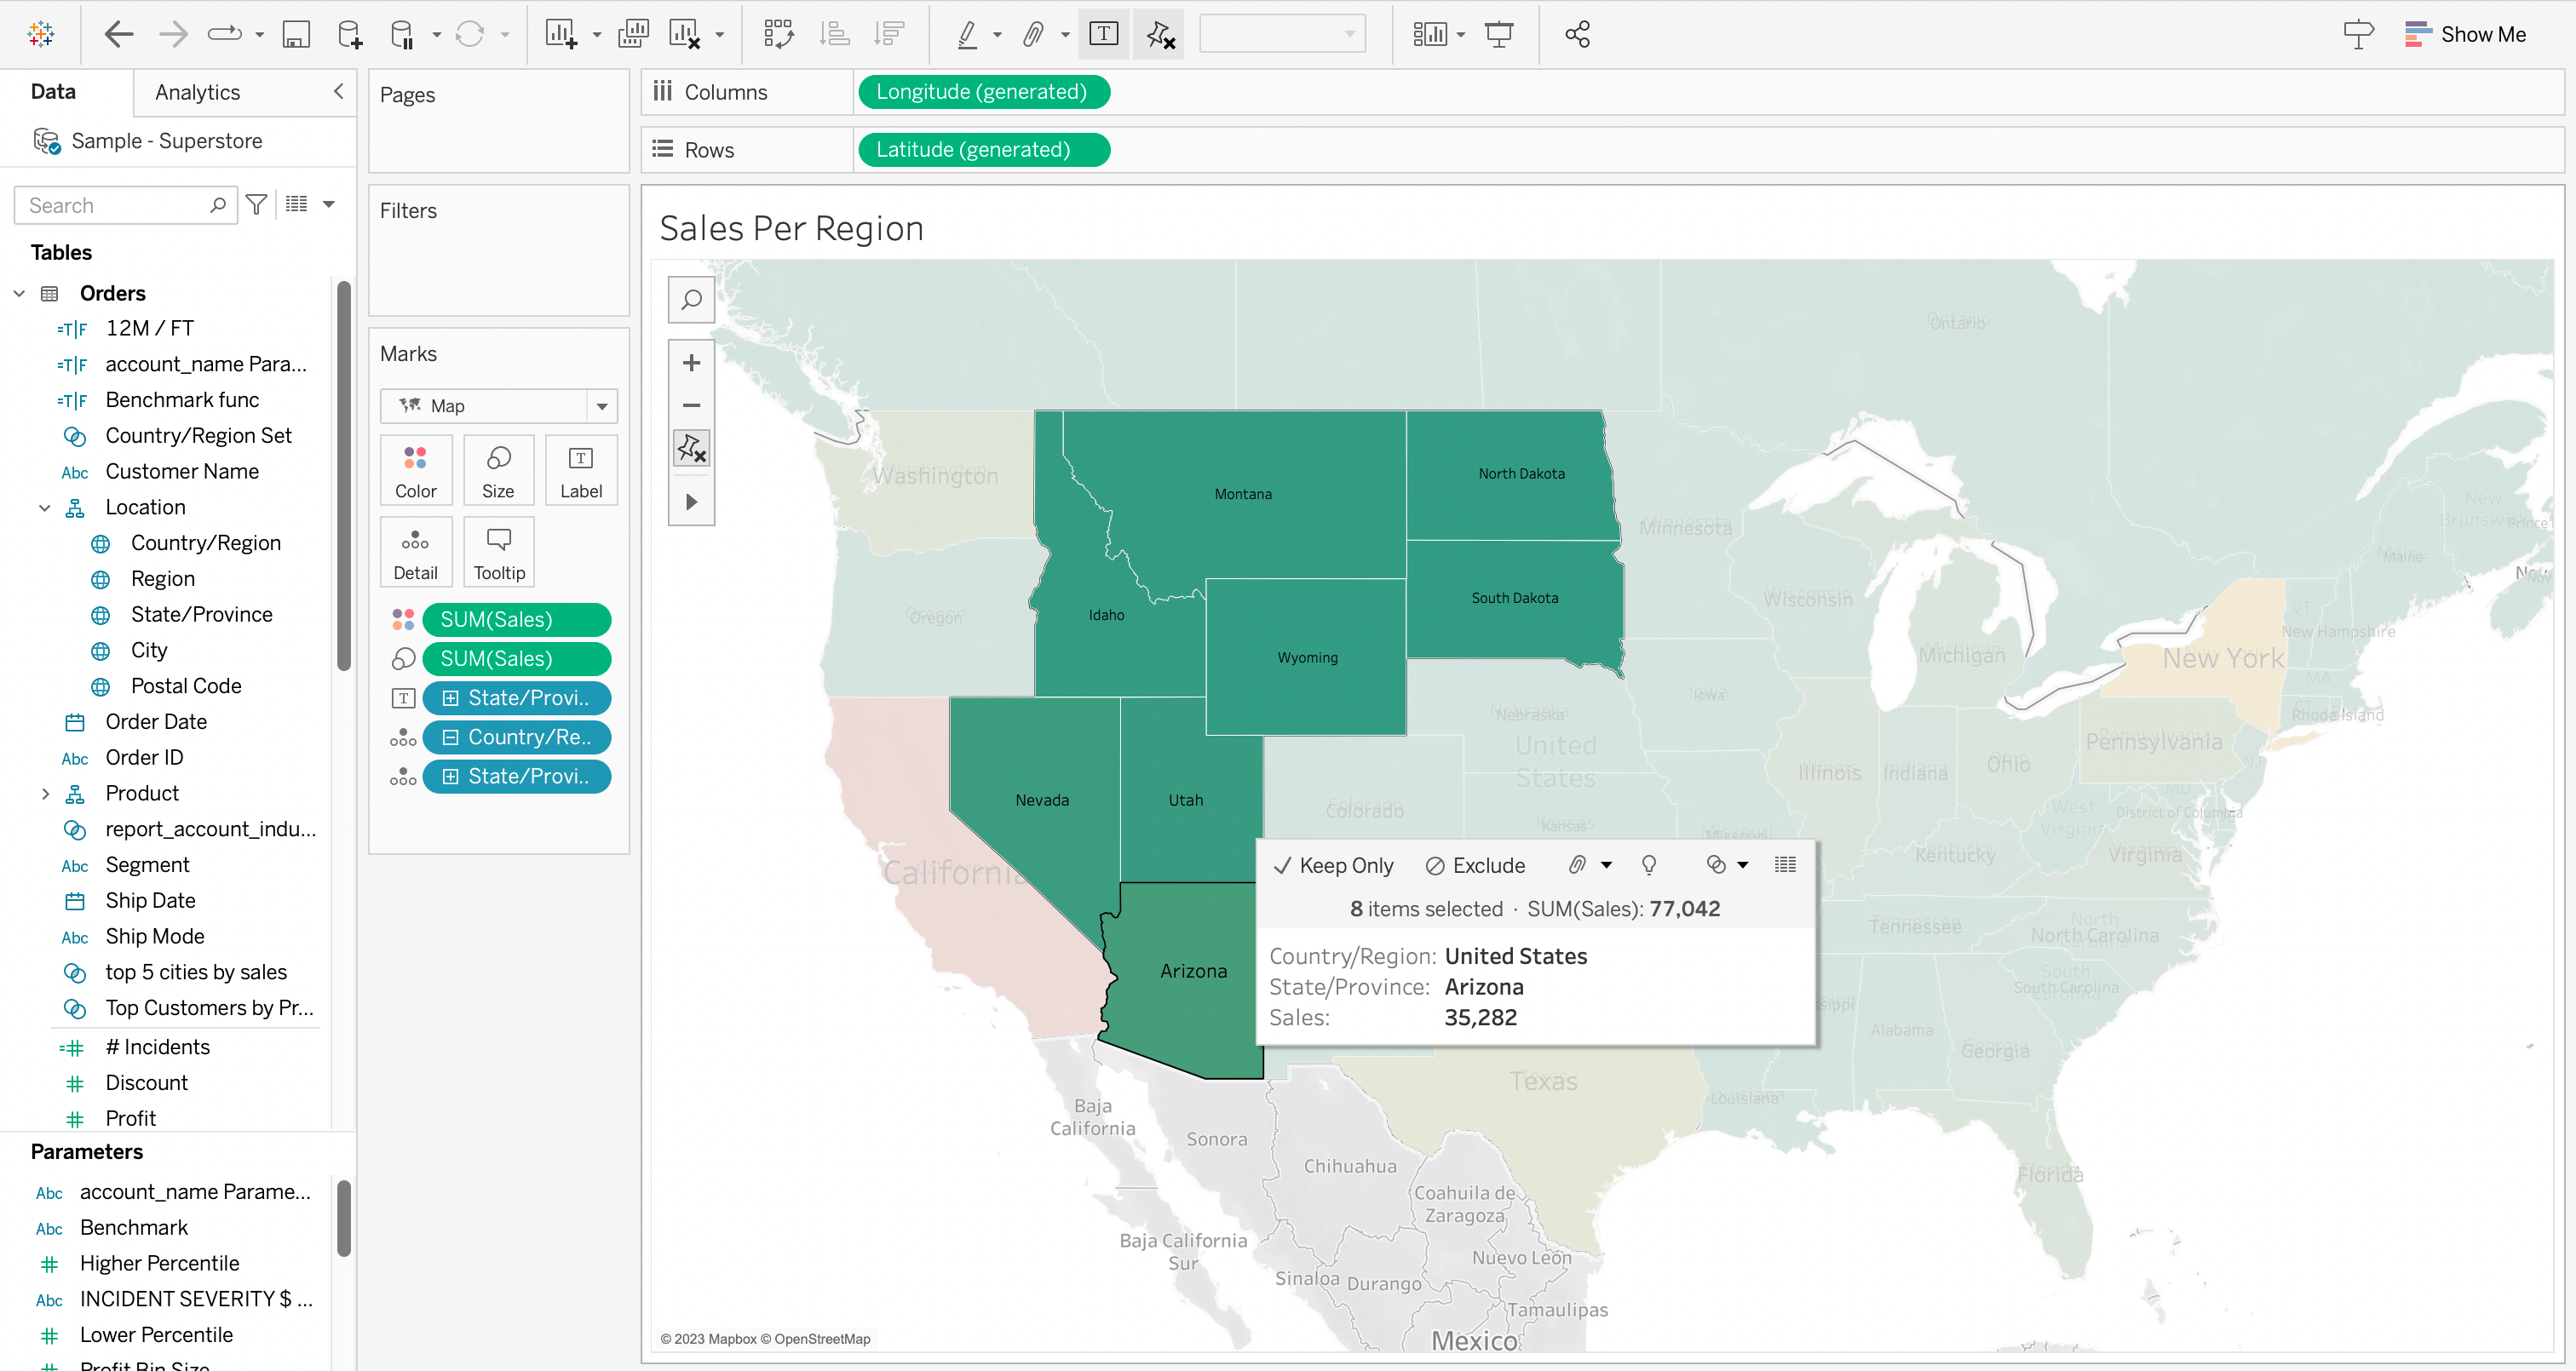
For example, when you select multiple marks, Tableau displays tooltips with information about the selected data. This way, you can quickly gain insights into correlations and patterns among the selected data points.
In the picture below, you can read what is the total Sales for Alabama.

Moreover, the lasso tool plays a crucial role in filtering and focusing on specific data points, making it an invaluable resource for data scientists and machine learning practitioners.
Final Thoughts
Tableau’s lasso tool represents a significant leap forward in data exploration, transforming how we interact with visualizations.
By allowing users to draw freehand selections, the lasso tool empowers them to target specific data points while excluding others nearby.
The lasso tool’s flexibility extends to a variety of scenarios, from dissecting geographic data to uncovering relationships between data points.
In a nutshell, the Tableau lasso tool is a bridge between raw data and meaningful insights. Its utility extends beyond the traditional selection methods, offering a versatile approach to data exploration.
Whether you’re an experienced analyst or a novice data enthusiast, the lasso tool empowers you to unlock deeper insights and transform data into actionable knowledge.
Frequently Asked Questions
How to select multiple marks using the lasso tool?
To select multiple marks using the lasso tool in Tableau, select the lasso selection tool located on the toolbar above the visualization. You can then click and drag your cursor to draw a freeform shape around the data points or marks you want to select.
When to use the lasso tool versus rectangular selection?
Use the lasso tool when selecting an irregular or non-rectangular group of marks, such as data points that follow a curved path or are clustered in specific areas of the visualization.
The rectangular selection tool is more suitable for selecting data points that are arranged in a rectangular or square shape or when you need to quickly select a large group of marks that are close together.
Can lasso tool be used on non-map visualizations?
Yes, the lasso tool can be used on non-map visualizations, such as scatter plots or any other visualization where you might want to select a non-rectangular or irregular group of marks. This makes the lasso tool versatile and useful for a variety of data analysis tasks in Tableau.
Is it possible to customize the lasso selection?
It is impossible to directly customize the appearance or shape of the Lasso selection tool. However, you can adjust your selection by modifying the path you draw with your cursor, allowing you to select the exact group of marks you need.
How to deselect marks selected by the lasso tool?
To deselect marks selected, simply click on an empty space within your visualization, or press the Escape key on your keyboard. This will clear any active selection and allow you to start a new selection from scratch.
Are there shortcuts for using the Lasso tool?
While there isn’t a specific shortcut key for the Lasso tool, you can quickly access it by clicking on the toolbar above your visualization and selecting the Lasso Selection tool.
Additionally, using the Ctrl key (or the Command key if you are MacOS user) while clicking and dragging will allow you to add to your current selection rather than creating a new one. This can be particularly helpful when selecting multiple irregular groups of marks.