One of the most significant features of Tableau is the ability to use Level of Detail (LOD) expressions. This feature helps you compute values at various granularity levels, ensuring a more accurate and flexible analysis of data.
Level of Detail (LOD) expressions are used to perform aggregations that are not at the level of detail of the visualization. They allow you to create calculations that are more intricate and are independent of the view’s granularity. In simple terms, they allow you to control the granularity or level of detail of your expression.
As you begin your journey with Tableau LOD expressions, you’ll discover how this powerful syntax simplifies and extends Tableau’s calculation language.

This article is a complete step-by-step guide to Tableau LOD expressions. You will learn how to use LOD expressions, their types, and applications.
Let’s get into it!

How to Create a LOD Expression
To create a LOD expression, you must first create a new calculated field, as shown below:
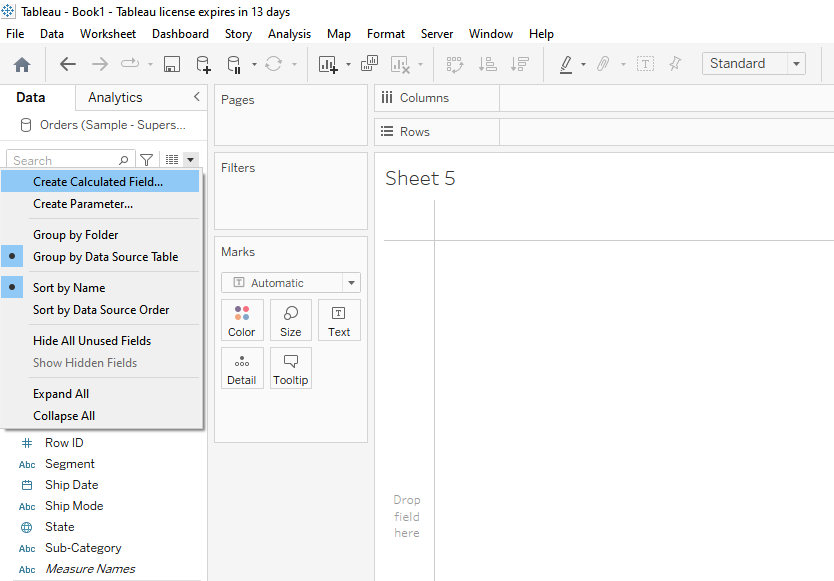
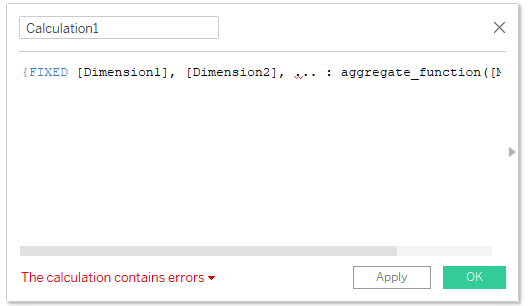
When you click Create Calculated Field, a calculation tab will open, where you can write your LOD expressions.
In the next section, we will explore the types of LOD expressions that you can use in calculated fields.
What Are The Types of LOD Expressions
LOD expressions can be categorized into three types:

- Fixed LOD Expressions
- Include LOD Expressions
- Exclude LOD Expressions
1. What is a Fixed LOD Expression
Fixed LODs compute a value using the specified dimensions. It ignores the view’s dimensions when performing the calculation.
The calculation is performed at the level of detail specified by the given dimensions.
Syntax of Fixed LOD expressions
The fixed LOD expression syntax is:
{FIXED [Dimension1], [Dimension2], ... : aggregate_function([Measure])}Let’s break down each part of this syntax:
1) { } – Curly Braces: These enclose the entire LOD expression.
2) FIXED – Keyword: This keyword is used to define the type of LOD expression. In this case, it’s a FIXED LOD expression.
3) [Dimension1], [Dimension2], … – Dimensions: These are the dimensions that you want to fix the calculation at. The calculation will be performed at the level of detail specified by these dimensions, regardless of the view’s granularity.
You can specify one or more dimensions, separated by commas.
4) : – Colon: This separates the dimensions from the aggregation part of the expression.
5) aggregate_function([Measure]) – Aggregation: This is where you specify the aggregation function to be applied to a measure.
The aggregate_function can be any of Tableau’s aggregation functions like SUM, AVG, MIN, MAX, etc.
6) [Measure] is the field that you want to aggregate.
Example of a Fixed LOD
Suppose you have a dataset of sales transactions, and you want to calculate the total sales value for each Category, regardless of any other dimensions in the view.
The FIXED LOD expression would look like this:
{FIXED [Category]: SUM([Sales])}In this example:

- [Product Category] is the dimension at which the calculation is fixed.
- SUM([Sales]) is the aggregation, calculating the total sales for each Product Category.
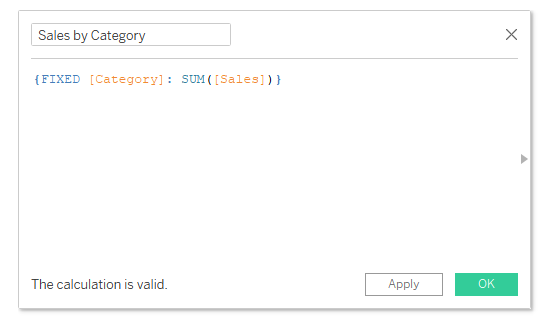
This expression will give you the total sales for each Category across the entire dataset, irrespective of any filters or additional dimensions present in your view.
2. What is an Include LOD Expression
An Include LOD Expression computes a value using both the dimensions in the view and the dimensions specified in the calculation.
The calculation is performed at a finer level of detail than what is present in the view.
Syntax of Include LOD
The syntax for an INCLUDE Level of Detail expression in Tableau is:
{INCLUDE [Dimension1], [Dimension2], ... : aggregate_function([Measure])}Let’s break down each part of this syntax:
1) { } – Curly Braces: These enclose the entire LOD expression.
2) INCLUDE – Keyword: This keyword is used to define the type of LOD expression. In this case, it’s an INCLUDE LOD expression.
3) [Dimension1], [Dimension2], … – Dimensions: These are the dimensions that you want to include in the calculation, in addition to the dimensions already present in the view.
You can specify one or more dimensions, separated by commas.
4) : – Colon: This separates the dimensions from the aggregation part of the expression.
5) aggregate_function([Measure]) – Aggregation: This is where you specify the aggregation function to be applied to a measure.
The aggregate_function can be any of Tableau’s aggregation functions like SUM, AVG, MIN, MAX, etc.
6) [Measure] is the field that you want to aggregate.
Example of an Include LOD
Let’s say you have a view displaying the total sales for each Region, and you want to calculate the average sales per Category within each Region.
The INCLUDE LOD expression would look like this:
{INCLUDE [Category]: AVG([Sales])}In this example:
- The view already has the [Region] dimension.
- By including [Product Category], you are calculating the average sales for each category within each Region.
- Even if the [Product Category] is not in the view, the calculation considers it due to the INCLUDE LOD expression.
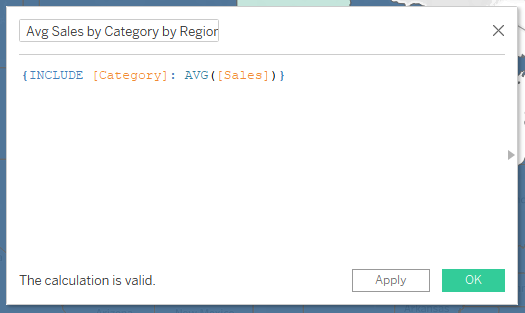
This expression will give you the average sales for each product category within each region, and it can be used to compare with the total sales for each region present in your view.
3. What is an Exclude LOD Expression
An Exclude LOD expression computes a value using the dimensions in the view, excluding the dimensions specified in the calculation.
The calculation is performed at a coarser level of detail than what is present in the view.
Syntax of LOD Expression
Here’s a breakdown of this syntax:

1) { } – Curly Braces: These enclose the entire LOD expression.
2) EXCLUDE – Keyword: This specifies that it is an EXCLUDE LOD expression.
3) [Dimension1], [Dimension2], … – Dimensions: These are the dimensions you want to exclude from the calculation. You can list one or more dimensions, separated by commas.
4) : – Colon: This separates the list of dimensions from the aggregation portion of the expression.
5) aggregate_function([Measure]) – Aggregation: This is where you specify the aggregation function to be applied to a measure. The function could be SUM, AVG, MIN, MAX, etc., and [Measure] is the field being aggregated.
Example of an Exclude LOD
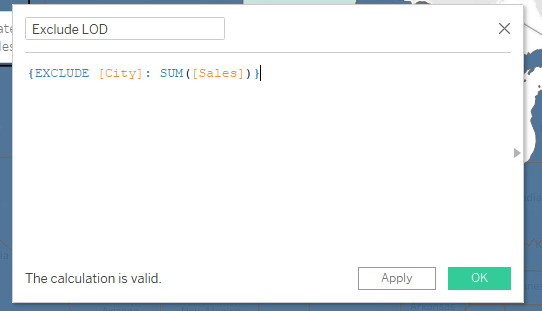
Assume you have a dataset containing sales data for different Regions and Cities. You’ve created a view in Tableau that displays the total sales for each City within each Region.
Now, you want to compare the total sales of each City to the overall total sales of its Region.
However, your view is at the City level, so you would use an EXCLUDE LOD expression to calculate the total sales at the Region level.
{EXCLUDE [City]: SUM([Sales])}In this expression, [City] is the dimension to exclude from the level of detail of the view.
SUM([Sales]) is aggregating the sales data, but by excluding the City dimension, it aggregates sales at the Region level instead of the City level.
The resulting field can be placed in the view alongside the original City-level sales, allowing you to compare the sales of each City with the total sales for the Region.
What Are The Applications of LOD
As you start working on your projects, you’ll need a granular calculation approach in Tableau.
LOD expressions empower you to calculate values at different levels of granularity.

We have listed some of the most common applications of LOD below:
1. Cohort Analysis
When working with cohort analysis, LOD expressions enable you to track the performance of specific data groups over time.
For example, if you are analyzing customer retention, you can use FIXED LOD functions to study the behavior of specific cohorts independent of the level of detail in the view.
2. Daily Profit KPI
If you need to calculate the daily profit KPI for a business, you can utilize LOD expressions to aggregate data at a daily level with relevant dimensions and measures.
You can calculate daily revenues, costs, and profits using LOD expressions like:
{FIXED [Date]: SUM([Revenue])} and {FIXED [Date]: SUM([Cost])}.3. Working with Aggregated Data
LOD expressions offer a compelling approach to working with aggregated data.
Level of detail expressions compute values outside the scope of the view allowing for more detailed comparisons and insights.
This added flexibility takes data analysis to a whole new level.
LOD expressions are a tool to help enhance your data analysis. With a confident and clear understanding of LOD expressions, you are one step closer to unlocking the full potential of your data using Tableau.
Want to learn more about Advanced Data Analytics by OpenAI? Check out the below video:
Final Thoughts
Understanding Tableau’s Level of Detail expressions is crucial for in-depth data visualization. It’s a key feature that allows you to create a detailed and accurate data analysis dashboard.
By learning and using LOD, you will ensure your data analyses are both comprehensive and precise. This tool directly enhances the quality of your work in Tableau, allowing for more informed decisions based on your visualizations.
Frequently Asked Questions
In this section, you will find some frequently asked questions you may have when using LOD expressions in Tableau.

How to use LOD in creating calculations?
To use LOD expressions in creating calculations, first, decide which type of LOD expression (FIXED, INCLUDE, or EXCLUDE) you need, and then format it accordingly in a calculated field.
You can create a new calculated field by right-clicking on your data source and selecting “Create Calculated Field.” Then, enter the LOD expression in the calculation editor, ensuring it is properly formatted.
What are the differences between FIXED, INCLUDE, and EXCLUDE LOD expressions?
- FIXED: A FIXED LOD expression calculates an aggregate value using the specified dimensions and ignores any other dimensions in the view. It is useful when you want to calculate a specific level of granularity within your data and hold it constant across different views.
- INCLUDE: An INCLUDE LOD expression calculates an aggregate value using the specified dimensions, as well as any additional dimensions present in the view. It essentially “includes” the specified dimensions in the overall calculation, even if they’re not present in the view.
- EXCLUDE: An EXCLUDE LOD expression calculates an aggregate value while excluding the specified dimensions. It is helpful when you want to calculate an aggregate value without the influence of certain dimensions.
How do I aggregate strings using LOD in Tableau?
Aggregating strings using LOD in Tableau is not directly possible, but you can use a workaround.
One approach is to convert the strings to numeric values using a calculated field and then aggregate those numeric values.
Another option is to create a LOD expression that determines the number of occurrences for each unique string value in the data set.
How to apply multiple conditions with the FIXED LOD function?
To apply multiple conditions with the FIXED LOD function, use AND or OR logical operators within your expression.
For example, if you want to calculate the total sales for a specific region and product category, you would write an expression like this:
{FIXED [Region], [Product Category]: SUM(IF [Condition1] AND [Condition2] THEN [Sales] END)}
Ensure that your conditions are appropriately set within the expression to achieve the desired results.
Which are the common date-related LOD scenarios?
Common date-related LOD scenarios in Tableau include:
- Calculating sales or profit for specific date ranges.
- Comparing year-over-year or month-over-month growth.
- Creating custom date-based cohorts or groups.
- Analyzing averages and trends over specific periods.
Typically, you need to incorporate date fields into your LOD expressions, ensuring they are formatted correctly and adjusting the aggregation type (e.g., SUM, AVG, MIN, or MAX) to suit your analysis needs.
What is the difference between table calculations and LOD expressions?
Table calculations are created and computed within the Tableau view itself, whereas LOD expressions are computed at the data source level.
Table calculations depend on the specific dimensions and measures present in your view, while LOD expressions allow you to define specific levels of granularity within your data.
Additionally, table calculations operate across the results displayed in a table, applying calculations along rows, columns, or specific segments.
LOD expressions define calculations independently of the table structure, making them more versatile for addressing a variety of analytical questions.