
When working with Power BI, creating a date table can be a valuable asset for your data analysis and visualization tasks. Date tables enable you to filter, group, and analyze time-based data effectively.
In this article, you’ll learn how to easily create a date table in Power BI using a few different approaches.
Creating a custom date table in your data analysis enhances the efficiency of the calendar function and streamlines the process of creating date tables. By establishing a model date table within your data warehouse, you can effectively manage and analyze time-based data, making the creation of date tables more precise and adaptable to your specific needs.

Let’s get into it!
4 Prerequisites Before Starting
Before you start creating a date table in Power BI, there 4 specific prerequisites you should make sure are in place:
Date Column: Your date table should have a date column with a datatype of date/time. This column will serve as the basis for building the rest of the table.
No Blanks: A date column should not have any blanks. Every row needs to have a valid date.
Unique Values: A date column must have unique values. Each date should appear only once in the column.
No Missing Dates: There should be no dates missing from a date column, especially if you are working with continuous time periods.
Having a well-structured date table is crucial for accurate date filtering, calculations, and grouping of your data in Power BI.
In the next section, we will go through the steps needed to create a date table and how to customize it to meet your specific requirements.
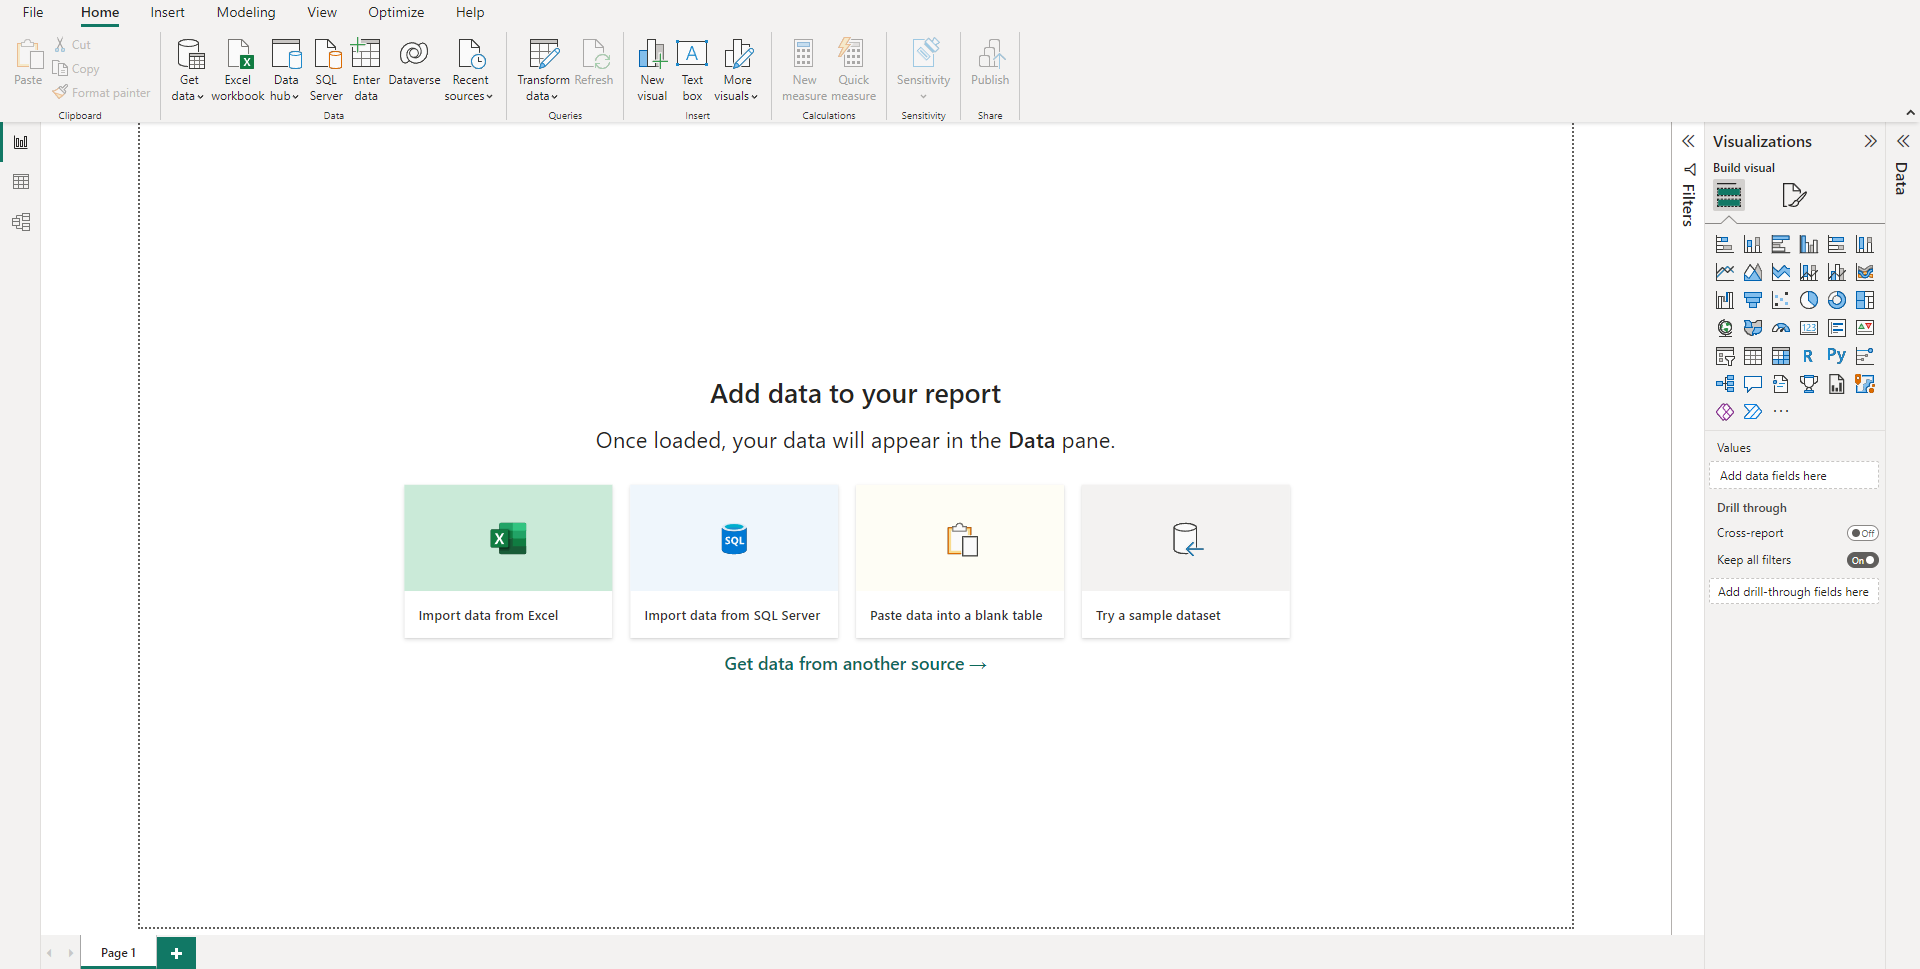
In the case of an auto date/timetable, it won’t be visible as a field in the Fields pane. Rather, you’ll find it as an expandable drop-down under the date column name. Upon expanding the date column, you’ll encounter a Date Hierarchy that consists of Year, Quarter, Month, and Day.
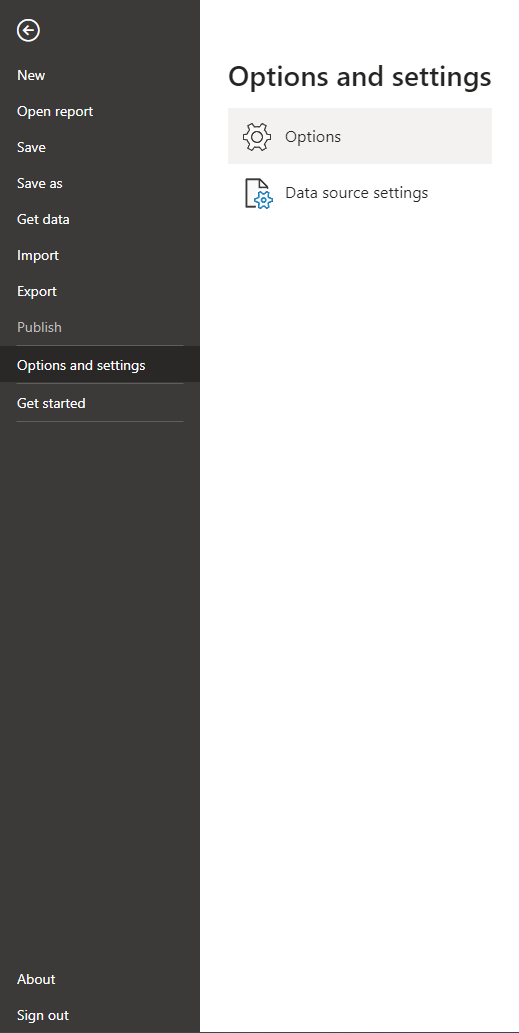
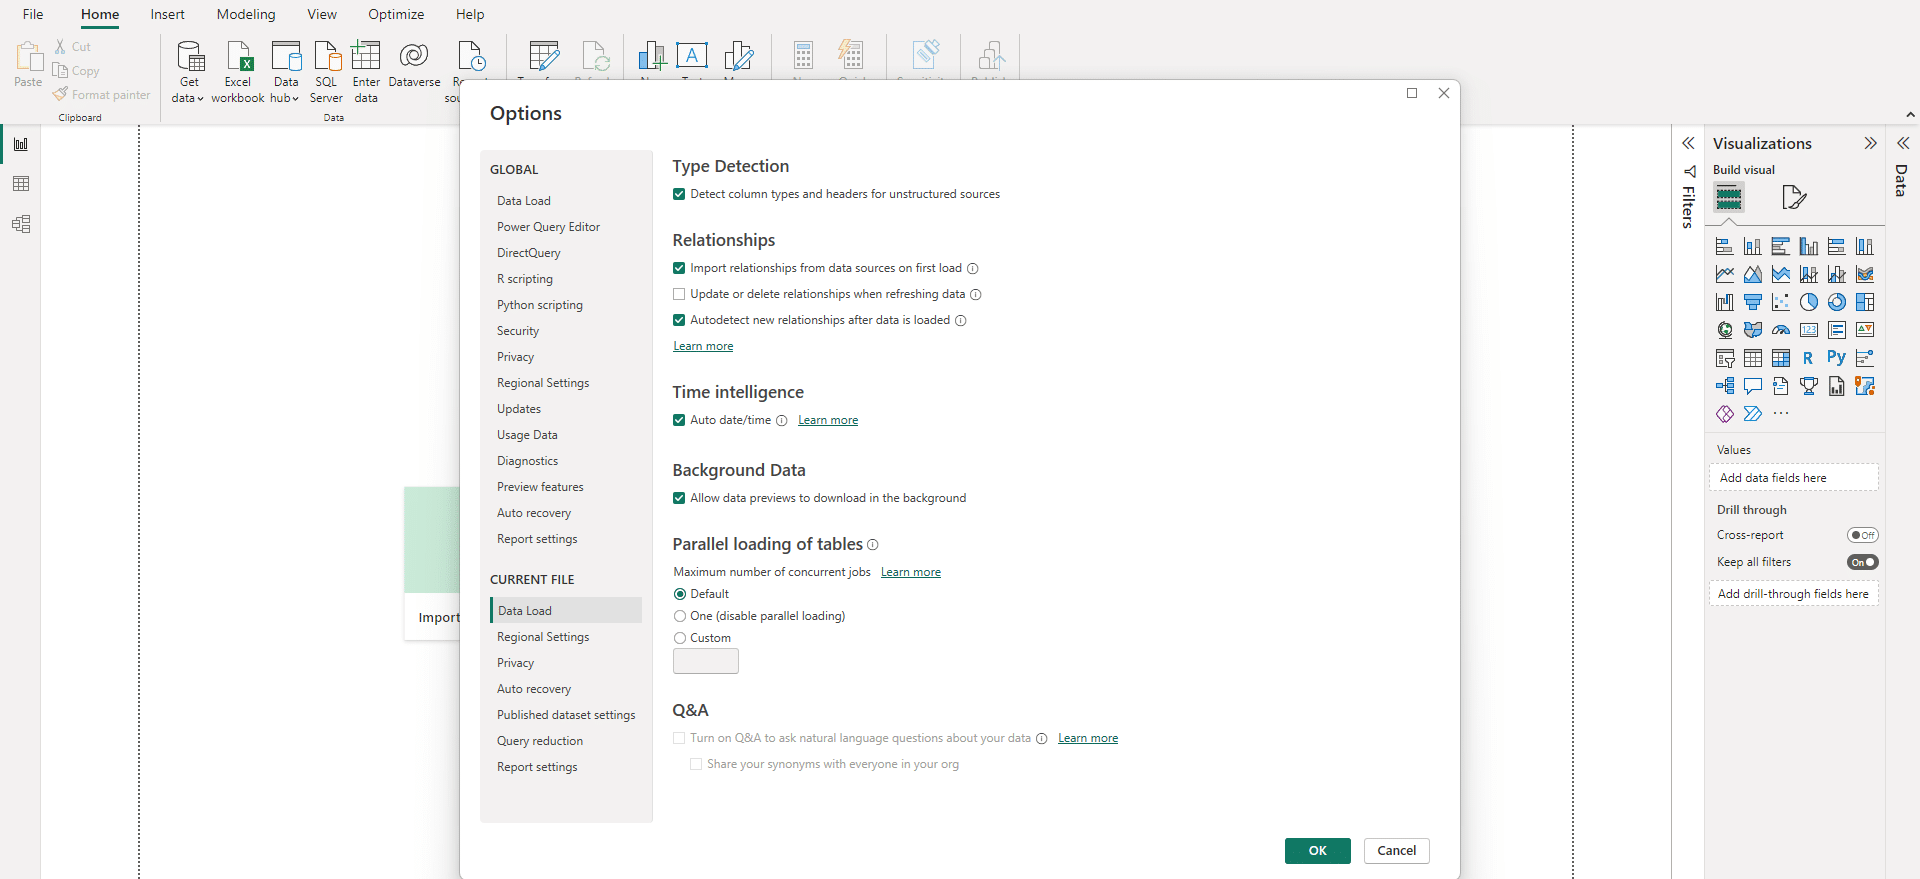
Enable disable auto date
Click on File and select Options and Settings from the menu. Then click on Options. From the Options pop-up, you will want to click on Data Load from the Current File menu. Under Time Intelligence check/uncheck the power bi date table/Time box. This will enable/disable the auto date/time feature.

Let’s consider a straightforward example to illustrate the importance of maintaining consistency and ease of use across larger or standardized data models when dealing with time-based data. For a more in-depth understanding, you can refer to our previous article on building a comprehensive Power BI dashboard tutorial here.
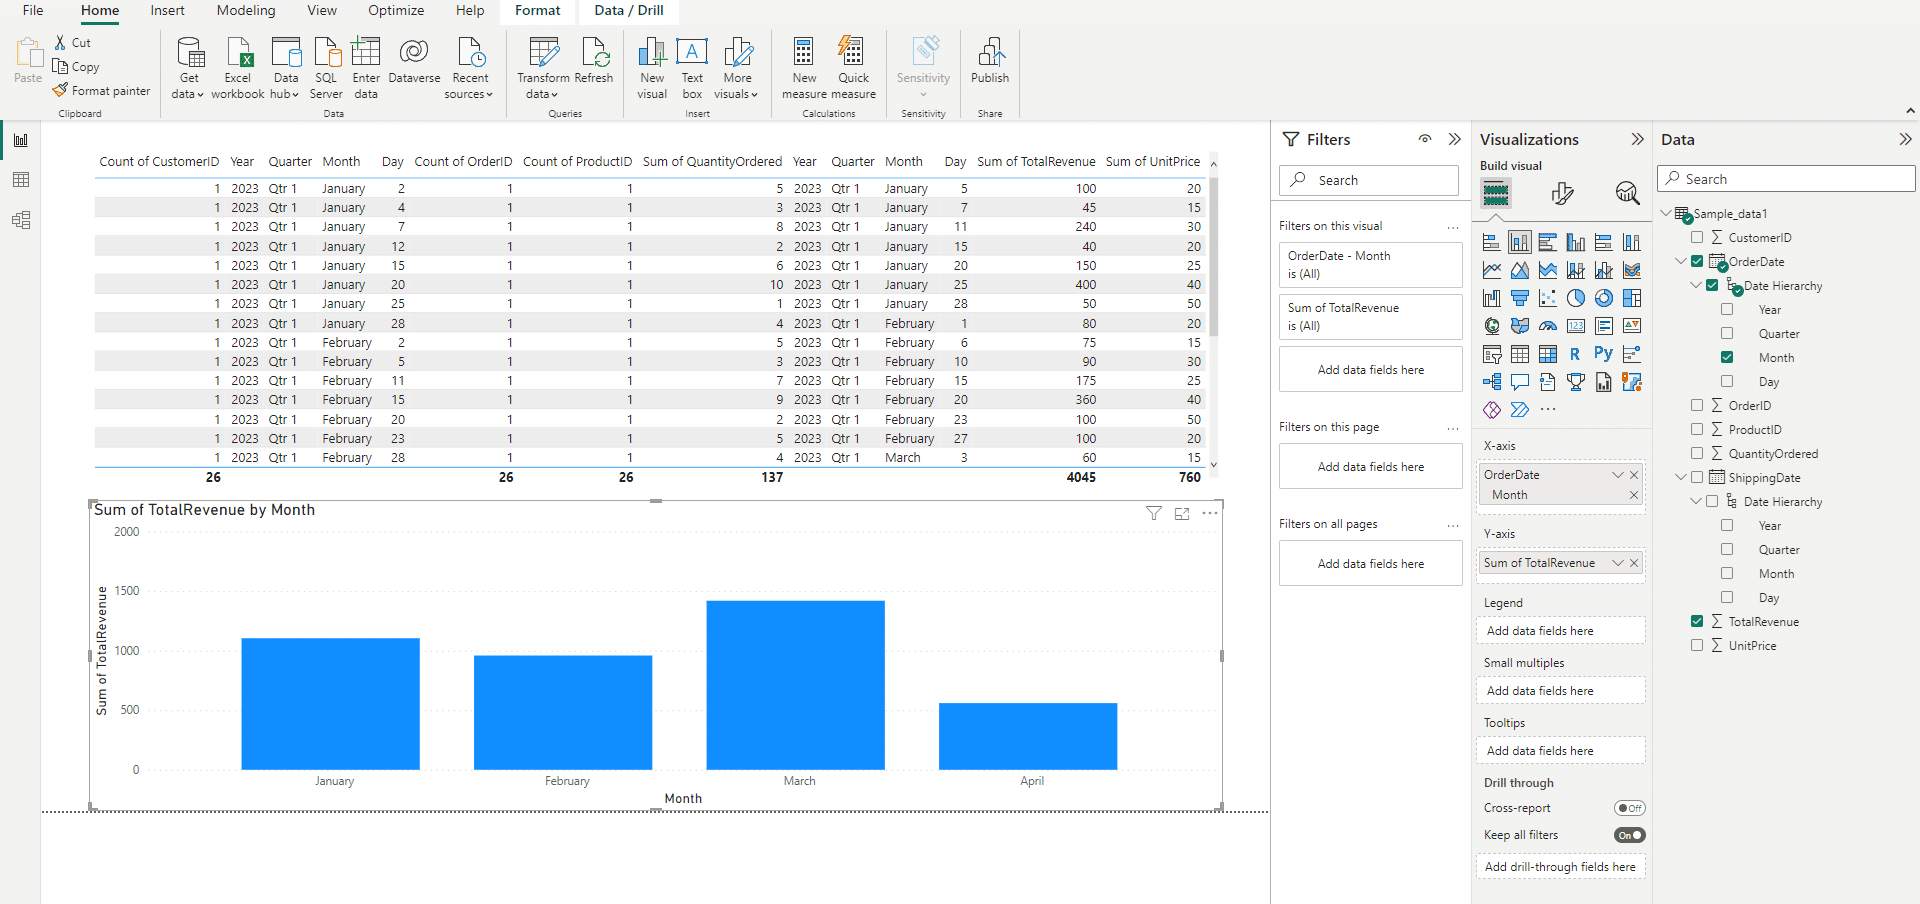
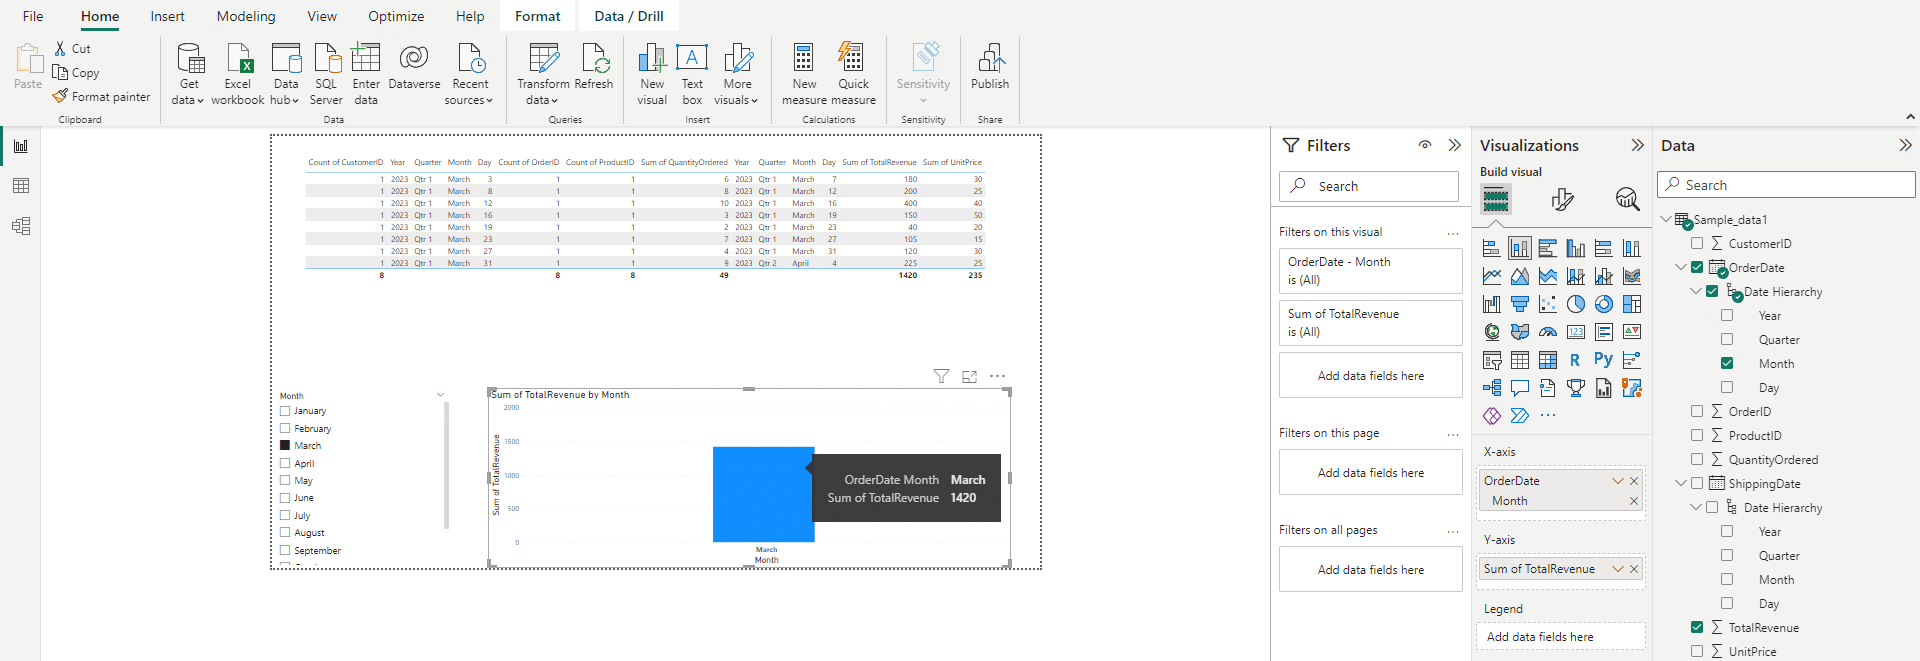
In the following example, we have a dataset with existing date table order dates and ship dates. The histogram plot below shows the Sum of Total Revenue vs Order Date month.
The built-in auto date-time feature in Power BI creates default hierarchies for each existing date table, which is useful for getting started quickly but can become problematic when dealing with multiple date columns with different hierarchies. You can observe these hierarchies displayed on the far right side of the Power BI desktop interface, as shown above.
When you want to compare data based on a different date column, such as ship date, the auto-generated hierarchies can become problematic.
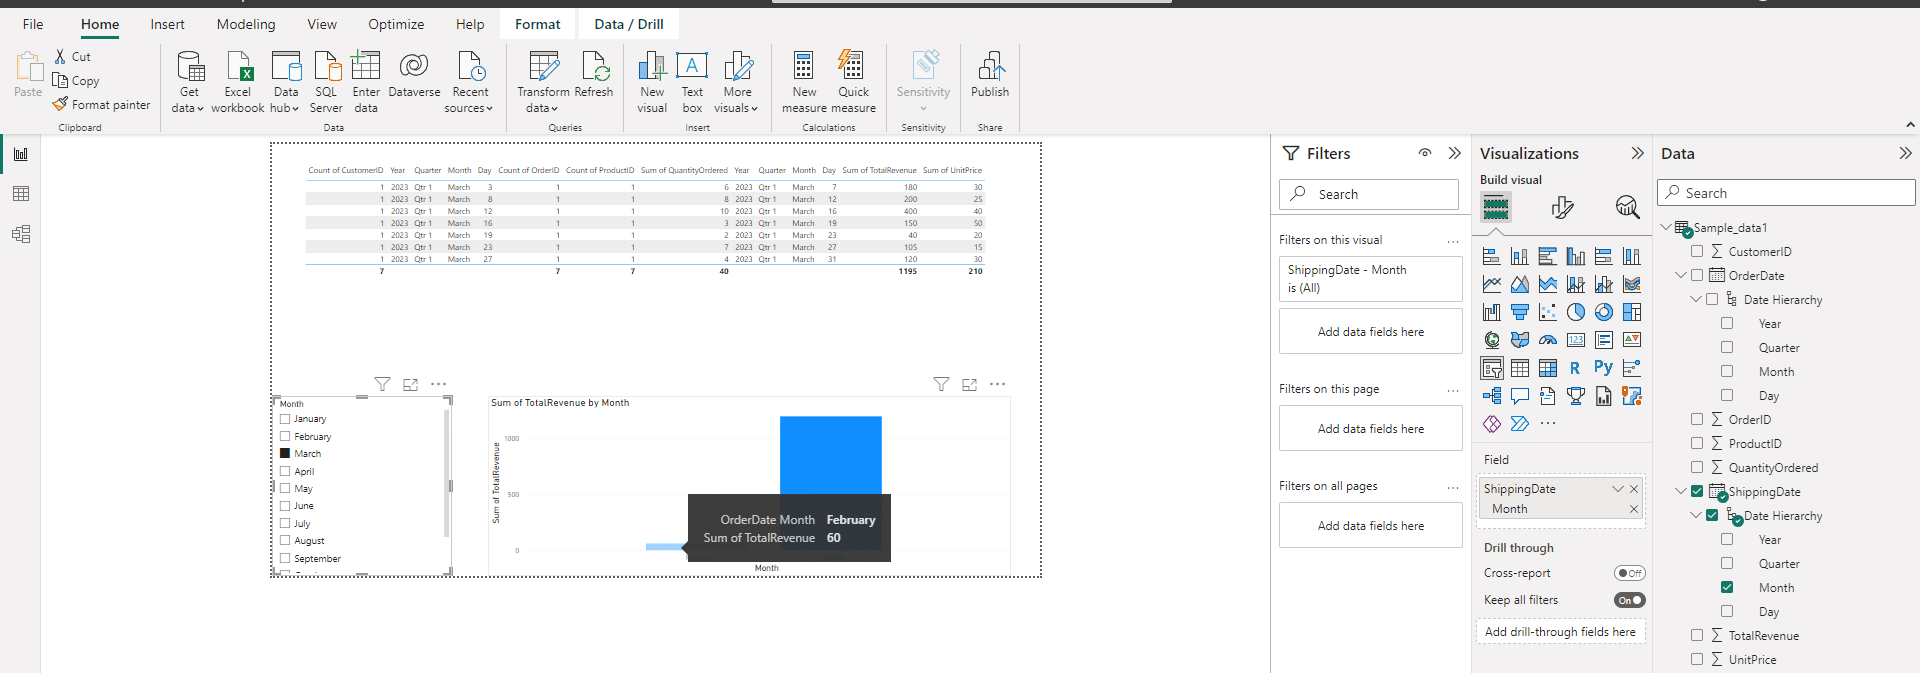
In the same dashboard, when we generate a month column slicer utilizing the Order Date and select a specific month, we obtain the expected plot result. However, when employing the Shipping Date month, the plot displays bars for both February and March; which is inconsistent.
To resolve this issue, create a central calendar table that allows you to control relationships between date columns more effectively.
With a central calendar table, you can use DAX relationships to drive the slicing and dicing of your data, ensuring consistency and ease of use across your data model. Further on in this article, we will delve into a more detailed discussion of DAX.
Leveraging an Existing Global Power BI Date Table
If your organization has already established a global date table in the source data that aligns with business-specific requirements, such as fiscal periods and calendar year periods, it is highly advantageous to incorporate this table into your Power BI data model.
2 Ways to Create Date Tables in Power BI
One method involves using the built-in CALENDAR or CALENDARAUTO DAX functions, which generate a single-column table of dates. From there, you can extend your calculated table with additional columns to better support your specific filtering and grouping requirements.
Another approach is marking an existing table as a date dimension table within Power BI Desktop. This helps your model recognize the table as the primary source for date-based analysis, ensuring that time intelligence functions and other date-related features will work properly with your data.
1.Using DAX time intelligence capabilities
One way to create a basic date table is by using the Data Analysis Expressions (DAX) language. The process involves creating a calculated table that generates a range of dates using either the CALENDAR or CALENDARAUTO functions.
To begin, go to the Modeling tab in Power BI and click New Table.
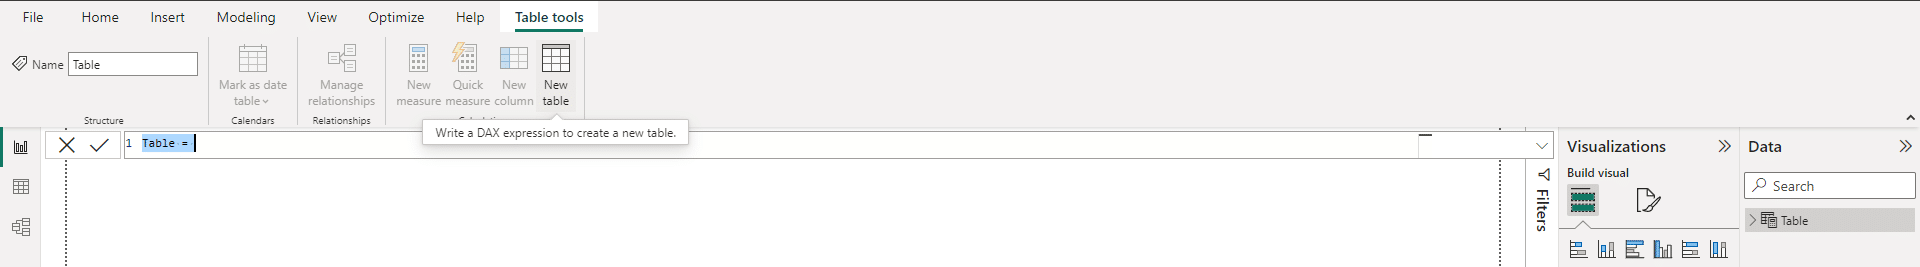
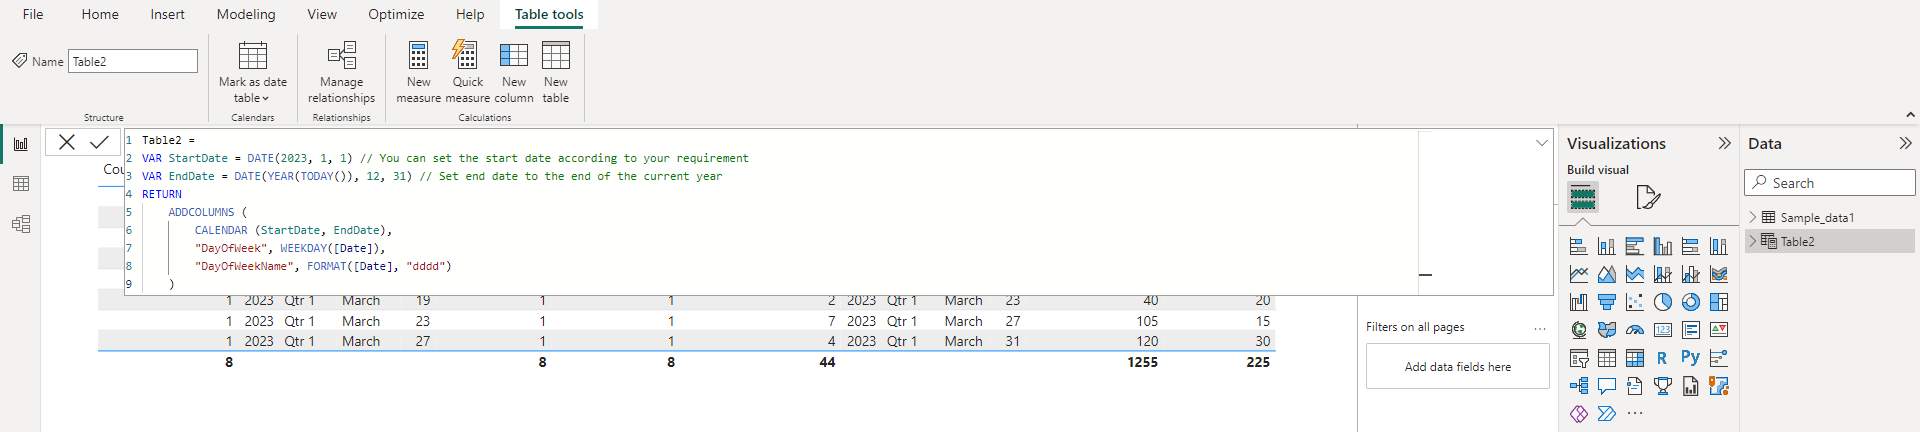
Name your new table “Date Table” and use the following DAX code snippet to define its date range:
DateTable =
VAR StartDate = DATE(2020, 1, 1) // You can set the start date according to your requirement
VAR EndDate = DATE(YEAR(TODAY()), 12, 31) // Set end date to the end of the current year
RETURN
    ADDCOLUMNS (
        CALENDAR (StartDate, EndDate),
        "DayOfWeek", WEEKDAY([Date]),
        "DayOfWeekName", FORMAT([Date], "dddd")
    )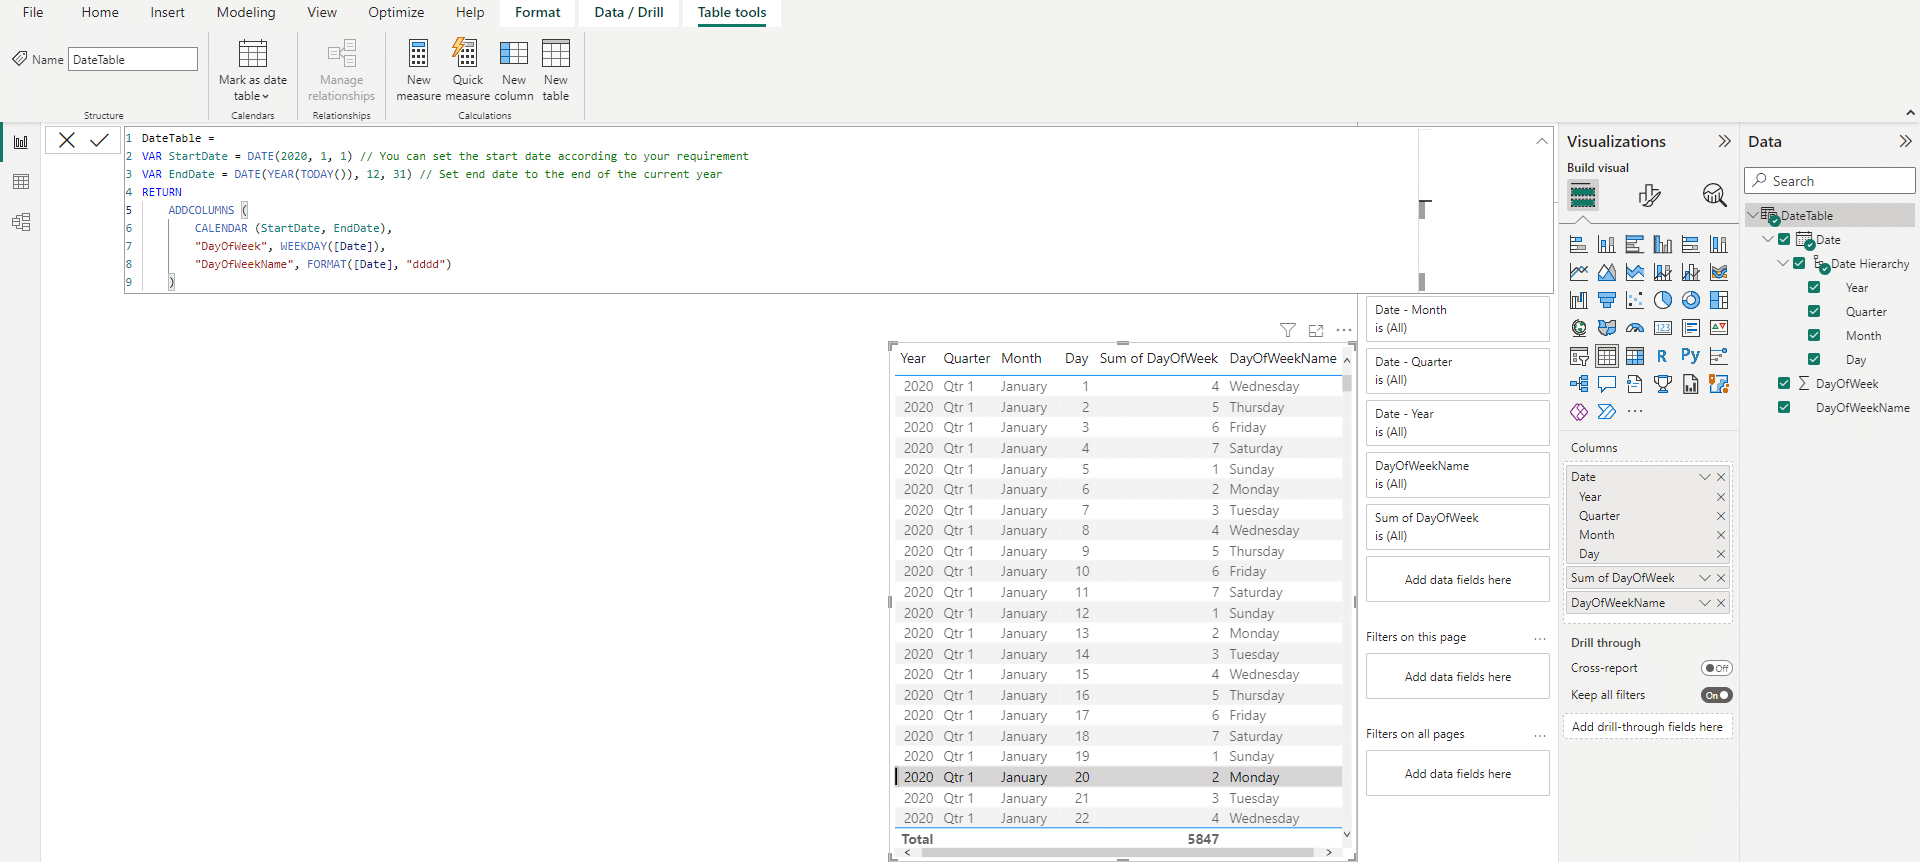
Replace STARTDate and ENDDate with the desired date range for your table and adds additional columns for “DayOfWeek” and “DayOfWeekName” to the date table. Note we are also using DAX expression to define your new column, formatting it according to your requirements. For example, create a “DayOfWeek” column: WEEKDAY([Date]).
You can then customize the table further by adding calculated columns to support any filtering or grouping requirements.

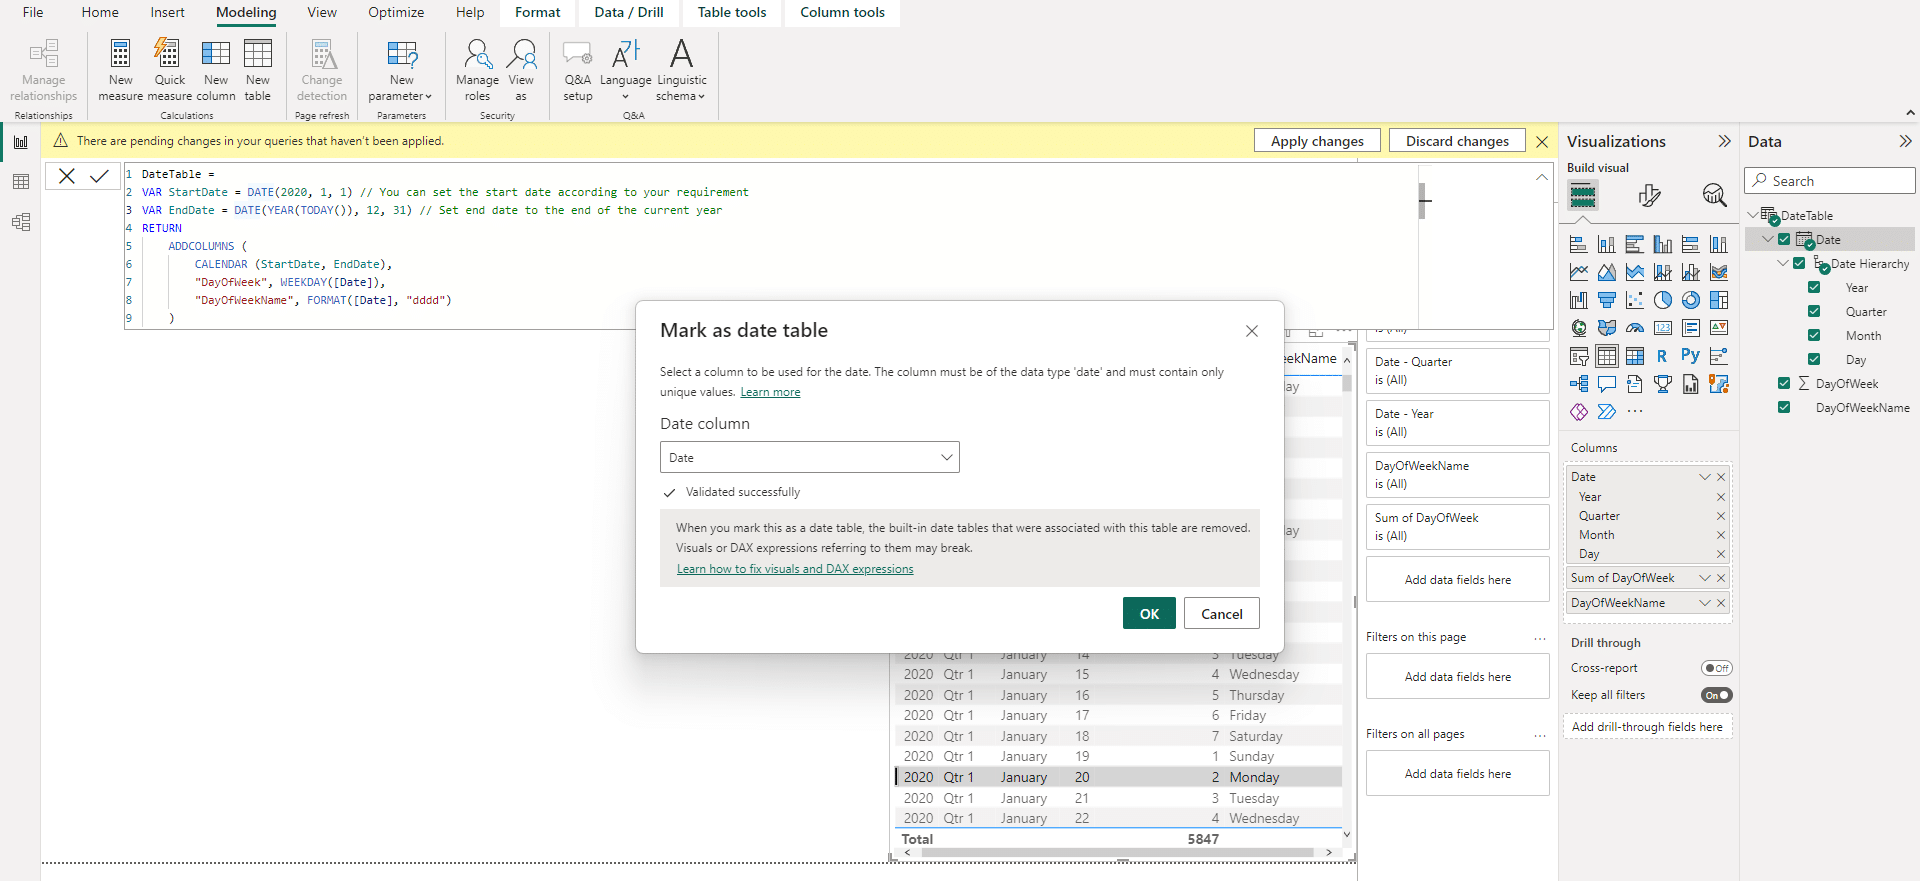
No matter which method you choose, remember to mark the table as a date table by right-clicking it in the Fields pane and selecting Mark as Date Table.
The CALENDARAUTO() function in Power BI simplifies the process of generating a date table, as it automatically calculates a contiguous set of dates based on the data in the model. By specifying the optional fiscal_year_end_month parameter, you can customize the fiscal year-end month, allowing for greater flexibility when working with different financial periods.
Assuming the MinDate in the data model is January 1, 2022, and the MaxDate is today (April 14, 2023).
CALENDARAUTO() will return all dates between January 1, 2022, and December 31, 2023.
CALENDARAUTO(6) will return all dates between July 1, 2021, and June 30, 2023.
2.Using Power Query editor
Alternatively, you can create a date table using Power Query, which provides a more visual approach. Follow these steps to begin:
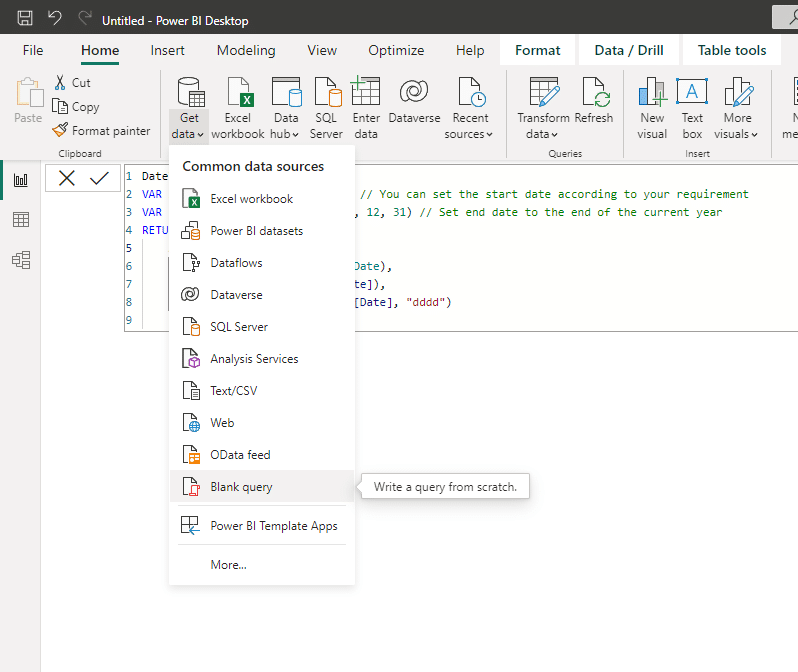
Choose “Blank Query” from the “Get Data” drop-down menu. This will open the Power Query Editor window where you’ll build the table.
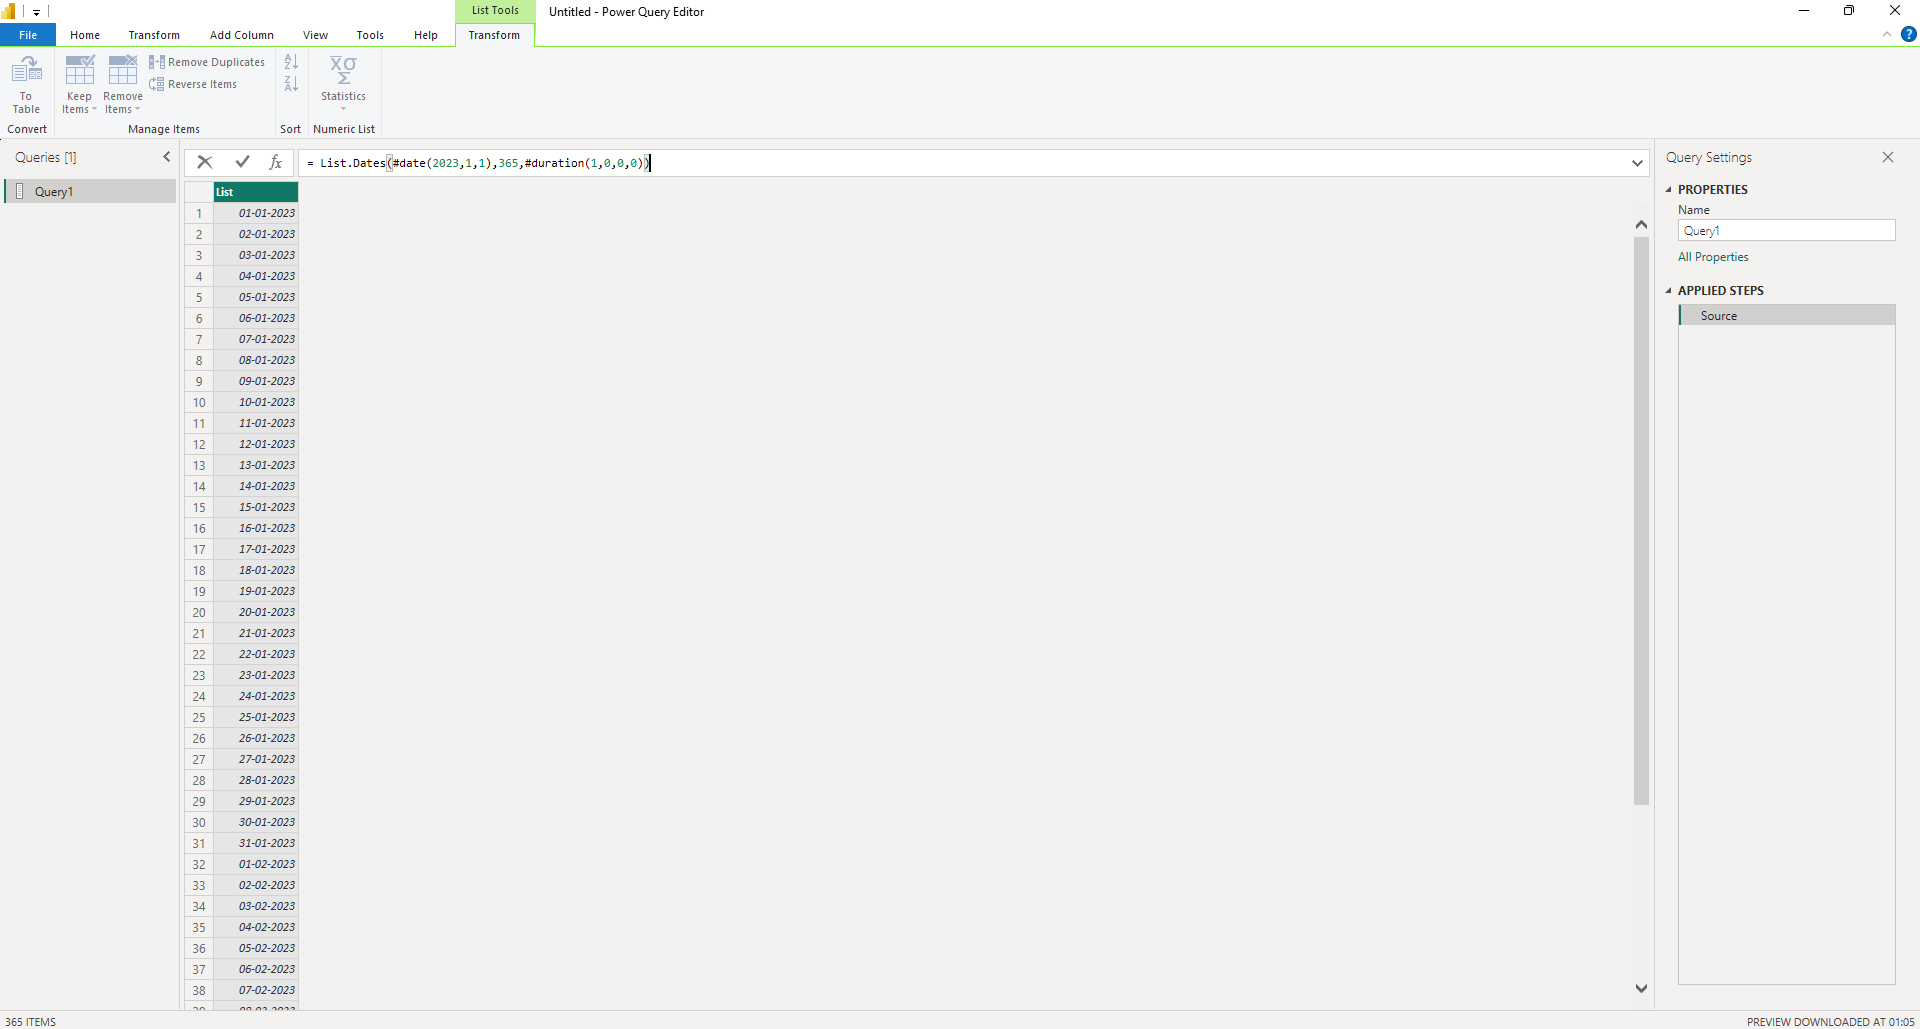
Use the formula bar to create a list of dates. In this example, we’re creating a 1-year table starting from 2022, but you can adjust the date value and count as needed. In the formula bar, enter the following:In the formula bar, enter the following:
=List.Dates(StartDate, Number.Days, #duration(1,0,0,0))
Replace StartDate with the desired start date for your table, and Number.Days with the total number of days you want the table to cover.
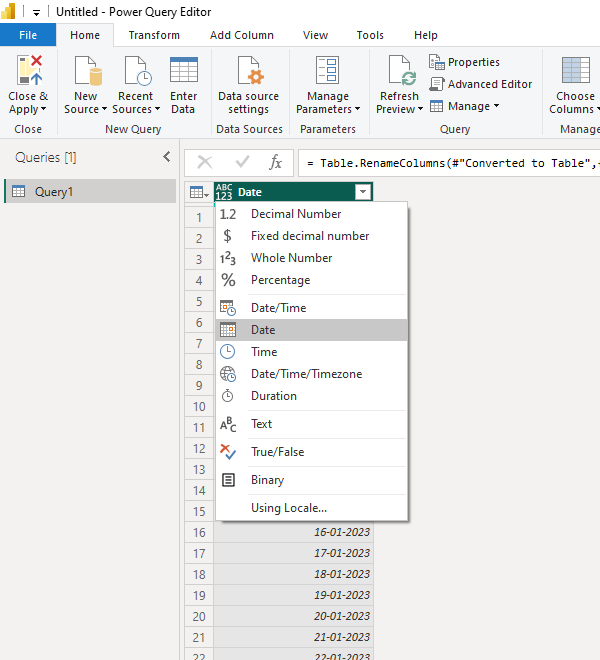
Convert the list to a table by clicking the “To Table” button in the Convert menu on the ribbon. In the following window, click “OK” without making any selections.
After converting the list to a table, rename the column “Date” and change the data type to a Date type using the data type button next to the column header.
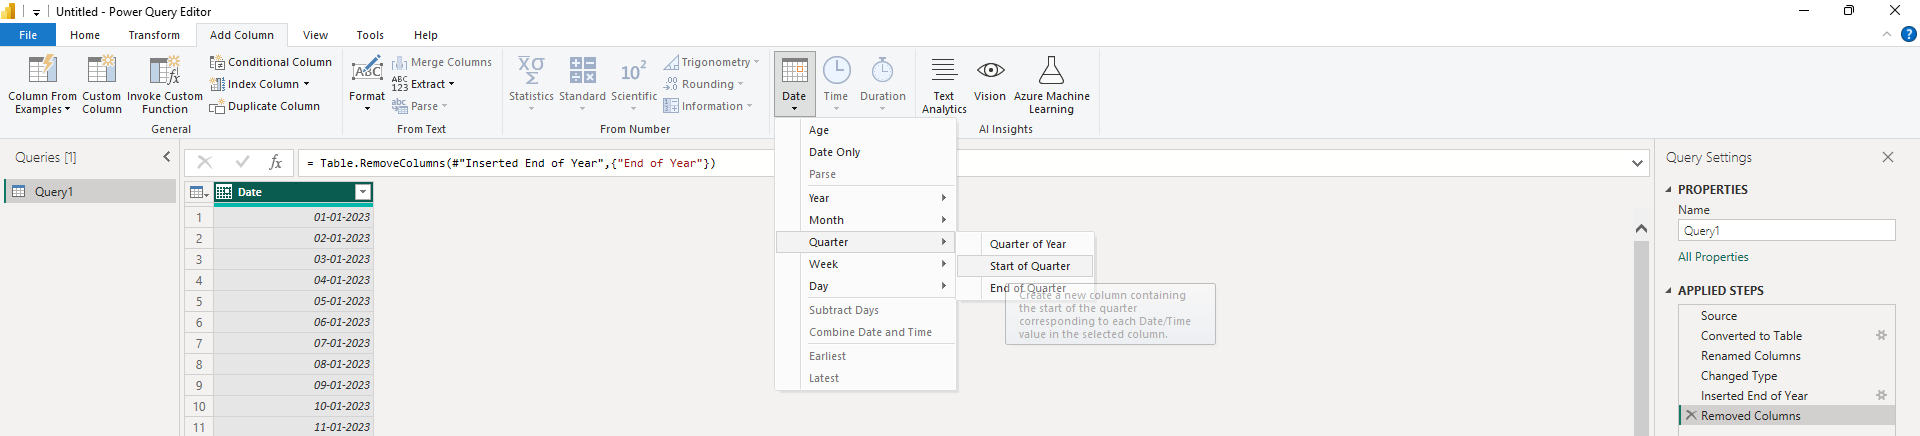
To complete the table, use the Add Column menu to select various date values from the Date drop-down, based on the Date Value column you just created.
Go to the Add Column section and access the Date drop-down menu.
With the Date Value column selected, choose any date-related column from the Date drop-down menu.
Connecting the Date Table to Other Tables
Once you have created your date table in Power BI, you must establish relationships with other relevant tables in your data model. This enables you to perform accurate time-based analysis and ensures that your filters and measures work correctly across different tables that contain date columns.
Follow these steps to create relationships between the date table and other tables in your data model:
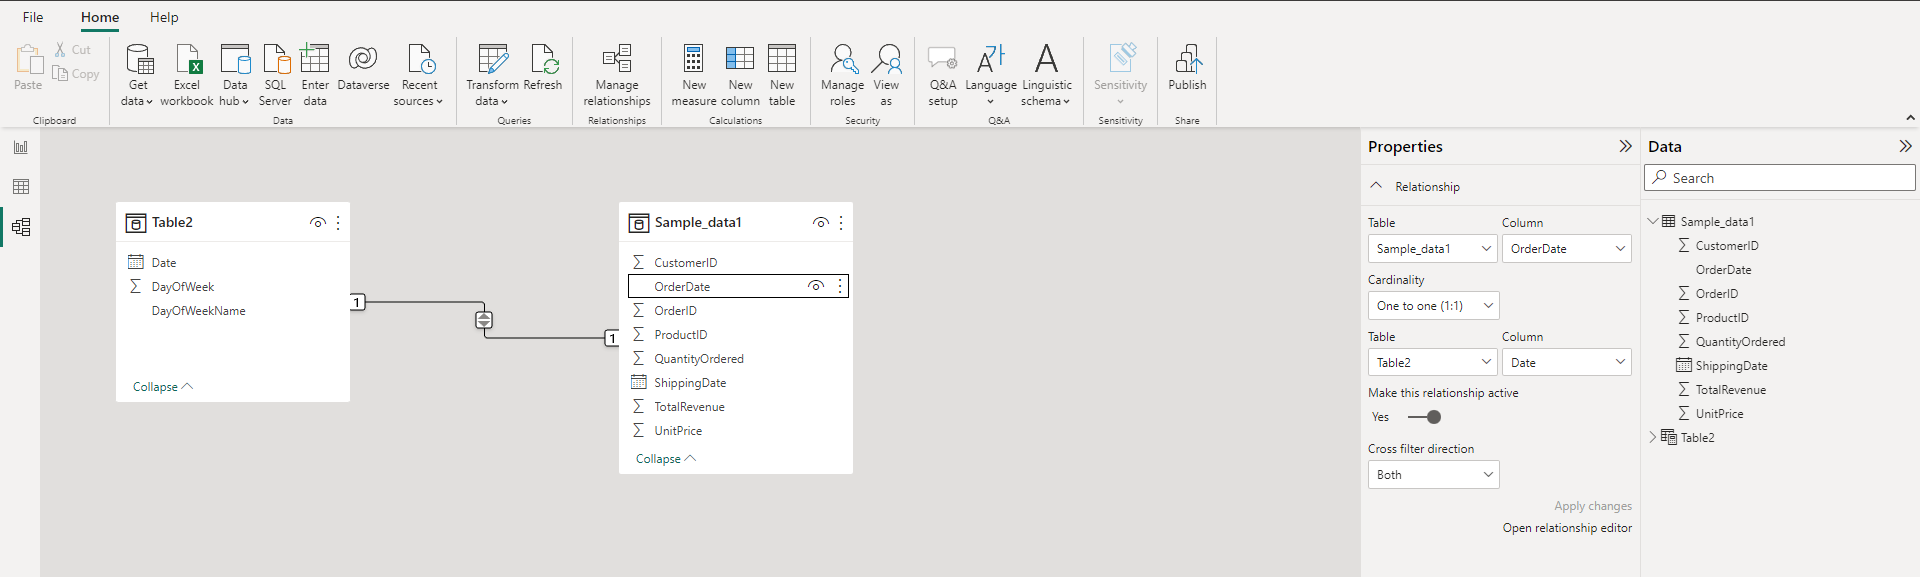
We are mixing the two examples which we discussed earlier ie. we are adding Table2 (from the DAX example) in our original order and shipping dataset. Next, click on the ‘Model’ tab under the Visualization pane to display the Data view.

Identify the tables with date columns that need to be connected to the date table. You will create relationships in a one-to-many (1:M) format between the date table and each of these tables.
Click and hold on to the date column in the date table, then drag the cursor to the respective date column in the related table. A line will be drawn between the two columns, indicating the establishment of a relationship.
Repeat the process for all other tables with date columns that require a connection to your date table.
Once all relationships have been established, review them by clicking on the ‘Manage relationships‘ button in the Home tab. Here, you can edit or delete relationships as needed, ensuring that your date table is accurately connected to the relevant tables.
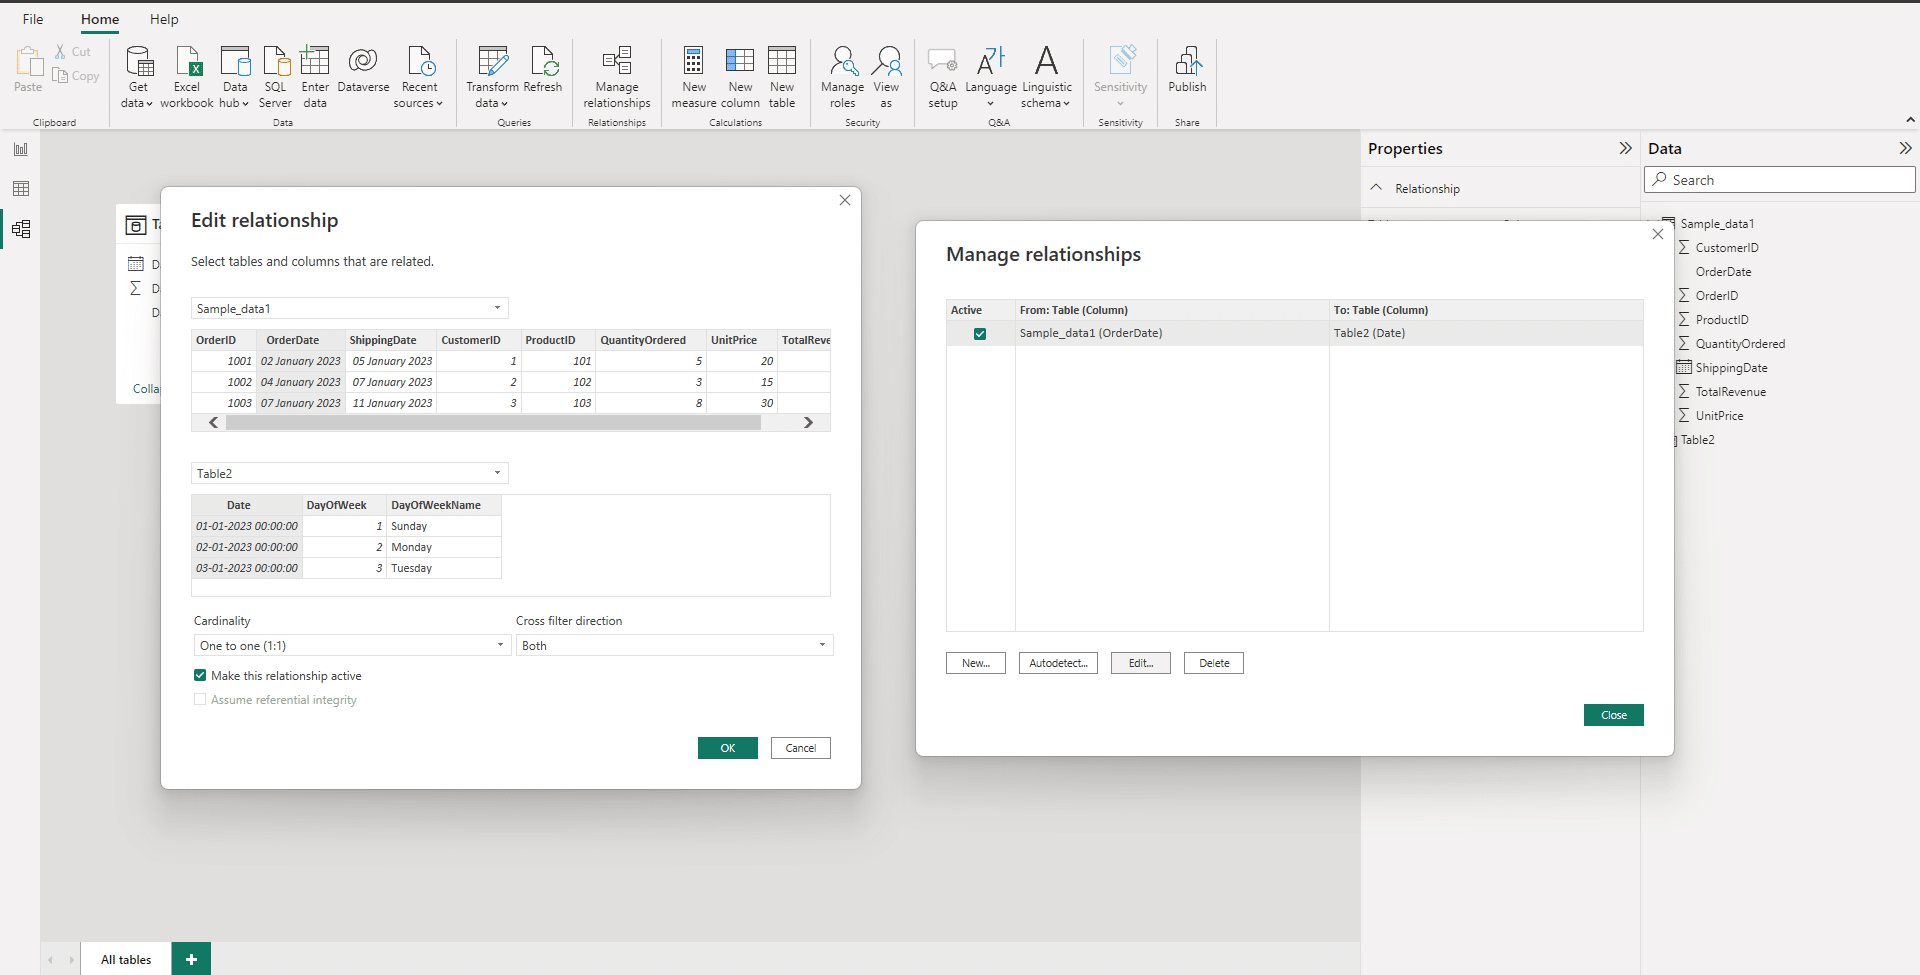
Keep in mind that when connecting a date table to multiple date fields within the same table, you might need to create duplicate date tables or use a bridge table approach, depending on the structure of your data model.
Best Practices and Tips
When creating a date table in Power BI, it’s essential to follow best practices and consider useful tips to ensure your date table is efficient and effective. Below are some points to keep in mind:
1. Use CALENDAR or CALENDARAUTO DAX functions to generate a single-column table of dates. This will be the foundation of your date table.
2. After generating the date table, consider adding calculated columns to support interval filtering and grouping requirements. Commonly calculated columns include month, year, quarter, week number, and day of the week.

3. When establishing custom date hierarchies, ensure that the columns are sorted in the correct order, for example:
Ascending order for months and days, rather than alphabetical order.
Descending order for time periods like fiscal years, if necessary.
4. Utilize Mark as Date Table option, by right-clicking the table and selecting “Mark as date table” in the menu that appears. This helps Power BI understand that it’s working with dates and optimizes performance and functionality.
5. Keep the date table as simple as possible. Although it’s tempting to add numerous columns and calculations, remember that complexity can slow down your Power BI report’s performance. Focus on the essential columns that you truly need for your analysis and reporting.
By following these best practices and tips when creating a date table in Power BI, you will ensure that your table is accurate, efficient, and easy to work with, ultimately improving your reports and analyses.
Ready to be inspired by a collection of incredible Power BI reporting applications, check out the below video.
A Litte Recap
In this article, you have learned how to create a date table in Power BI. When working with date tables, always be mindful of the need to optimize them for speed and efficiency. Efficient date table implementation can be critical in delivering accurate and timely insights for your analyses, especially those involving time-sensitive information.
Now that you have the knowledge and tools at your disposal to create a date table in Power BI, continue to practice and refine your skills. With experience, you will be able to customize your date tables to meet the unique requirements of your business and data projects.


