You might have heard experts saying, “Your data should tell a story.” Tableau took that literally and developed a feature that lets you create a story.
Most data visualization tools have dashboards where you can combine all your graphs. But what if a story cannot be completely explained with the graphs on a single dashboard?
With Tableau Story, you can combine multiple graphs and dashboards to create a compelling story.

A tableau story is a powerful tool that helps you convey information through a sequence of visualizations. These stories are designed to tell a data narrative, provide context, and demonstrate how decisions relate to outcomes, making your case more compelling.
To create a Tableau story, click on the New Story Icon. You can then drag and drop visualizations and dashboards and give titles and descriptions to convey a story.
In this article, we’ll show you what a Tableau story is, its usage, and its applications. We will demonstrate how to create stories in Tableau and why this skill is essential to your data visualization success.
Let’s get into it!

What is a Tableau Story
A Tableau story is a sequence of visualizations that work together to convey information, providing context and narrative about the data being presented.
In Tableau, you can create stories to tell a data narrative. You can demonstrate how decisions relate to outcomes and make a compelling case.

Using Tableau stories has advantages over traditional presentation tools, such as PowerPoint. The dynamic nature of Tableau stories ensures that your visuals stay up-to-date with the latest data. It provides a more accurate and powerful tool to tell your data story.
How to Create a Tableau Story
To create a Tableau story, you start by arranging visualizations – which can be graphs, charts, or tables – in a sequence that logically connects them.
These visualizations are often created from a collection of sheets in a Tableau workbook called story points.
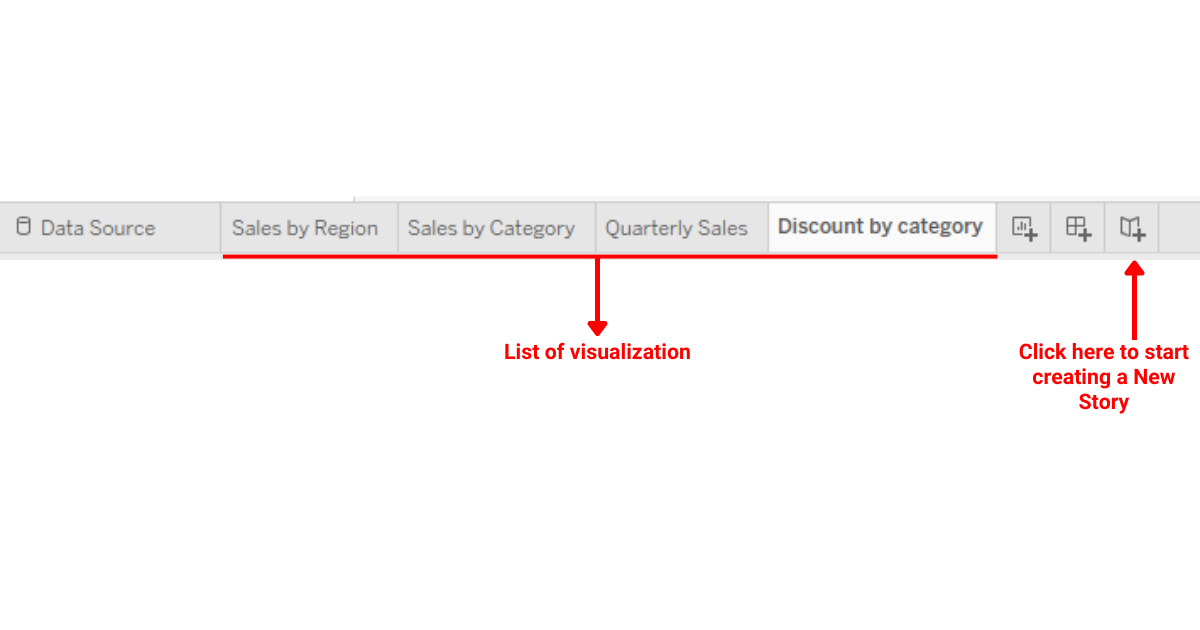
At the bottom of your screen, you will see the sheets you have created so far in Tableau. Right next to it, you will find an icon to create a new story.
You must click on the new story icon to start creating a story.
After clicking on the story icon, you will see the following window open up:
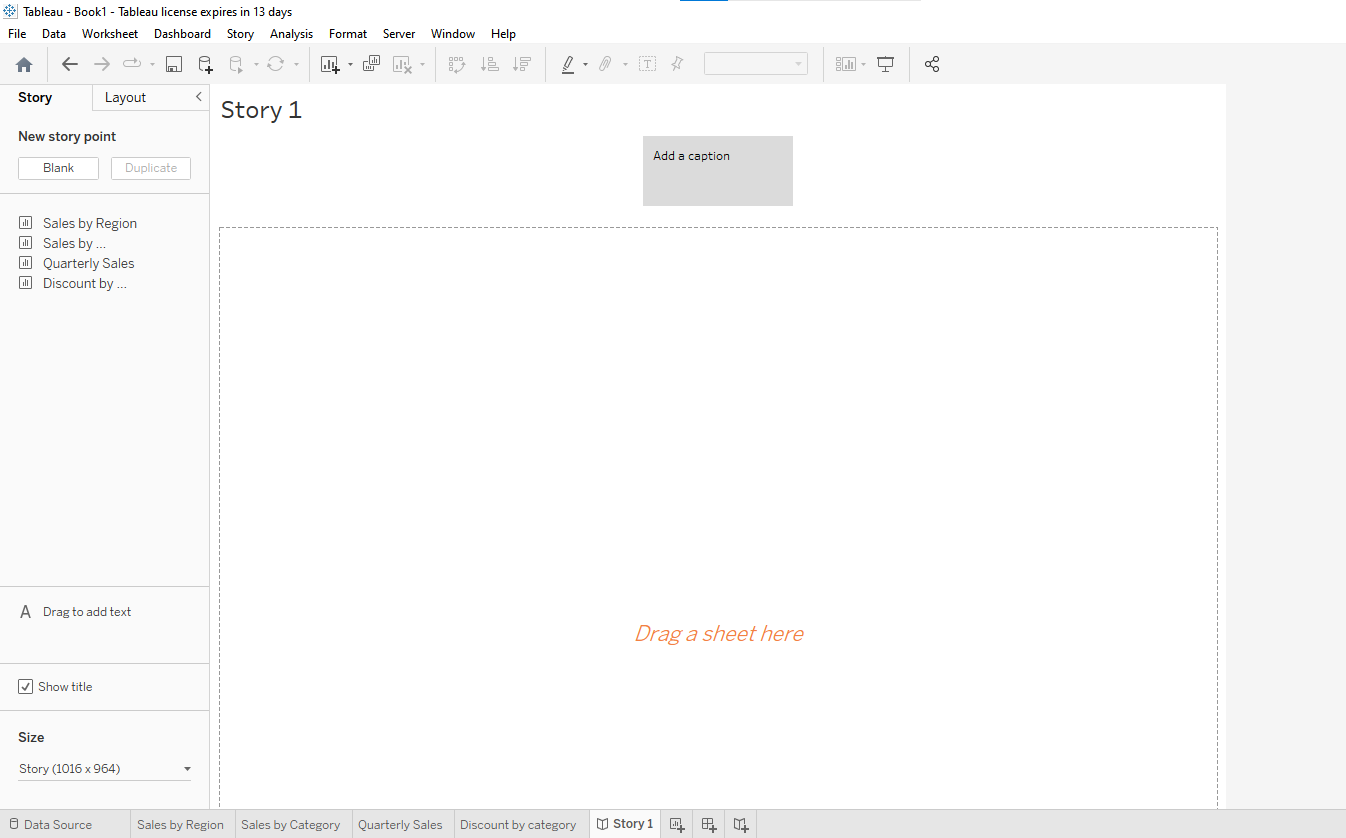
In this tab, you can drag and drop items to create a story, adjust their size and layout, and add text to points to tell a narrative.
What Are The Components of a Tableau Story
You must understand the following components of a Tableau story before creating one:
- Story Points
- Worksheets and Dashboards
- Text and Tiles

1) Story Points
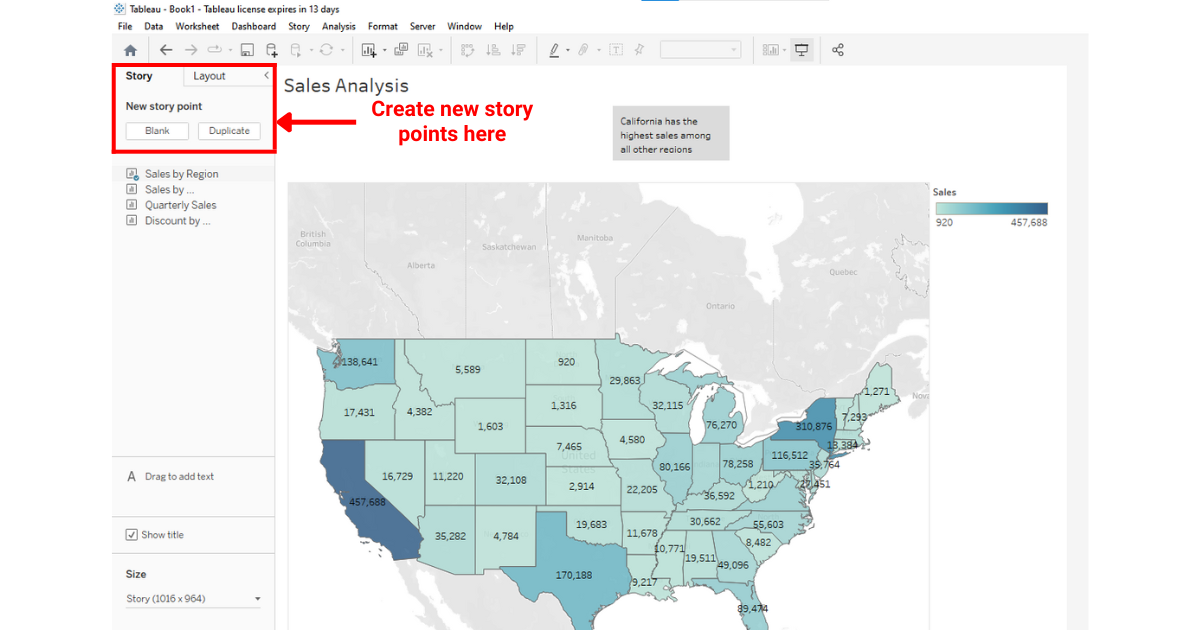
A Tableau story consists of several story points, each representing a step or a scene in your data narrative.
These points serve as guideposts for your audience as you walk them through your analysis.
You can use multiple sheets, dashboards, and filters to illustrate different aspects of your data story effectively.
At the top left of the screen, you will see an option to either create a new story point or duplicate an existing one.
2) Worksheets and Dashboards
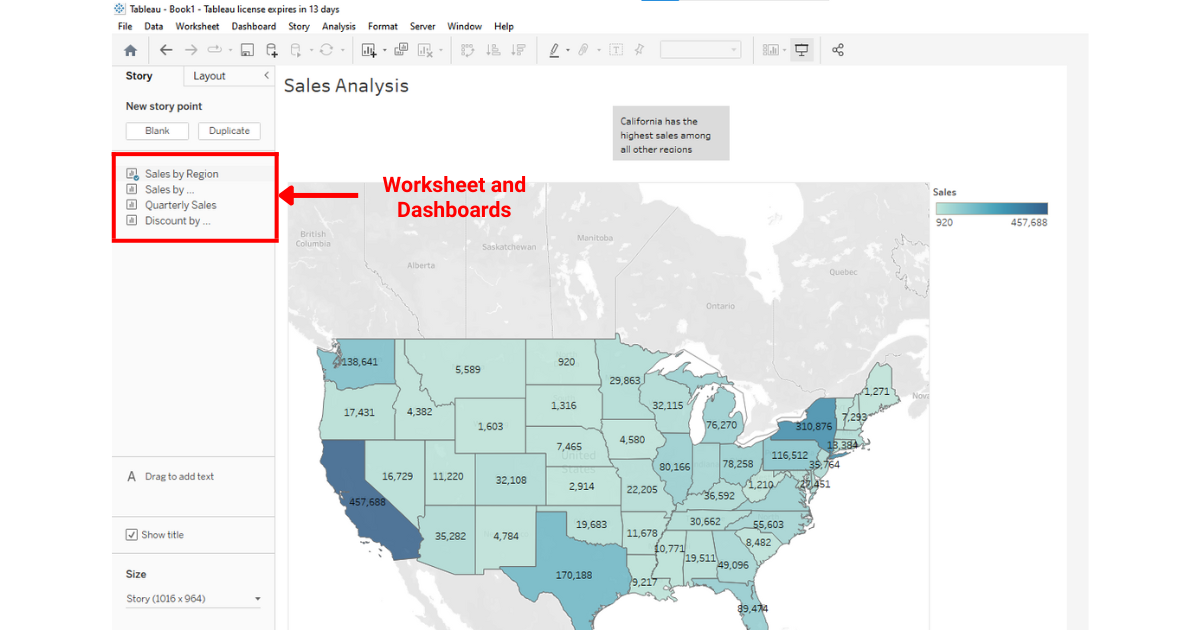
Worksheets are the building blocks of your Tableau story. They are individual visualizations of your data that you can combine and customize to suit your needs.
A dashboard, on the other hand, is a collection of worksheets that provide a complete picture of your data story.
At the top left of the screen, you will find all the worksheets and dashboards available to you for creating your story.

3) Text And Tiles
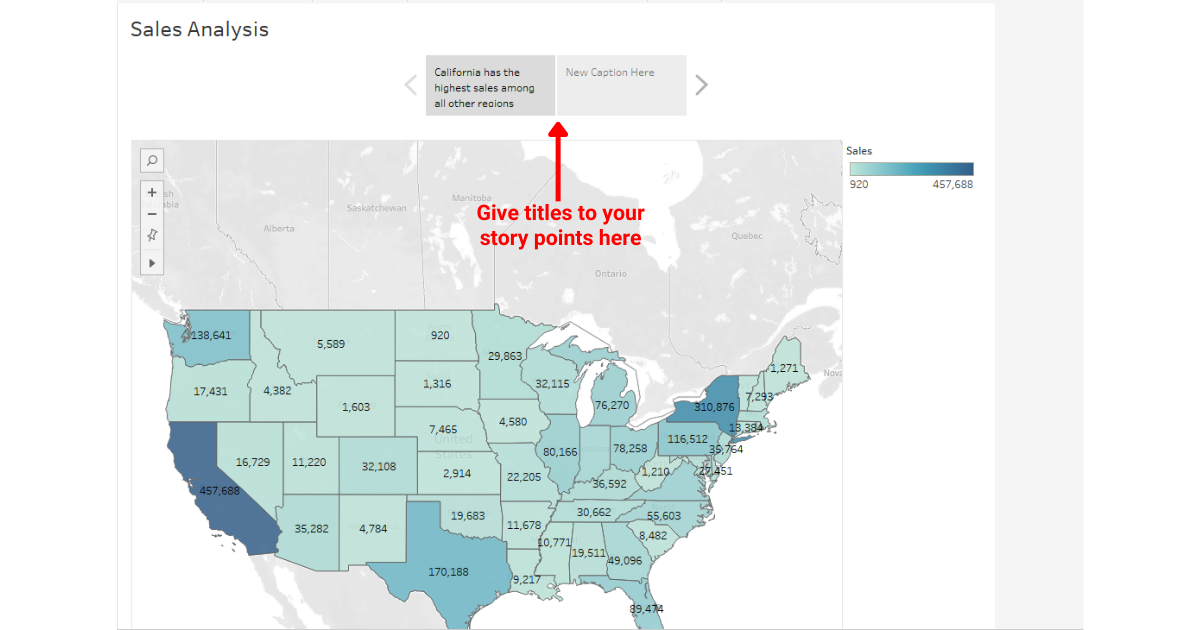
The text and story title in your Tableau story play a crucial role in conveying your message. Titles provide a brief overview of your visualization, while text annotations add context and clarity to your data.
You can give a title to your first story point in the box present at the top center of your screen. To give a title to your next story point, you can repeat the same process.
To draw attention to a specific point in a visualization, a Tableau story lets you add text to it.
To add text to your current story point, you can drag the text option to the left of your screen.
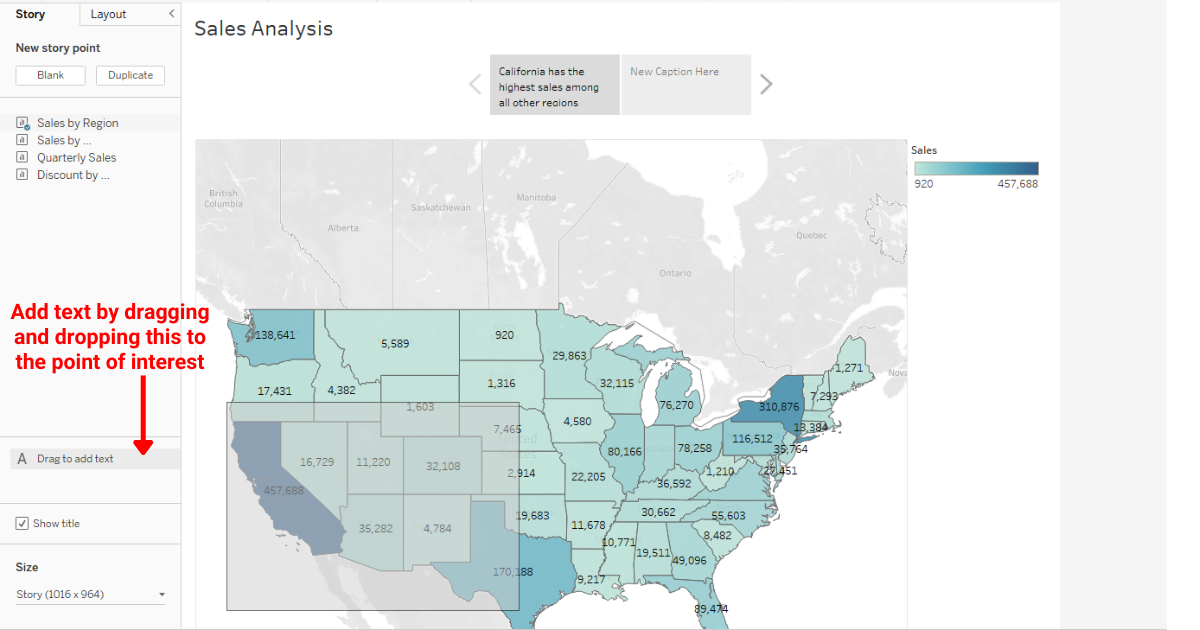
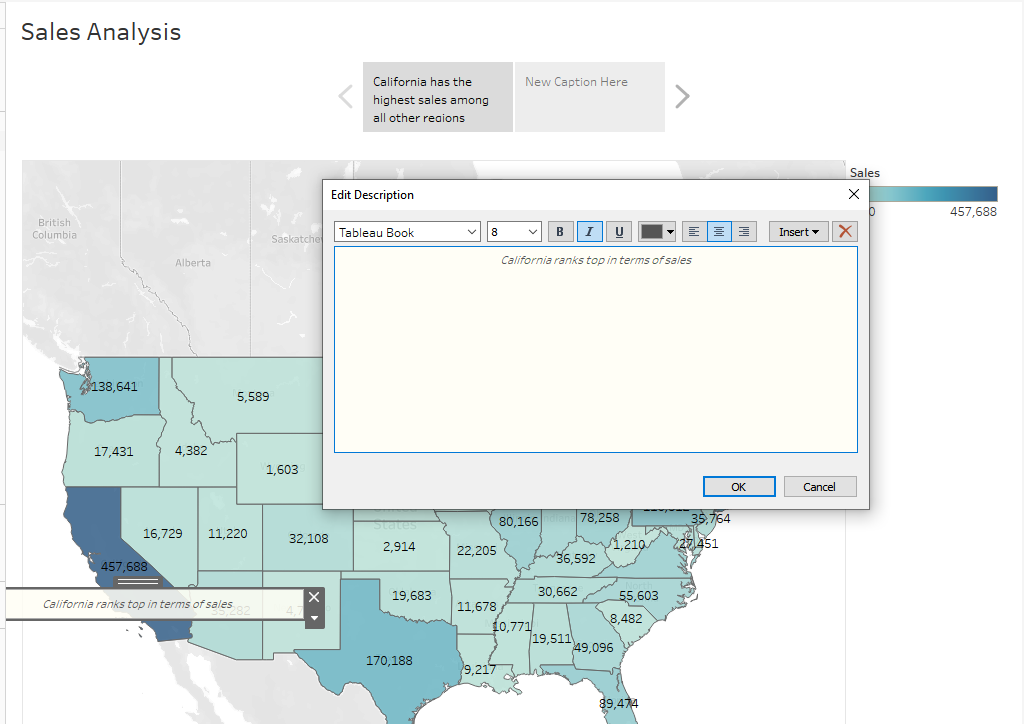
After dropping the text, you will see a story toolbar where you can add or edit your text.
You can create as many story points from your story sheet and dashboards as you’d like depending on your requirements.
How to Create a Compelling Tableau Story
In this section, we have listed some tips for creating a compelling Tableau Story.

1) Understand the Audience
To create an engaging Tableau story, you first need to understand your audience. Determine their level of familiarity with the topic, their interests, and the key messages you want to convey.
This understanding will help you tailor your story to effectively communicate your insights to your target audience.
2) Selection of Proper Data
Choosing the right data is essential for telling a compelling Tableau story. Consider the following when selecting your data:
- Relevance: Make sure the data is relevant to your audience and supports the narrative you want to convey.
- Accurate and reliable: Use only accurate, verified, and up-to-date sources to build credibility.
- Size and complexity: Choose an appropriate level of detail for your story, considering your audience’s expertise and the points you want to highlight.
3) Effective Use of Visualization
Visualizations help bring your data story to life by making information more accessible and appealing.
Use the following tips when creating visualizations in Tableau:
- Use appropriate chart types: Select the right chart type based on the data and message you want to convey.
- Keep it simple: Avoid visual clutter by focusing on the essential elements and stripping away anything that doesn’t contribute to your story.
- Use color strategically: Use color to draw attention to key elements, show relationships, or categorize data.
How to Publish a Tableau Story
After you are done creating a Tableau Story, it is now time to publish it.
You can publish your Tableau Story to various platforms such as Tableau Public, Tableau Server, or Tableau Cloud.
To publish your story to Tableau Public, you can click on Server, select Tableau Public, and then click on Save to Tableau Public.
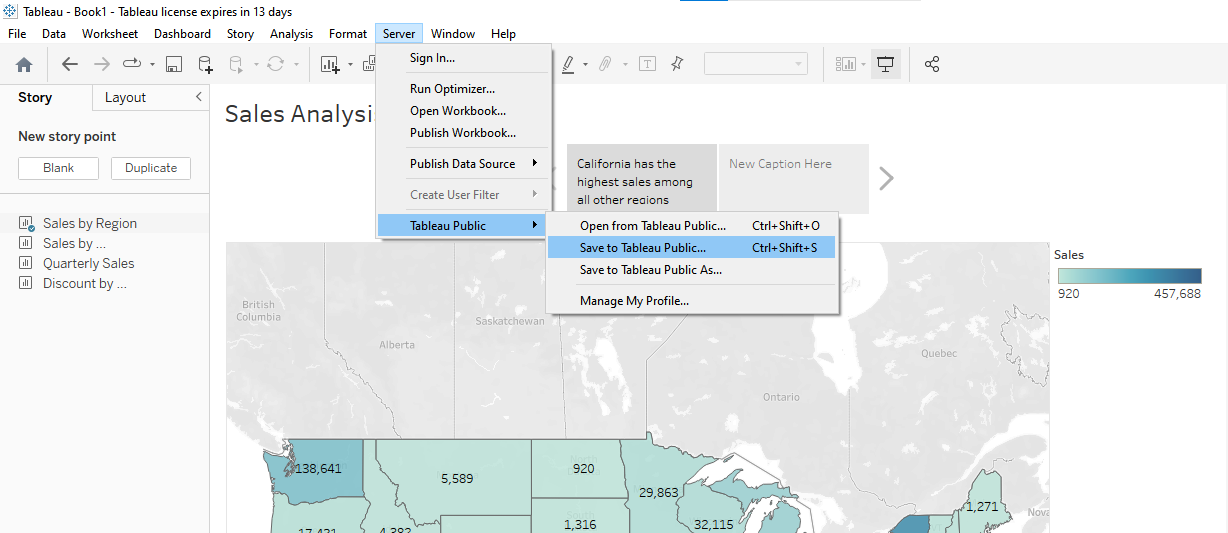
Tableau will generate a link for you to view your published story.
Final Thoughts
Wrapping up, think about how handy Tableau Story can be for you. Learning it lets you turn plain data into clear, interesting stories. This way, you’re not just showing numbers but helping people understand them.
Tableau stories let you get your point across effectively. This is helpful for making complicated topics easy to understand.
Diving into Tableau Story helps you share knowledge in a more convincing way. In a world full of data, being able to tell a story with it really makes a difference.
Learn to use Advanced Data Analytics from Open AI by watching the following video:

Frequently Asked Questions
In this section, you will find some questions you may have when creating Tableau stories.

How do you create a story in Tableau?
To create a story in Tableau, follow these steps:
- Open Tableau and connect to your data source.
- Create the views or dashboards you want to include in your story.
- Click on the “New Story” tab at the bottom of the screen.
- Drag and drop views or dashboards onto the story canvas.
- Add captions, annotations, or descriptions to each story point as needed.
- Adjust the size of your story using the options in the lower-left corner.
- Save your story and share it with your audience.
What are Tableau story points?
Story points in Tableau are individual frames or pages within a story. Each story point can contain a story worksheet, dashboard, or even just text.
The sequence of story points forms the narrative that you want to convey through your story, making it easier for your audience to understand and engage with your data.
What are some Tableau story best practices?
Here are a few best practices for creating effective Tableau stories:
- Start with a clear and focused narrative, using your data to support the entire story.
- Keep your points concise and relevant, focusing on key insights.
- Use visual cues, such as color and annotations, to guide your audience through the story.
- Leverage interactivity, such as filters and highlighting, to let your audience explore the data.
- Test your story on different devices and screen sizes to ensure optimal readability.
What is the difference between Tableau story and dashboard?
A Tableau story is a sequence of visualizations arranged in a narrative format, whereas a dashboard is a single page that displays multiple related visualizations together.
Tableau stories are helpful in guiding your audience through a data narrative, while dashboards provide an interactive way to explore data and examine relationships among different visualizations.
How do you use Tableau story templates?
Tableau story templates can be used to create a consistent look and feel across your stories. To use a story template, follow these steps:
- Download a Tableau story template from a site like Tableau Public or create your own.
- Open the template in Tableau Desktop.
- Replace placeholder views or dashboards with your own visualizations.
- Customize the text, colors, and formatting as needed.
- Save your story and share it with your audience.
Always ensure that your chosen template aligns with your brand guidelines and the narrative you want to convey.