Data pivoting in Tableau is crucial for anyone working with this powerful data visualization tool.
Tableau often favors row-wise arrangements rather than column-wise and knowing how to pivot your data from columns to rows will enable you to optimize your analysis and make your visualizations more meaningful.
To pivot data in Tableau, first load your data and navigate to the Data Source tab. Select the columns you want to pivot, right-click, and choose “Pivot”. This action will combine the selected columns into two new columns. You can also use the metadata window to pivot data in Tableau. Manipulating data within the canvas is also a handy method.

But wait, there’s more to this.
In this article, we’ll go over the specifics of data pivoting in Tableau. We’ll review 3 great methods with examples to help you better understand the concepts.
Let’s get into it!

3 Methods of Pivoting Data in Tableau
In this section, we’ll explore 3 methods of how you can pivot data in Tableau.
Specifically, we’ll go over the following:
- Using Table Preview Window
- Using Metadata Window
- Pivoting Within Worksheet

The data source we will be using for the demonstration looks like the following:

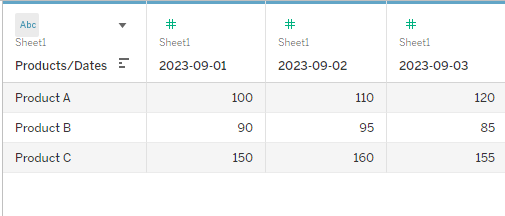
We have dates as the column names and product names as the measure values or row names.
1. How to Use Table Preview Window to Pivot Data
To use the table preview window in Tableau, follow the steps given below:
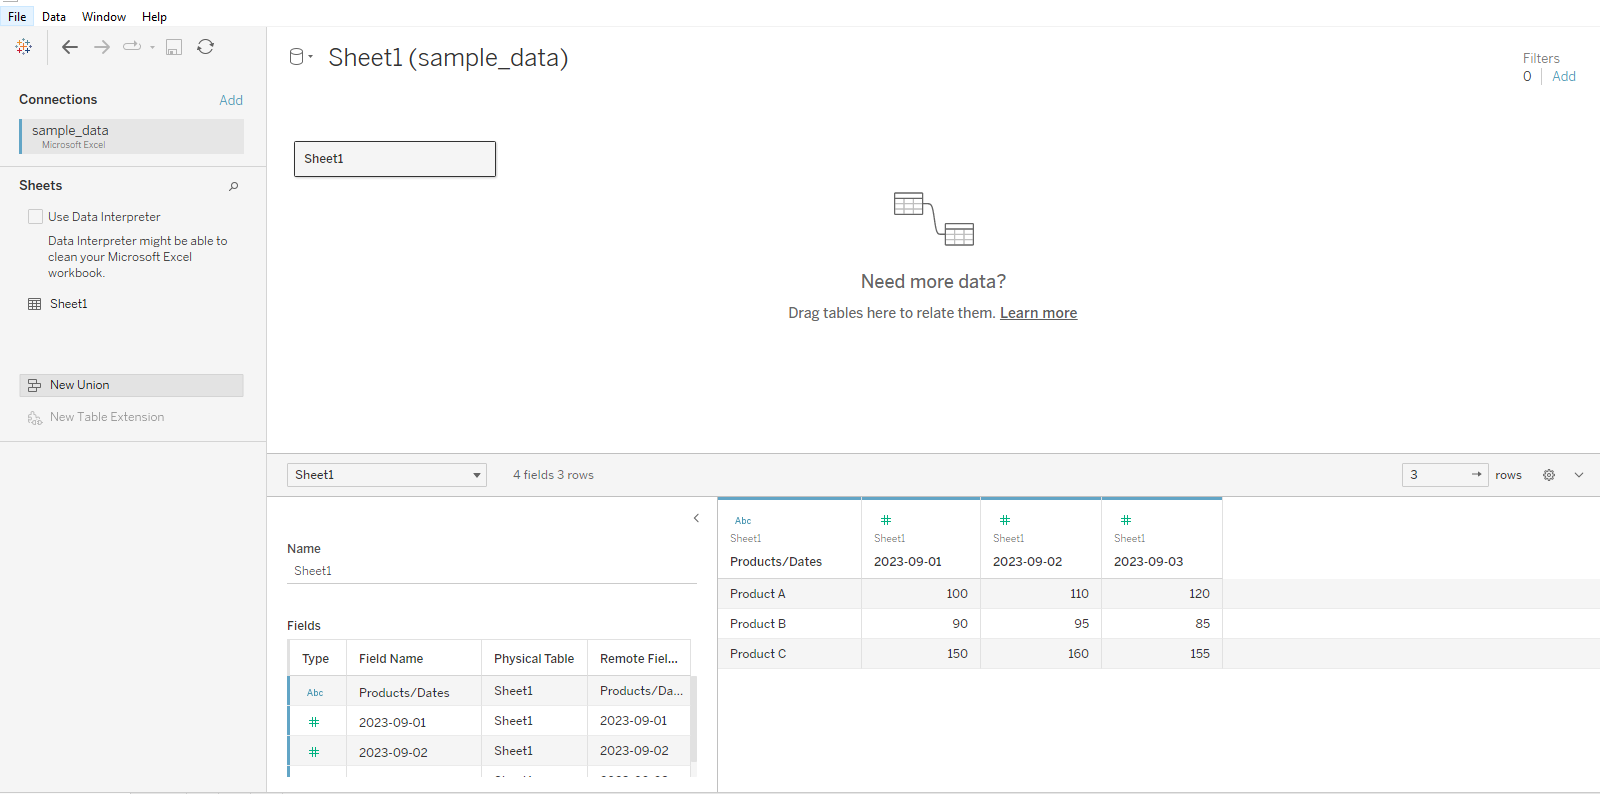
Step 1
Load in the dataset that you want to pivot.
After loading, you will see a screen like the following:
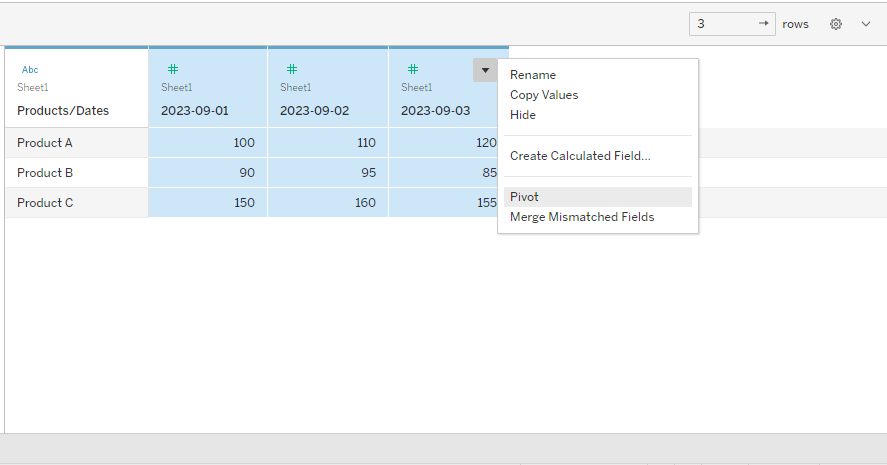
Step 2
In the table preview window, select pivot columns, right-click on the drop-down icon, and select Pivot.
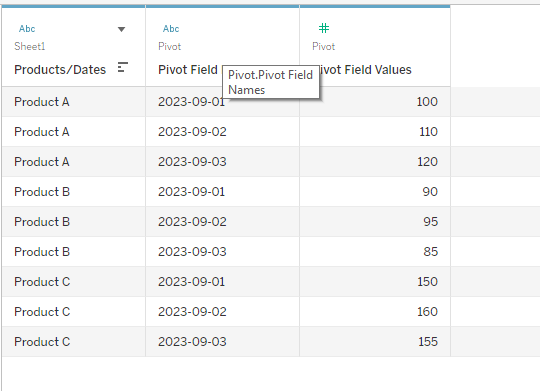
After performing the above pivot step, your data will look like the following:
Step 3
The next step is to change the column names of the pivoted data.
Double-click on the column name and change it accordingly.
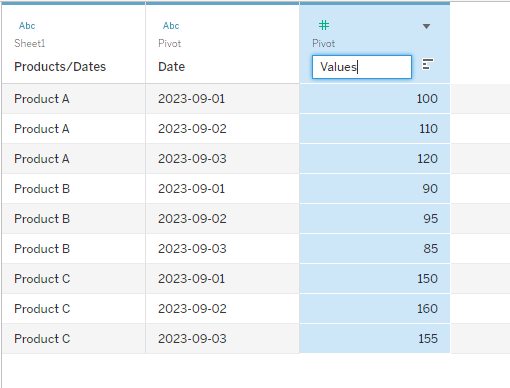
By following the above steps, you can easily pivot your data using Tableau.
2. How to Use Metadata Window to Pivot Data
Another method is using the metadata window. To pivot data using this method, follow the steps given below:
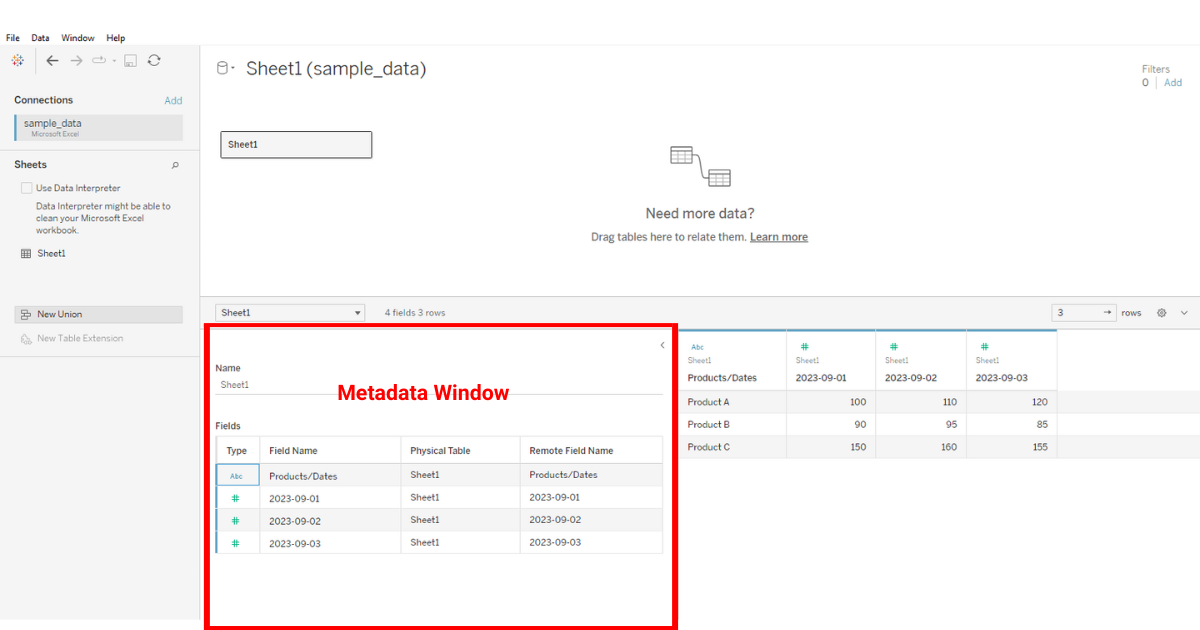
Step 1
Navigate to the metadata window found in the left-down area of Tableau.
Step 2
Select the column you want to pivot, right-click on the drop-down menu and click pivot.
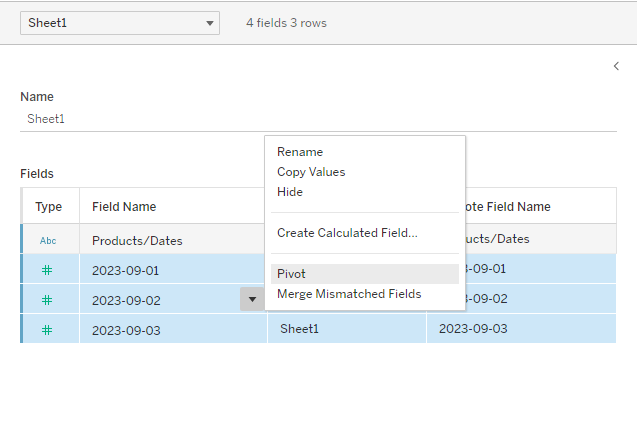
This will pivot the data in the table, which will look like the following:
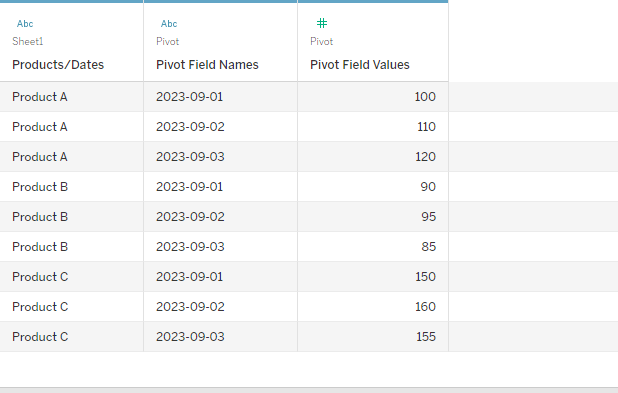
Step 3
Next, change the column names in the data table accordingly.
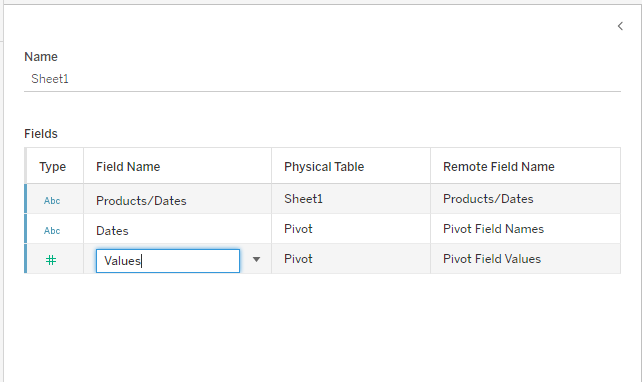
This will automatically rename pivoted fields.

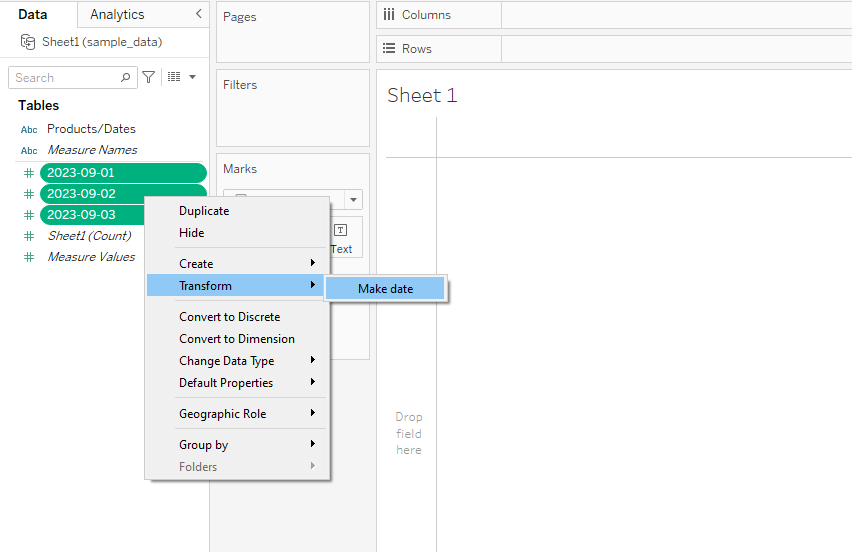
3. How to Pivot Data Within Worksheet
Tableau also allows you to pivot data within a worksheet.
To do so, open up a new sheet in Tableau. Select the columns you want to pivot, and click the drop-down icon.
Next, select either pivot or make data option depending on the options available to you.
This will pivot rows into columns and vice versa.
Learn more about the future of data tech by watching the following video:
Final Thoughts
Knowing how to pivot column and row data allows you to see your data from a fresh perspective. It’s a crucial skill to have as a data analyst, as the way your data is structured can make or break your analysis.
By learning to pivot, you’re not just reorienting columns and rows; you’re unlocking the potential for more profound insights.
Also, when you come across datasets that aren’t organized in a way that directly answers your questions, pivoting is your ally. It lets you reshape and fine-tune that data, positioning you to extract meaning more effectively.
Furthermore, in the evolving landscape of data analysis, adaptability is key. Being proficient in techniques like pivoting ensures that you’re ready to handle any data challenge thrown your way.
Frequently Asked Questions
In this section, you’ll find some frequently asked questions you may have when you want to pivot data in Tableau.

How can I create a pivot table in a Tableau dashboard?
To create a pivot table in a Tableau dashboard, first open your dataset in Tableau.
On the Data Source tab, select the columns you want to pivot by holding down the Ctrl key and selecting each one individually or by holding Shift.
Next, click the drop-down arrow next to the column name and select Pivot. You can also create a pivot table using the custom SQL query, however, it requires external specifications
What are the steps to transpose data in Tableau Desktop?
To transpose data in Tableau Desktop, follow these steps:
- Open your dataset in Tableau Desktop.
- Go to the Data Source tab.
- Select the columns you want to transpose by holding down the Ctrl key and clicking each one or by holding Shift.
- Click the drop-down arrow next to the column name and choose Pivot.
Your data will now be transposed, with columns converted into rows.
How can I perform a pivot operation in Tableau Prep?
In Tableau Prep, performing a pivot operation is quite straightforward. Here are the steps:
- Open your dataset in Tableau Prep.
- In the Flow pane, select the step where you want to perform the pivot operation.
- In the Profile pane, select the columns you’d like to pivot.
- Click the drop-down menu on one of the selected columns and choose Pivot Columns to Rows.
Your data will now be pivoted in Tableau Prep.
What’s the process to unpivot data using Tableau?
To unpivot data in Tableau, you’ll need to perform the reverse of the pivot operation. Follow these steps:
- Open your dataset in Tableau.
- Go to the Data Source tab.
- Select the columns you want to unpivot.
- Click the drop-down arrow next to the column name and choose Unpivot.
Your data will now be unpivoted with rows converted into columns.
How do I handle multiple columns in a Tableau pivot table?
Handling multiple columns in a Tableau pivot table is easy. Simply select all the columns you want to include in the pivot table by holding down the Ctrl or Shift key while clicking each column in the Data Source tab.

Once you’ve selected all the desired columns, click the drop-down arrow next to one of the column names and choose Pivot.
Can you provide guidance on drilling down in a Tableau pivot table?
To drill down in a Tableau pivot table, follow these steps:
- Ensure you have a hierarchy set up for the dimension you want to drill into.
- In the worksheet, right-click the dimension in the Rows or Columns shelf and select Show Drill Down.
- Click the plus sign (+) next to the dimension hierarchy to expand the next level.
You can now explore your data at a deeper level within the pivot table.