At the core of Tableau’s functionality lies a key distinction between two types of data fields: dimensions and measures. Understanding this distinction is crucial for you to get the most out of your data analysis and create meaningful visualizations.
Dimensions refer to qualitative, categorical data that are generally used to group, segment, or categorize data points. They provide context and help you analyze and understand the data by examining relationships and trends within specific categories.
On the other hand, measures are quantitative, numerical data that can be aggregated and analyzed. They represent the values or metrics that you want to visualize and examine, such as sales, revenue, or profit.

In this article, we’ll show you the characteristics of Tableau dimensions and measures. Read on to explore how both differ from each other.
Let’s get into it!

What Are Tableau Dimensions
Tableau dimensions are data fields that provide a qualitative or categorical context to your data. They act as the building blocks used to slice, filter, and segment data in ways that allow for more detailed insights.
Dimensions usually contain text, dates, and categorical information that help to organize and give meaning to the measures in your visualization.
When you connect to a data source, Tableau creates dimensions and measures automatically.
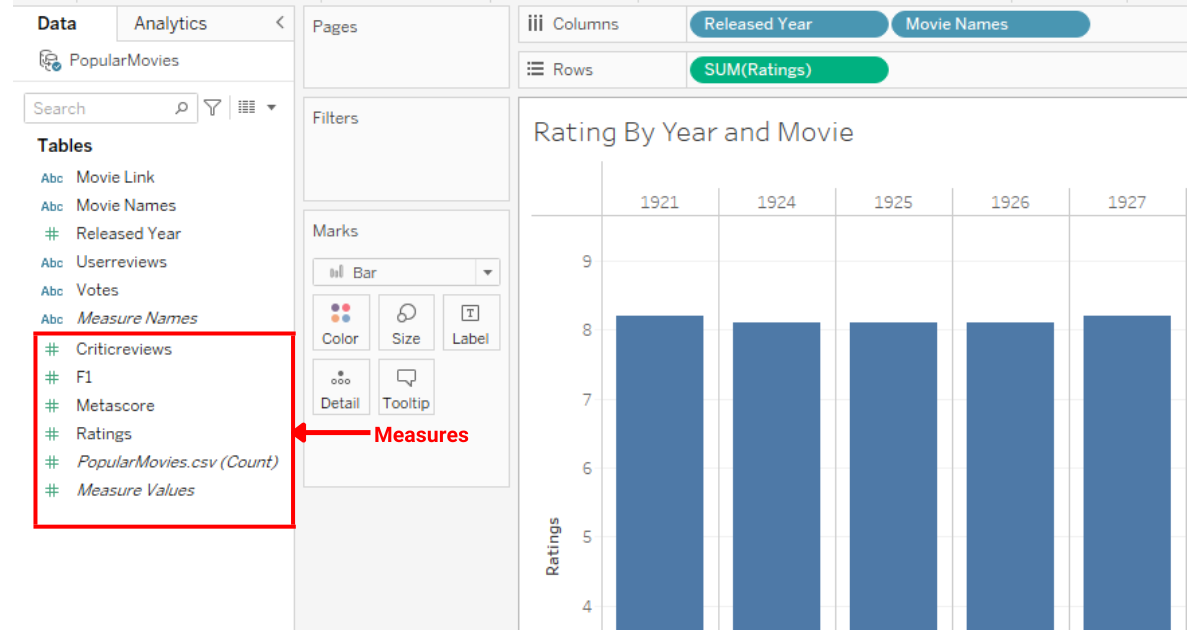
In the image below, the fields inside the red square are dimensions.

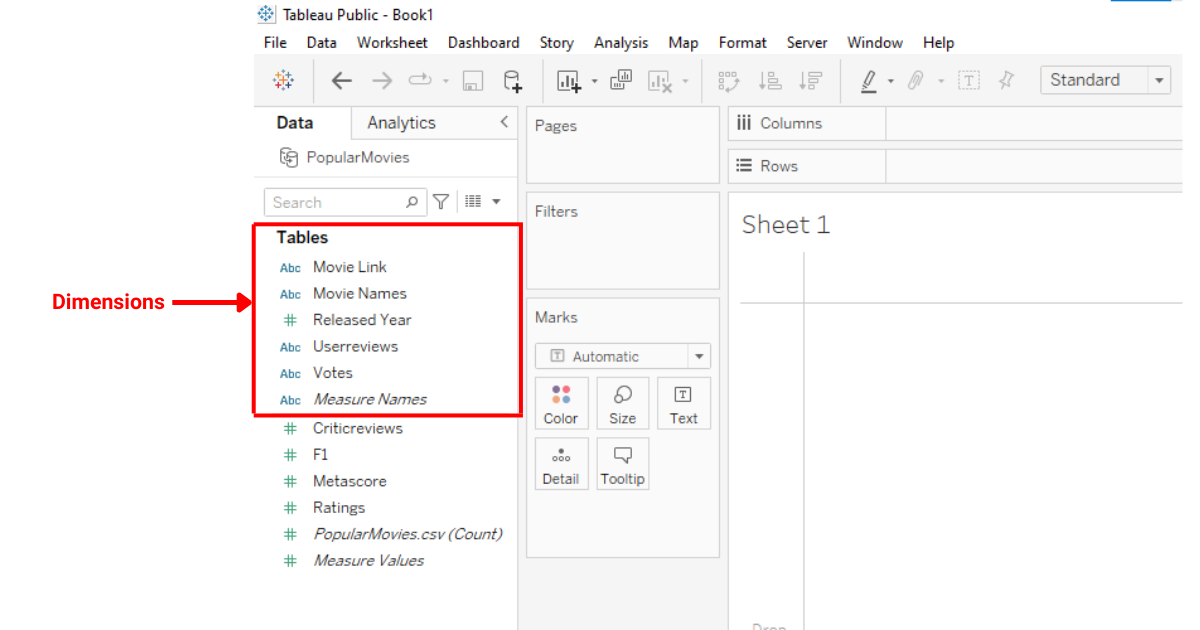
Typically, a tableau dimension represents a data field with qualitative values and doesn’t involve numerical calculations.
Level of Detail
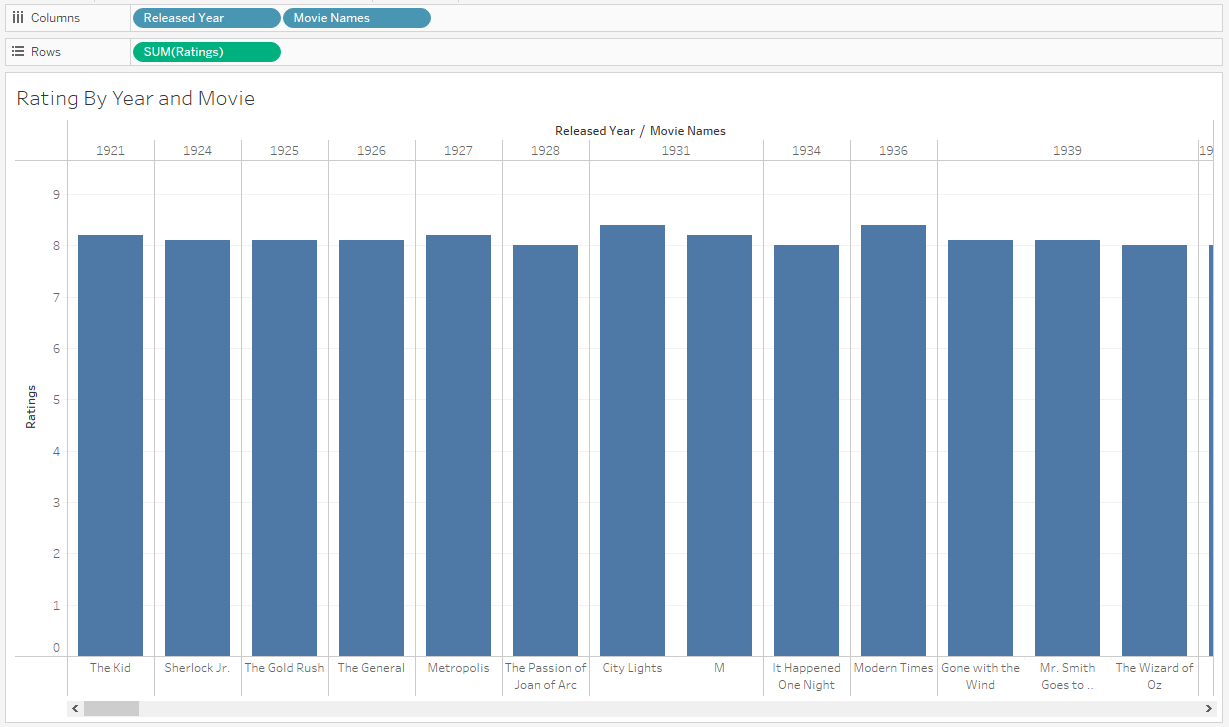
Dimensions in Tableau play a crucial role in defining the level of detail in your visualizations.
By using dimensions, you can create a hierarchical structure that allows the user to explore data on different levels, drilling down or up to uncover patterns and trends.
For instance, you can start with a high-level overview of ratings by year and then drill down to individual movie names, as shown below:
Dimensions are an essential part of Tableau that helps organize and categorize data.
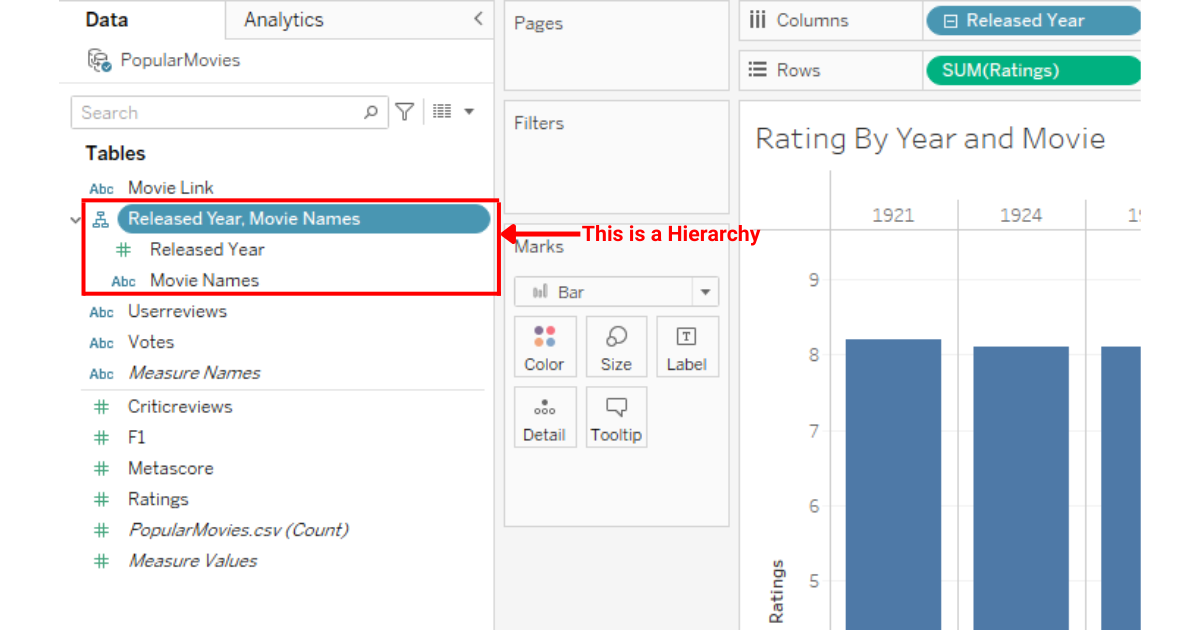
Creating Hierarchies with Dimensions
When creating hierarchies in Tableau, dimensions are usually the building blocks. A hierarchy is a structure that organizes your dimensions into different levels of detail.
This allows you to drill up or down in your visualization to see various perspectives of your data.
For example, a geographical hierarchy might include Country, State, and City levels.
To create a hierarchy, drag a dimension onto another dimension in the Data pane. This automatically creates a hierarchy with the dimensions you used.
You can continue adding dimensions to the hierarchy by dragging and dropping new dimensions onto the hierarchy group in the Data pane.
Once your hierarchy is in place, you can drill up or down in your visualization to explore different levels of granularity.
Click the + or – icon on the hierarchy field in the visualization to navigate between the levels in your hierarchy.
What Are Tableau Measures
Tableau measures are quantitative values that represent data in a numeric format. It allows users to perform calculations and analyze trends.
These values are derived from the fields in your data source and can be aggregated to provide more meaningful insights.
Measures in Tableau are often dependent on dimensions, which serve as the categories or attributes of the data. Their data type can be geographical data, discrete dimension, class attributes, etc.

In the image below, the measures are in the highlighted squared area.
Calculations With Measures
Measures can be used to calculate various types of data, such as sum, average, minimum, maximum, or count. This enables you to extract and display valuable information from your data sources.
When working with measures, it is essential to understand that they are numeric fields that can be aggregated.
Aggregation is a crucial aspect of measures because it allows for data consolidation at different levels of detail.
Some common aggregation methods include:
- Sum: computes the total value of all selected records
- Average: calculates the mean value across all records
- Minimum: finds the smallest value within a set of records
- Maximum: identifies the largest value in a group of records
- Count: determines the number of records within a specified range
Tableau measures are an essential component of data analysis, as they provide the numeric, quantitative, or boolean values necessary for interpreting trends and drawing insights from the data.
4 Differences Between Dimensions and Measures
In this section, we will discuss the 4 main differences between a dimension and a measure.

Difference 1: Nature of data
Dimensions are qualitative and represent distinct categories or attributes in the data set.
In contrast, measures are quantitative, holding numerical values that can be aggregated or analyzed.
This distinction means dimensions segment or categorize data, whereas measures provide the actual metrics within those categories.
Difference 2: Dependency
Dimensions act as independent variables, serving as the foundation for segmenting and categorizing data in visualizations.
On the other hand, measures are dependent variables, relying on the context provided by dimensions to convey meaningful insights and metrics.
Difference 3: Continuous vs. Discrete
Dimensions typically represent discrete data, meaning they have distinct, separate values or categories.
In contrast, measures usually capture continuous data, indicating they can span an infinite range of numerical values without distinct breaks.
Difference 4: Usage in Visuals
Dimensions primarily define the structure or headers in visual representations, segmenting data into distinct categories.
Conversely, measures supply the quantitative values that populate these visuals, determining elements like the magnitude of bars in a bar chart or the trajectory of lines in a line graph.
What Are Green And Blue Pills
The terms green pill and blue pill refer to how dimensions and measures fields are represented in Tableau. They are classified as continuous and discrete fields.
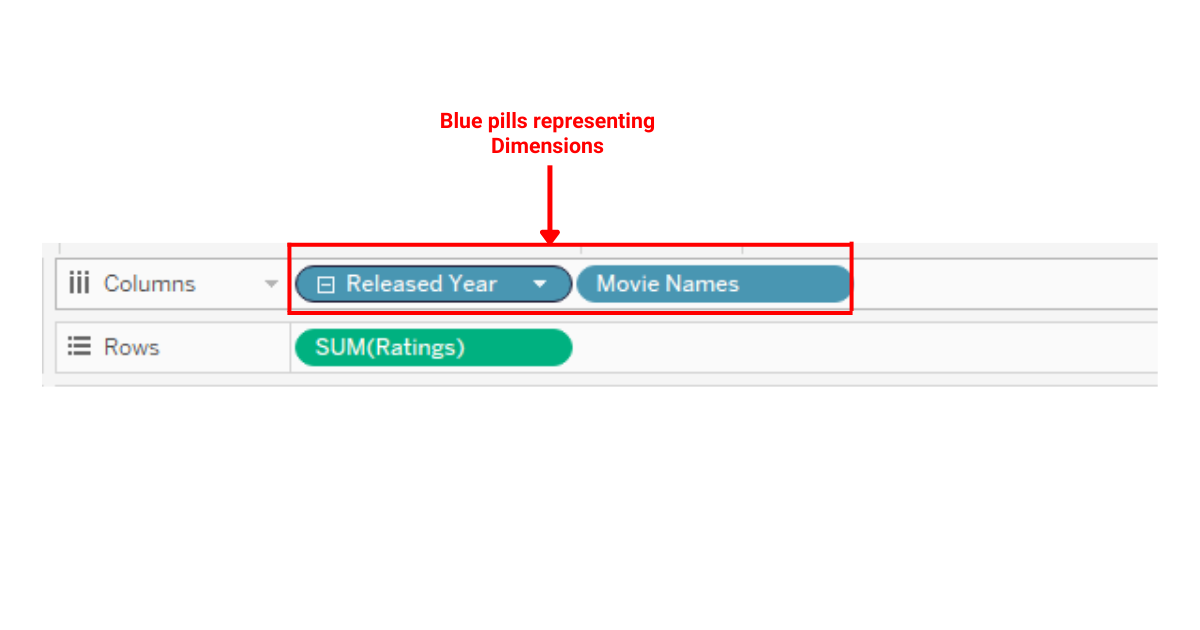
Dimensions in Tableau are denoted with a blue pill and are considered discrete. Discrete values are finite and usually add headers to the view, which helps in creating visual partitions.
In the image below, we have dimensions in the columns shelf, which are blue in color.
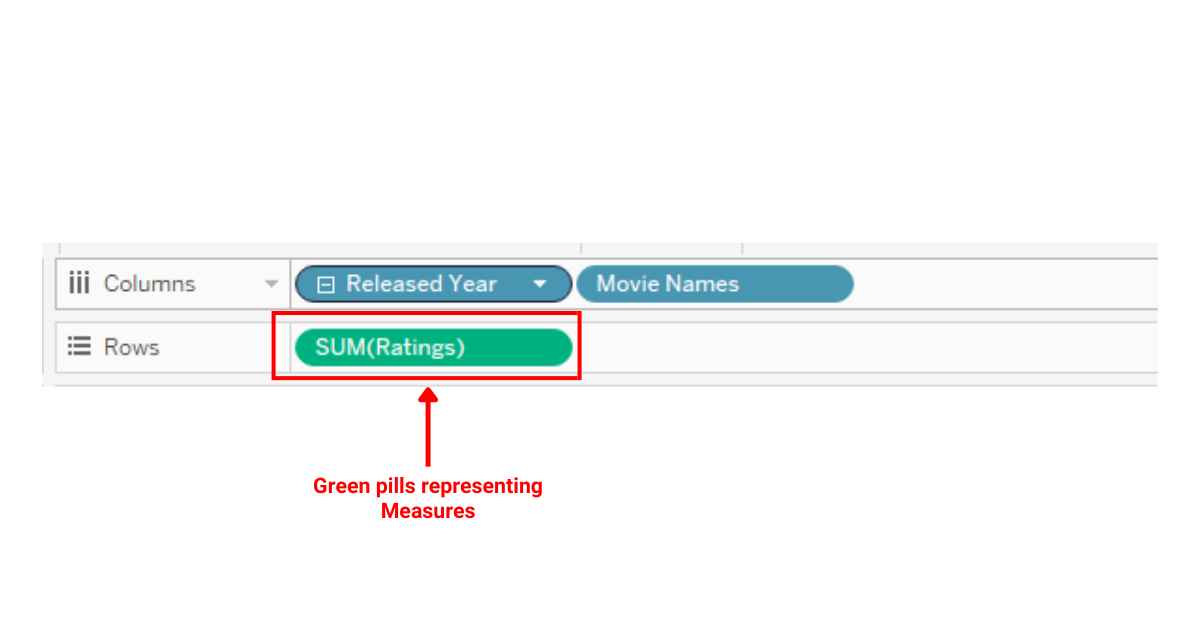
On the other hand, Tableau uses a green pill to signify measures, which are often continuous. Continuous field values represent an infinite range of values, adding axes to the view and providing scope for aggregation.

In the image below, we have a measure in the rows shelf, which are highlighted with a green background.
How to Apply Filters to Dimensions and Measure
In Tableau, filtering plays a crucial role in analyzing and presenting data.
Filters can be applied to both dimensions and measures, allowing you to focus on specific aspects of your data and create targeted visualizations.
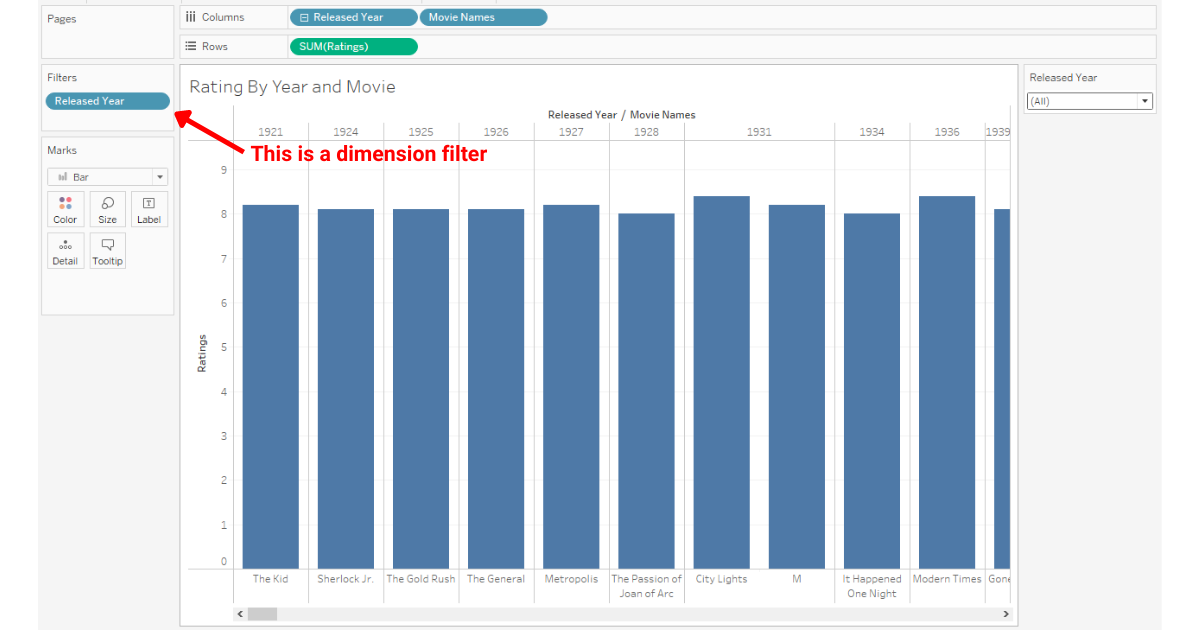
Dimension filters are used to filter data based on categorical values, such as State, City, or Customer Name.
When you apply a dimension filter, you are effectively using a WHERE clause on your data.
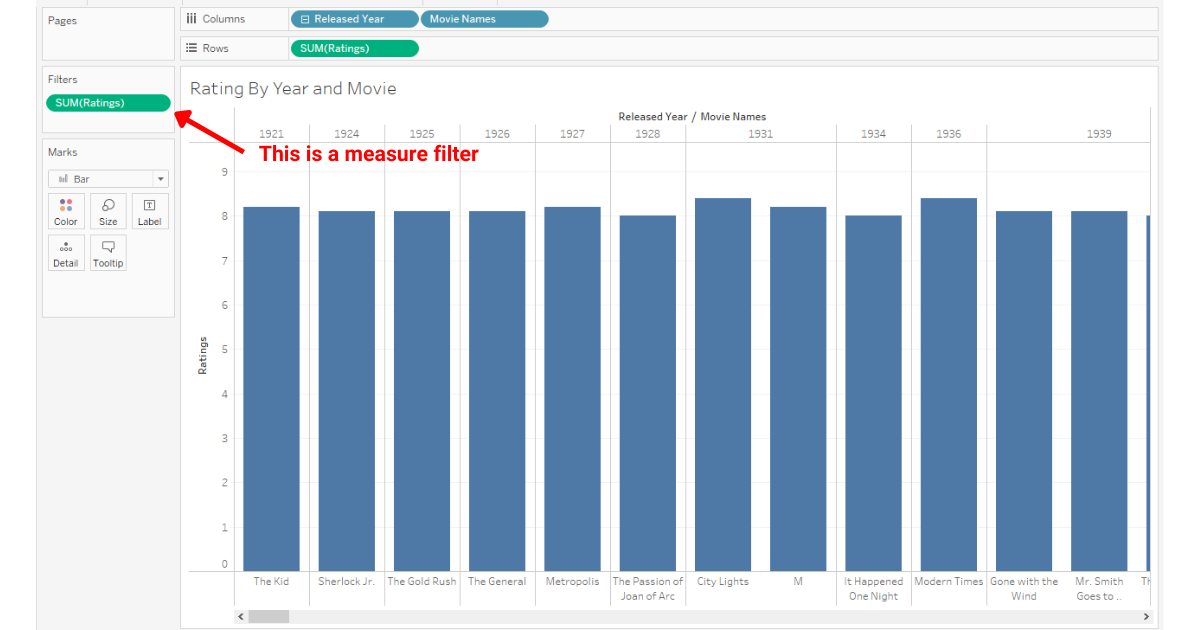
Measure filters deal with the numeric values in your data, such as sales, profit, or quantity.
These filters are similar to the HAVING clause in SQL, as they filter data based on the aggregated measures of your visualization.
Measure filters can help you identify outliers, compare performance metrics, or focus on a specific range of numerical values.
Explore the future of data tech by watching the following video:
Final Thoughts
Understanding the distinction between Tableau dimensions and measures is fundamental to your data visualization journey.
When you grasp these concepts, you’re equipping yourself with the tools to tell compelling stories with data.
Dimensions give your data a voice, setting the stage, while measures provide the melody, offering depth and nuance.
Frequently Asked Questions
In this section, you will find some frequently asked questions you may have when working on Tableau dimensions or measures.

How do dimensions and measures differ in Tableau?
In Tableau, dimensions are fields that categorize and provide context for measures, while measures are numeric data used for quantitative analysis.
Dimensions often produce headers when added to rows or columns, and measures typically produce axes when added to the view.
What are examples of dimensions and measures in Tableau?
Examples of dimensions in Tableau can include categorical data like city names, product categories, or dates.
Measures are numeric values such as sales, profit, or quantity.
When working with data, dimensions help categorize or segment the data, while measures provide values for comparison and analysis.
How does Tableau handle discrete vs continuous fields?
Discrete fields in Tableau are finite and distinct, often represented by blue color, and are used to create headers or separate discrete categories.
Continuous fields, represented by green color, have an infinite range of values and are often used to create axes or show trends.
Both discrete and continuous fields can be dimensions or measures, depending on their context.
What is the impact of dragging a measure into the view?
When you drag a measure into the view in Tableau, the software automatically applies an aggregation to that measure by default.
Aggregation methods include sum, average, median, or more, and provide a summarized view of the numeric data based on the selected dimensions.
Can you differentiate between dimension and measure filters?
Both dimension and measure filters in Tableau help refine and narrow down your data analysis.
Dimension filters act on categorical data, allowing you to select specific categories or values within a dimension for display.
Measure filters, on the other hand, apply conditions based on numeric values, like displaying only those data points with sales above a certain threshold.
What are the various types of dimensions in Tableau?
Dimensions in Tableau may be continuous or discrete. They can include various data types such as text, date, time, and even geographic data like latitude and longitude.
Dimensions with date or time data can be further expanded into hierarchies, allowing for more granular visualization and analysis.