So you’re deep in the world of data visualization and want to show the top 10 results in Tableau?
Well, you’ve come to the right place.
To show the top 10 in Tableau, you can use the “Show Filter” option, which allows you to select the top N values. You can also use the INDEX function to identify the top 10 values in your dataset. Alternatively, you can use the “Top” feature to display the top 10 values. The most straightforward approach is to create a calculated field using the “Top N” option to display the top 10 values.

In this article, we’ll walk you through each of these methods step by step. Each step will have examples to help you better understand the concepts.
Let’s dive in!

4 Methods to Display the Top N Values in Tableau
Tableau provides various options to filter your data to display the top N values based on your requirements.
After connecting to a data source, you can use any of the following techniques to filter and display the top N values in Tableau:
Using the Show Filter Option
Using the INDEX Function
Using the Top N Option in a Calculated Field
Using Sets
1) How to Use the Show Filter Option
To display the top N values in Tableau using the show filter option, you can follow the steps below.
For this example, we will use a sample dataset containing sales data, and we will display the top 10 sales by state.

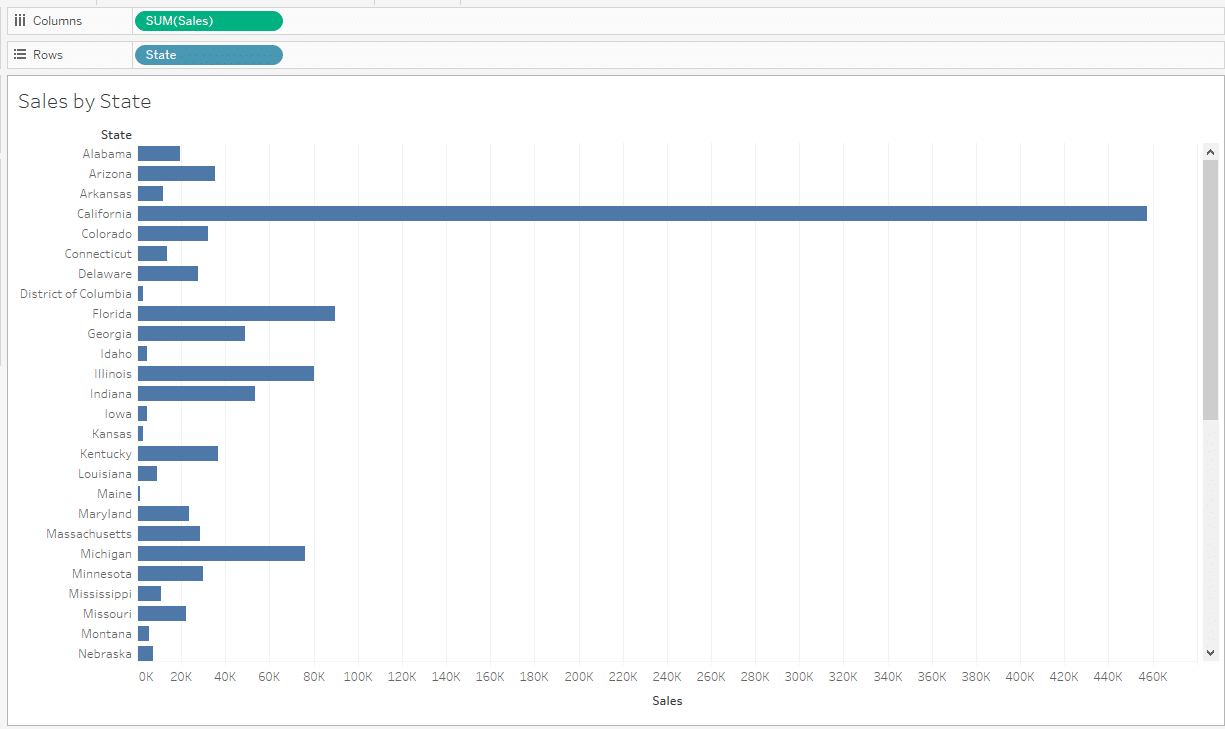
Step 1
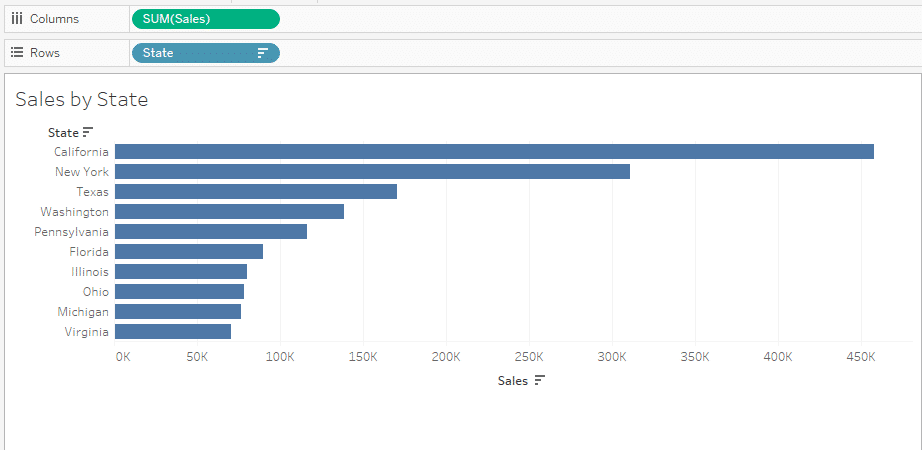
Drag the “State” dimension to the Rows shelf and the “Sales” measure to the Columns shelf.
This will create a horizontal bar chart in the canvas. You can change the visual based on your data requirements.
Step 2
Click on the drop-down arrow on the State dimension pill on the Rows shelf and select Show Filter.
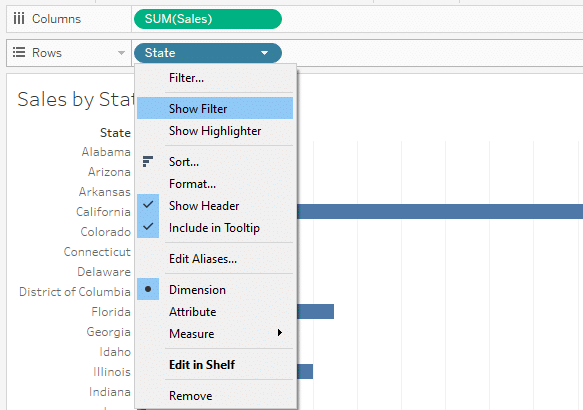
This will copy the dimension to the dimension filter shelf and a filter tab will appear next to your bar chart.
Step 3
Right-click on State in the filter window and select Edit Filter.
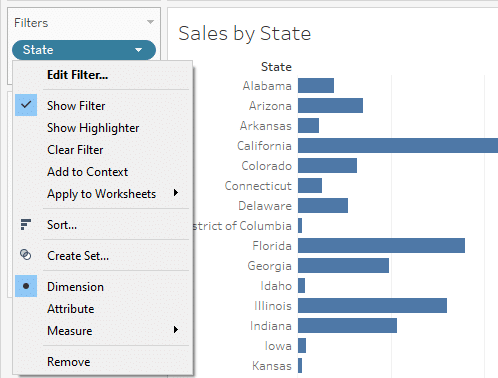
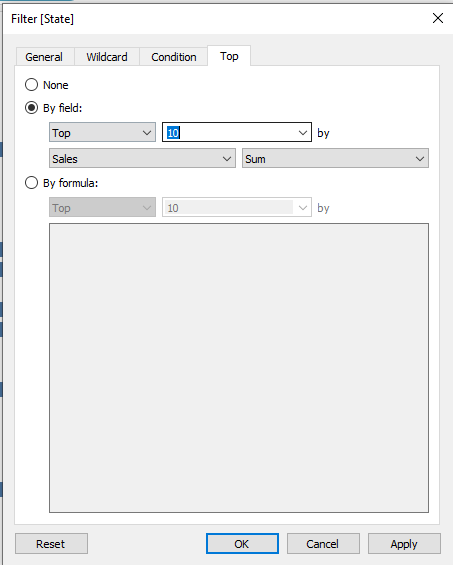
Now select the Top tab and then select the By field option.
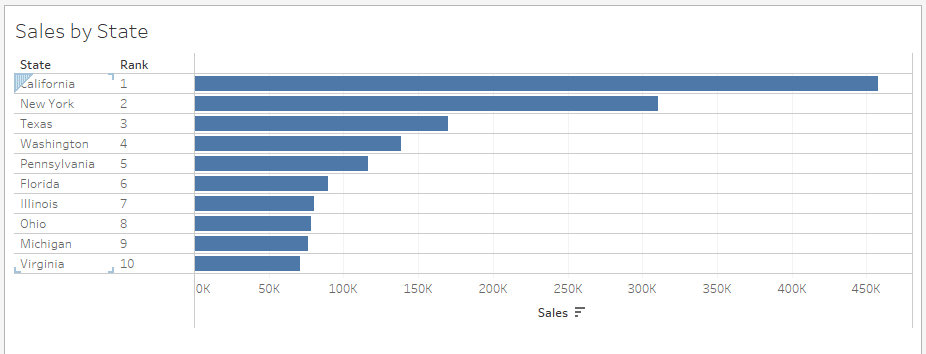
Step 4
Choose “Top N” from the drop-down menu and enter the number of top values you want to display (e.g., 10).
Click “OK” to apply the filter.
The states with the Top 10 sales will be displayed on the canvas. This is particularly helpful in other use cases as well such as displaying top customers, top restaurants, etc.
2) How to Use the INDEX Function
The INDEX function in Tableau assigns a unique index to each row in the partition.
You can use this function to display the top N values by creating a calculated field with a condition based on the INDEX function.
The following are the steps to use the INDEX function to display the top N values in Tableau:
Step 1
Drag and drop State to the row shelf and Sales to the Column shelf. You can change your visualization as needed.
Step 2
Create a calculated field by clicking on the drop-down menu in the Data pane.
In the formula box, enter the following formula and click ok:

INDEX()The formula box will appear like the following:
Click OK to create the calculated field.
Drag the newly created field to the Row shelf. Your view should look like the following:
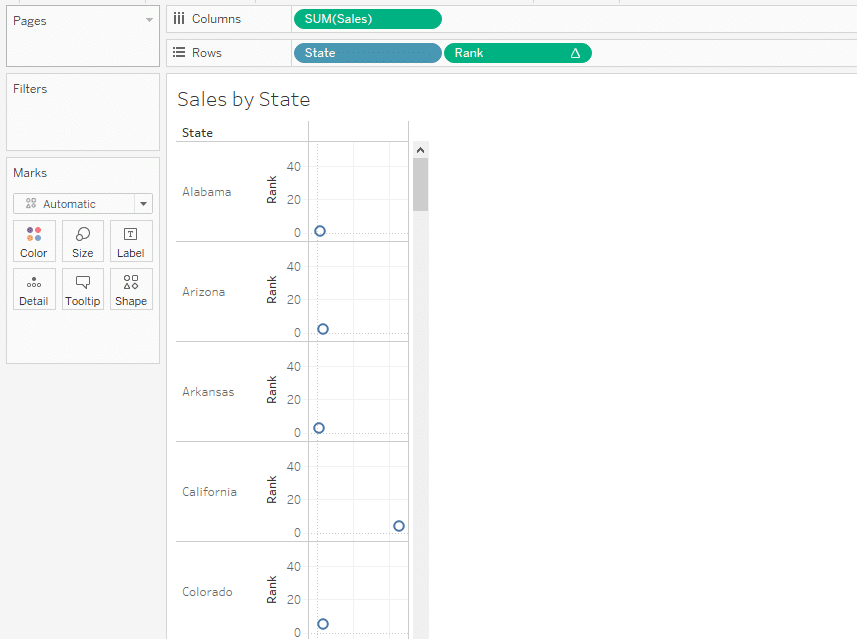
Step 3
Right-click on the newly created field in the Row shelf and select Discrete.
This will change the new field to a discrete form and your visualization will look like the following:
Step 4
At this point, it is important to sort your data in descending order.
To do this, click on the descending order icon in the toolbar menu.
Step 5
Right-click on rank in the Rows shelf, and select Show Filter.
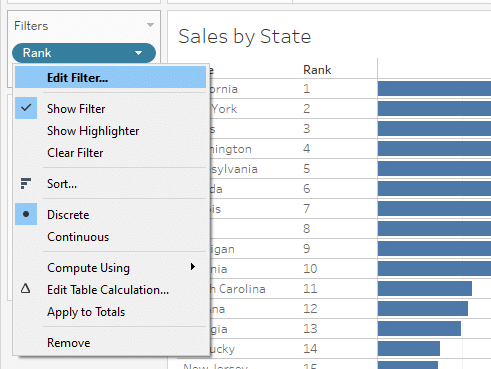
Right-click on Rank in the Filters shelf and select Edit Filter.
A box will open up where you can edit the filter. Select only numbers from 1 to 10 and click OK.
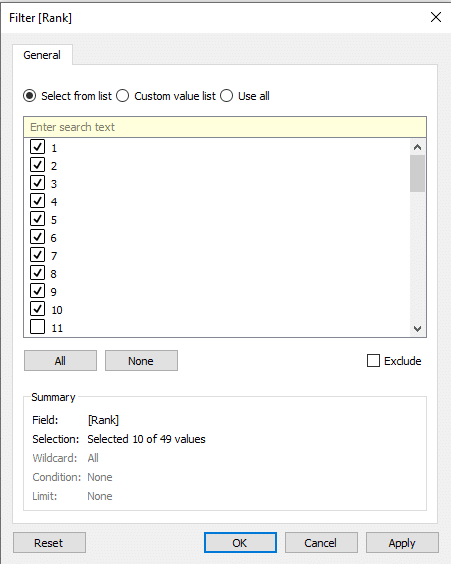
This will display the top 10 sales values in your view.
3) How to Use the Top N in a Calculated Field
In Tableau, you can use the Top N option in a calculated field to display the top N values in your visualization.
Follow the steps given below to display the top 10 rows using this method:
Step 1
Make your desired chart. Drag the State to the Rows shelf and Sales to the Columns shelf.
Step 2
Click on the drop-down menu in the Data pane and select Create Calculated fields.
Name your field something like RankSales and enter the following formula in the box:
RANK(SUM([Sales]))The formula box should look like the following:
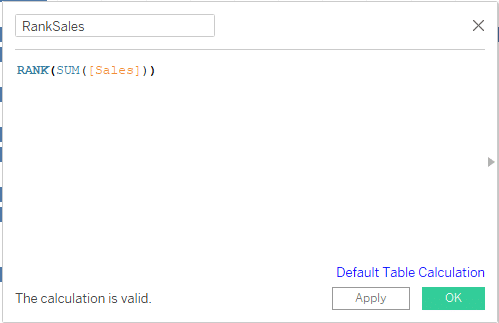
Drag RankSales to the Rows shelf. Right-click on it and select Discrete. Right-click on RankSales again, hover over Compute Using, and select State.
Your visualization should look like the following:
Step 3
Create another Calculated Field and name it IsTopN.

Enter the following formula in the formula box:
IF [RankSales] <= 10 THEN TRUE ELSE FALSE ENDClick OK.
Drag and drop the newly created field to the Filters shelf. A configuration box will open where you must select True.
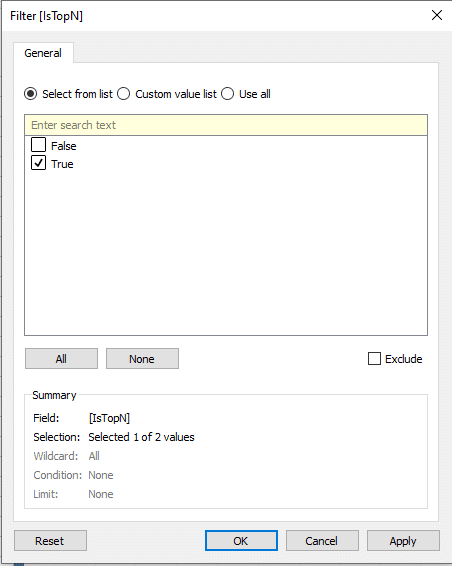
After the above step, you will get the following top 10 visualizations in Tableau:
4) How to Calculate Top 10 Using Sets
Follow the steps given below to show the top 10 using sets in Tableau:
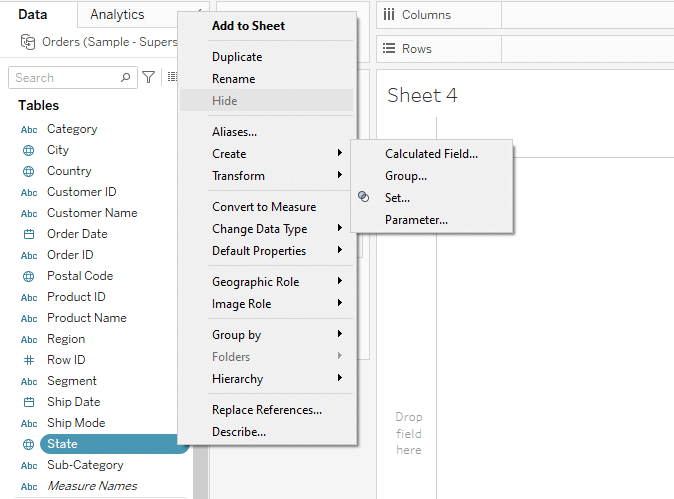
Step 1
Right-click on the ‘State’ dimension in the data pane. Choose ‘Create’ > ‘Set’.
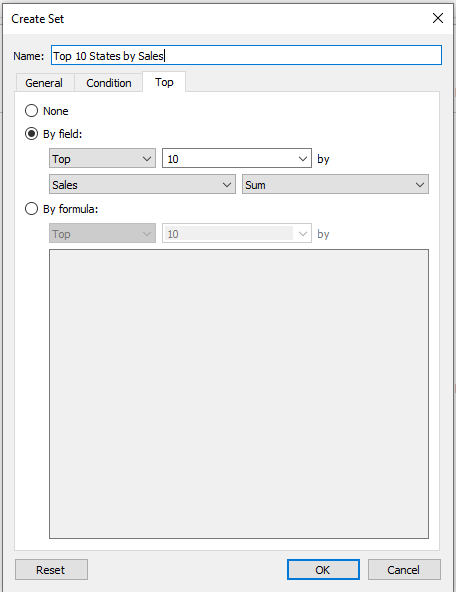
Step 2
In the Set dialog box, select the ‘Top’ tab.
Choose ‘By field:’ and then select ‘Sales’ from the dropdown list. Choose ‘Sum’ as the aggregation method.
Specify ’10’ for the number of top items you want in the set.
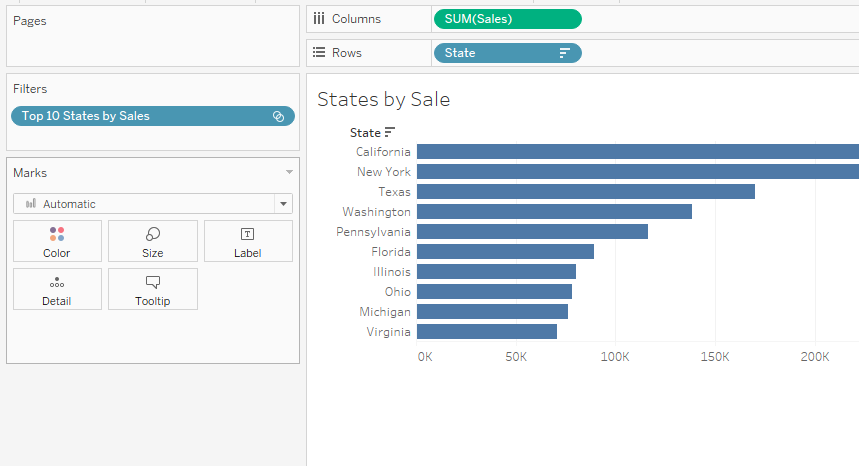
Name the set something descriptive, like ‘Top 10 States by Sales’.
Step 3
Drag the ‘Top 10 States by Sales’ set to the ‘Filters’ shelf.
This will filter your view to only show the states that are in the top 10 based on Sales.
Learn Advanced Data Analytics (ADA) from OpenAI by watching the following video:
Final Thoughts
Displaying the top N values in Tableau is a valuable skill that can significantly enhance your data visualization. It allows you to focus on the most relevant information, making your visuals more impactful and easier to understand.
Mastering the techniques outlined in this article empowers you to showcase key insights and trends with precision, whether it’s the top 10 sales figures or the top 5 performing products.
This level of control not only makes your data stories more compelling but also helps your audience grasp the significance of the data at a glance.
Frequently Asked Questions
In this section, you will find some frequently asked questions you may have when showing top 10 in Tableau.
How can I display the top 10 values using the INDEX function in Tableau?
To display the top 10 values using the INDEX function in Tableau, you can create a calculated field with a condition based on the INDEX function.
The formula for the calculated field would be similar to the following:
Then, you can use this calculated field in your visualization to filter and display the top 10 values.
What is the easiest way to show the top 10 values in a Tableau chart?
The easiest way to show the top 10 values in a Tableau chart is to use the “Top” option in the quick table calculation.
Right-click on the measure in your chart, and select “Quick Table Calculation” > “Top N.”
In the “Table Calculation” dialog, select “Specific Dimensions,” and choose the dimension you want to calculate the top 10 values for.
Enter “10” in the “Top” field.
Can I create a filter to show the top 10 values in a Tableau worksheet?
Yes, you can create a filter to show the top 10 values in a Tableau worksheet.
Right-click on the dimension you want to filter by, and select “Create” > “Parameter.”
In the “Create Parameter” dialog, select “Integer” as the data type, and enter a name for the parameter (e.g., “Top N Filter”).
Create a calculated field using the INDEX function, similar to the formula mentioned in the first question.
Drag the calculated field to the Filters shelf, and set the condition to “True.”
Right-click on the calculated field in the Filters shelf, and select “Edit Filter.”
In the “Edit Filter” dialog, choose “Use all” for the filter, and then select “By field” and choose the parameter you created in step 2.
Click “OK” to apply the filter.
Now, you can use the parameter to dynamically change the number of top values displayed in your worksheet.
How to create a dynamic top N filter in Tableau?
To create a dynamic top N filter in Tableau, you can use a parameter and a calculated field.
Right-click on the dimension you want to filter by, and select “Create” > “Parameter.”
In the “Create Parameter” dialog, select “Integer” as the data type, and enter a name for the parameter (e.g., “Top N Filter”).
Create a calculated field using the INDEX function, similar to the formula mentioned in the first question.
Drag the calculated field to the Filters shelf, and set the condition to “True.”
Right-click on the calculated field in the Filters shelf, and select “Edit Filter.”
In the “Edit Filter” dialog, choose “Use all” for the filter, and then select “By field” and choose the parameter you created in step 2.
Click “OK” to apply the filter.
Now, you can use the parameter to dynamically change the number of top values displayed in your worksheet by adjusting the slider control for the parameter.