Ready to create a forecast in Tableau, don’t worry, it’s easy.
To create a forecast in Tableau:
Start by connecting to your data source and opening a new worksheet.
Drag the field you want to forecast onto the Rows shelf.
Click on the Analytics pane, select Forecast, and adjust the settings as needed.
You can also use the FORECAST() function to create forecasts in Tableau. This function uses linear regression to predict future values based on historical data.

But wait, there’s more.
In this article, we’ll discuss how to create forecasts, and we’ll explore 2 different forecasting methods, plus provide a step-by-step guide to help you make accurate predictions in your visualizations.
Let’s get started!

2 Ways to Forecast Data in Tableau
Tableau offers multiple methods for forecasting data, providing you with the flexibility to choose the most suitable approach based on their data and analytical needs.
In this section, we’ll explore 2 primary ways to forecast data in Tableau:
Forecasting from a visualization
Forecasting from the Analysis tab
1. How to Forecast From a Visualization
Tableau’s forecast models capture the future trends in your data.

Follow the below steps given below to forecast data in Tableau:
Step 1
Start by connecting Tableau to your data source. Build a visualization that includes the data you want to forecast. For example, a line chart showing historical sales.
Step 2
Right-click on your visualization, navigate to forecast, and then select Show Forecast.
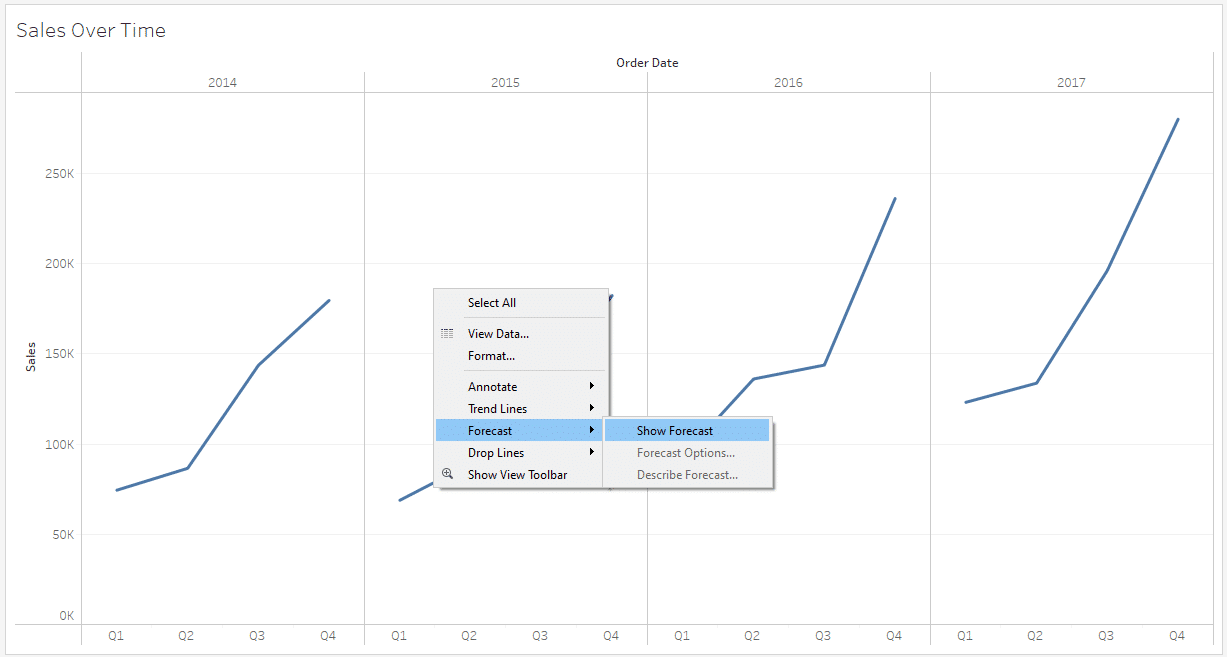
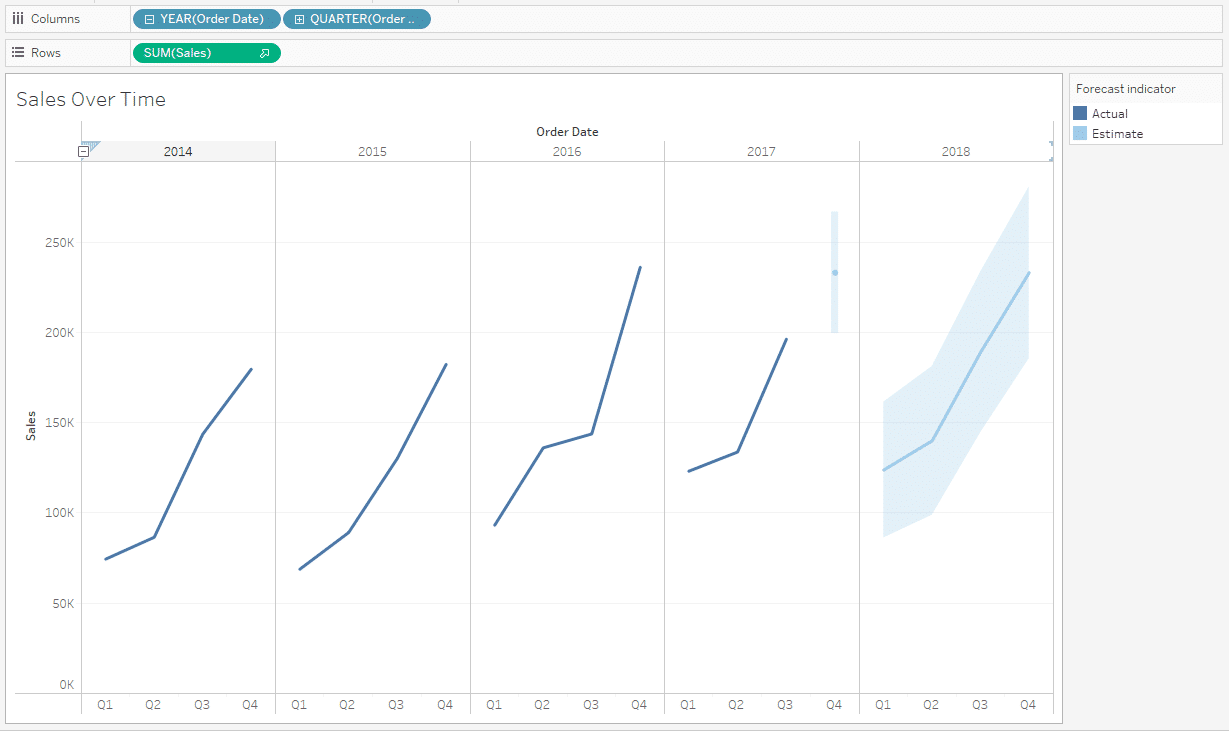
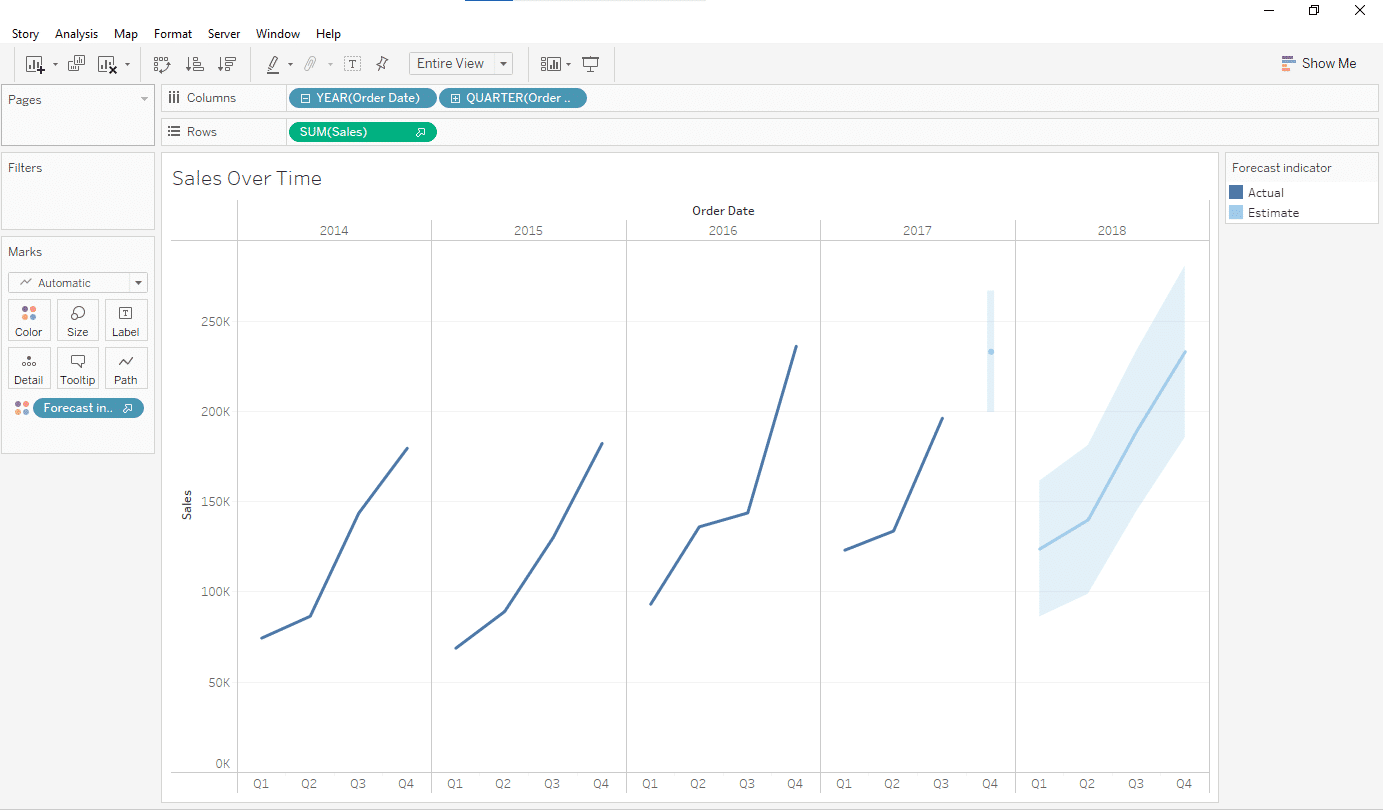
When you click Show Forecast, Tableau will automatically create the forecast for you. Your visualization will look something like the following:
This is the most simple way of creating a forecast in Tableau. However, by default, Tableau does exponential smoothing and to gain deeper insights, you may need to manually change forecast settings.
2. How to Forecast From The Analysis Tab
If you’d like to make adjustments to your forecasts when creating forecasts in Tableau, you can use the forecasting feature from the Analysis tab.
Follow the steps given below to forecast in Tableau using this method:
Step 1
Create a time series chart by dragging your date dimension to the Columns shelf and your forecast measure (the numeric field) to the Rows shelf.
Step 2
Once your time series chart is ready, go to the menu bar at the top of the screen and click on the Analysis tab.
In the drop-down menu under Analysis, find and click on Forecast. Then, select Show Forecast.
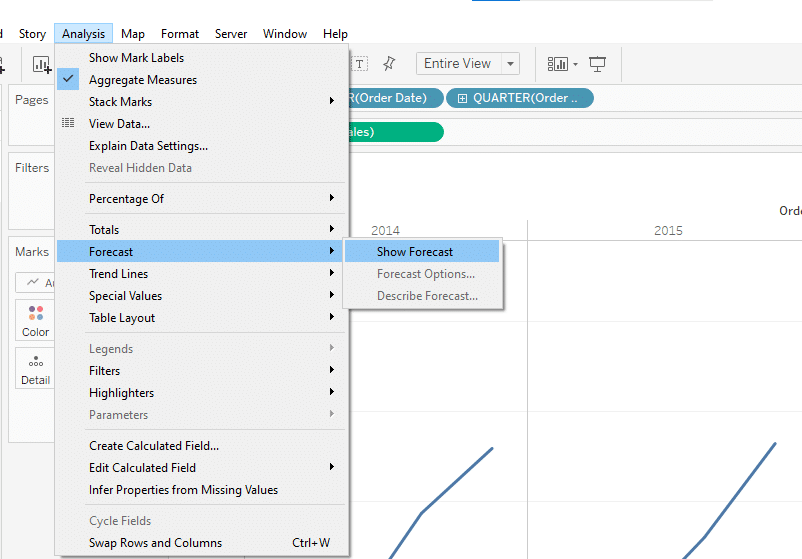
Tableau will automatically add a forecast to your time series chart based on its built-in forecasting model.
Step 3
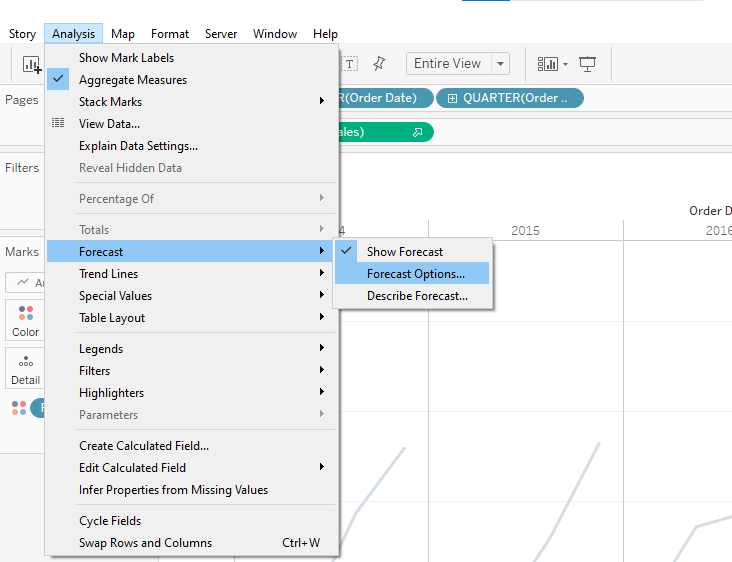
To customize the forecast, navigate to Analysis > Forecast > Forecast Options.
In the Forecast Options window, you can adjust several settings, such as:
Forecast Length: Define how many periods into the future you want to extend your forecast.
Confidence Intervals: Choose the level of confidence or prediction intervals, which show the range of possible values the actual future values are likely to fall within.
Trend and Seasonality: Decide if you want Tableau to automatically detect and adjust for trend and seasonality in your data, or if you want to set these manually.
You can change these settings according to your requirements. When done, click OK.
To understand your forecast, you can click on the option Describe Forecast, and Tableau will come up with the best summary of your model.

After setting up your forecast diagram, Tableau will display it on your chart, usually with a different color or shading to distinguish forecasted values from historical data.
Learn how to create demo data on ChatGPT by watching the following video:
Final Thoughts
In the age of big data, making predictions has become essential to stay ahead. Fortunately, Tableau makes forecasting a breeze. Whether you’re a data analyst, business professional, or an aspiring data scientist, Tableau’s forecasting and predictive analytics capabilities can empower you to make data-driven decisions with confidence.
By mastering the art of forecasting in Tableau, you can unlock valuable insights from your data, identify an evolving trend, and anticipate future outcomes.
As you embark on your forecasting journey, remember that practice and experimentation are key.
Frequently Asked Questions
In this section, you will find some frequently asked questions you may have when forecasting in Tableau.

How to create a forecast using a date field?
To create a Tableau forecast using a date field, you can follow these steps:
Connect to your data source and open a new worksheet.
Drag the date field you want to forecast onto the Columns shelf.
Drag the measure you want to forecast onto the Rows shelf.
Click on the Analytics pane, select Forecast, and adjust the settings as needed.
How to forecast data by month in Tableau?
To forecast data by month in Tableau, follow these steps:
Connect to your data source and open a new worksheet.
Drag the date field you want to forecast onto the Columns shelf.
Right-click on the date field, choose Exact Date, and then Month.
Drag the measure you want to forecast onto the Rows shelf.
Click on the Analytics pane, select Forecast, and adjust the settings as needed.
What is the difference between forecasting and trend analysis in Tableau?
Forecasting in Tableau involves predicting future values based on historical data, while trend analysis focuses on identifying and visualizing patterns or tendencies within the data.
Forecasting uses statistical models to make predictions, whereas trend analysis is more about understanding the direction and magnitude of changes over time.
What is the process for creating a forecast model in Tableau?
To create a forecast model in Tableau, follow these steps:
Connect to your data source and open a new worksheet.
Drag the date field you want to forecast onto the Columns shelf.
Right-click on the date field, choose Exact Date, and then select the appropriate date part (e.g., Year, Quarter, Month).
Drag the measure you want to forecast onto the Rows shelf.
Click on the Analytics pane, select Forecast, and adjust the settings as needed.
Tableau will automatically create a forecast model based on the selected measure and date part.