Calculating percentages is a common task when exploring a dataset. When presenting your findings, you’ll often want to show some measures as percentages. They make comparisons easy and let you communicate your findings more effectively.
To calculate percentages in Tableau, you can use the “Quick Table Calculation” feature by right-clicking a measure and selecting “Percent of Total.” You can calculate percentages using calculated fields, windows functions, LOD expressions, and table calculations.
But, there is more than one way to do things here!
Read on to learn how to calculate percentages using various techniques.
These methods will easily adapt to your specific data requirements allowing you to create visualizations that present your results in a clear manner.
So, let’s dive into the world of Tableau and master the art of calculating percentages.

5 Methods For Calculating Percentages in Tableau
In this section, we will review the top 5 methods for calculating percentages in Tableau.
Specifically, we will go over the following:
- Using Quick Table calculation
- Using Calculated Field
- Using Window Functions
- Using LOD Expressions
- Using Table Calculation

1. How to Calculate Percentages Using Quick Table Calculation
One of the most convenient ways of calculating percentages in Tableau is by using the quick table calculation.
To calculate percentages using quick table calculation, you can follow the steps given below:
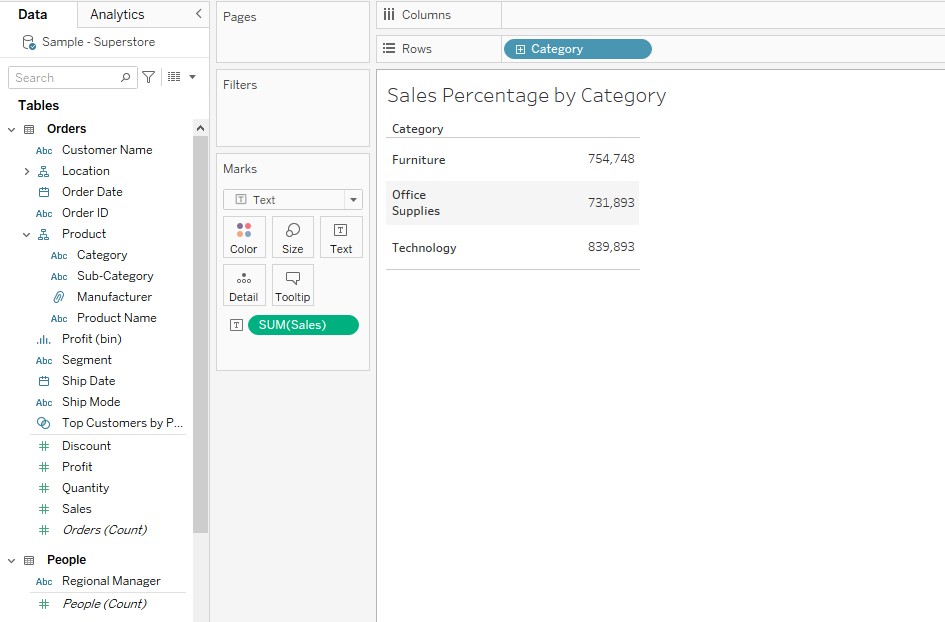
Step 1: Add Dimension And Measure to The View
Drag and drop the dimension and measure you’re interested in (e.g., Sales) onto the appropriate shelf, typically the Columns or Rows shelf.
Step 2: Initiate Quick Table Calculation
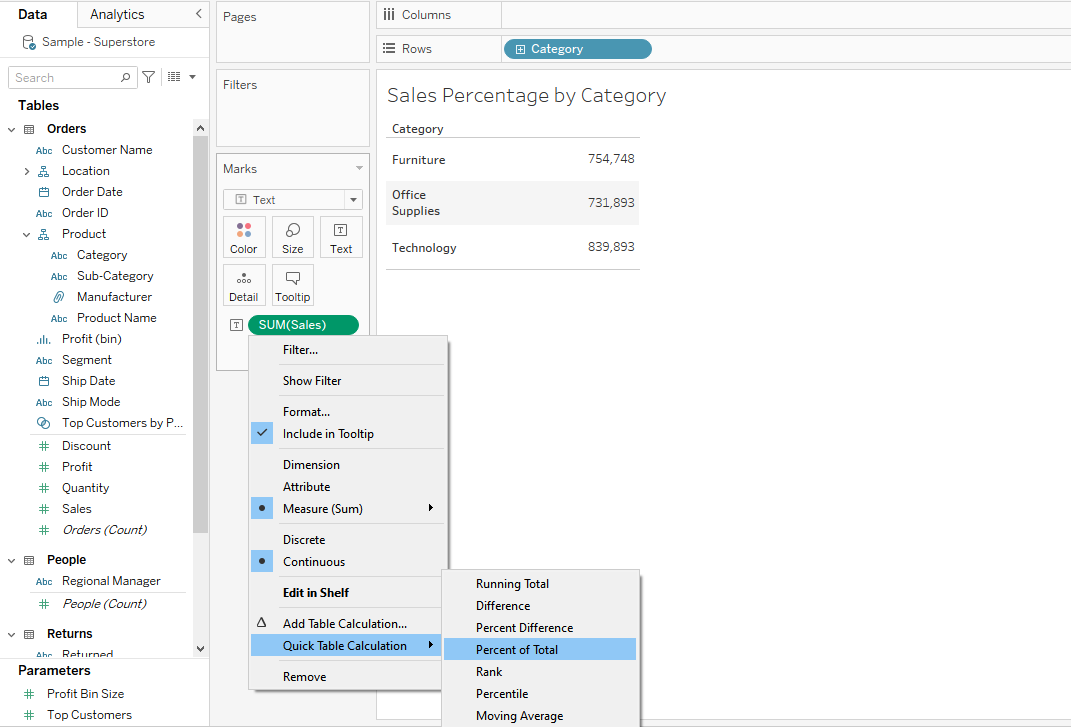
Right-click on the measure pill you’ve placed in the view and navigate to the “Quick Table Calculation” option in the dropdown menu.
Then select Percent of Total.
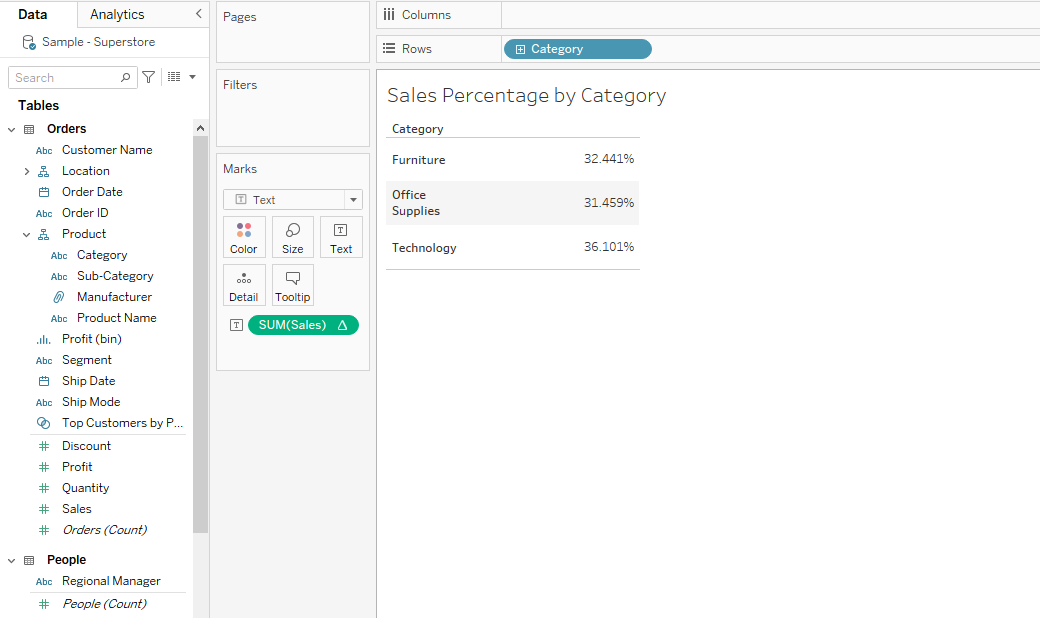
When you select the Percent of Total, you will see the percentage in terms of grand totals for each category.
2. How to Calculate Percentages Using Calculated Field
To calculate percentages using a calculated field, you can follow the steps given below:
Step 1: Open the Calculated Field Dialog
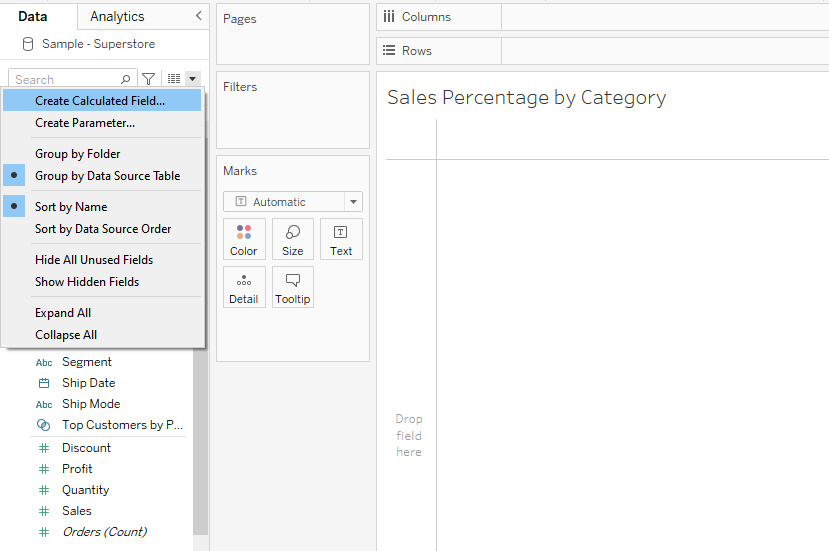
Navigate to Analysis > Create Calculated Field, or right-click in the “Data” pane and select “Create Calculated Field”.
Step 2: Name the Calculated Field
Give your new field a meaningful name, like “Sales Percentage”.
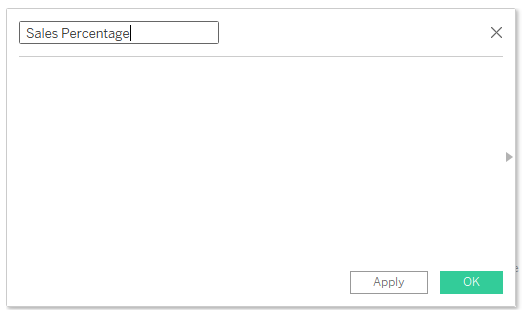
Step 3: Enter the Formula
Depending on what percentage you want to calculate, you’ll enter the appropriate formula.
SUM([Sales]) / TOTAL(SUM([Sales]))The above formula will calculate the percentage.
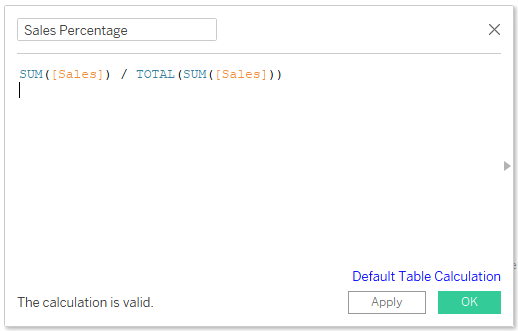
Once you’ve entered your formula, click “OK” to close the dialog and add the calculated field to your data pane.
Step 4: Drag the Calculated Field to Your View
Drag the new “Sales Percentage” field (or whatever you named it) onto the desired shelf.
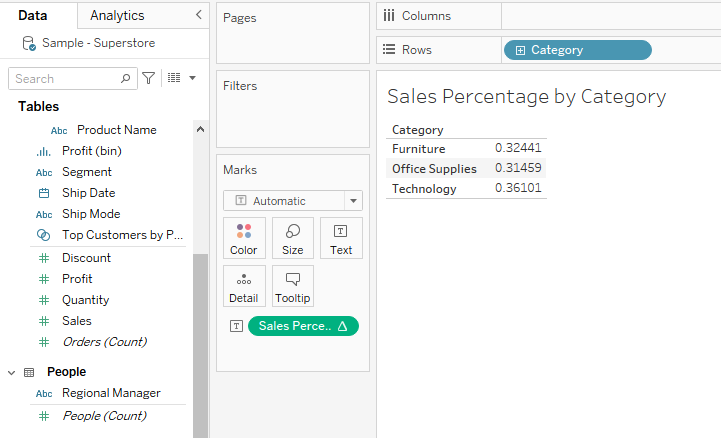
Step 5: Format The Values
After carrying out all your calculations, you must ensure that the values are displayed as percentages.
Right-click on the calculated field pill in your view, choose Format, and under the Numbers dropdown, select Percentage.
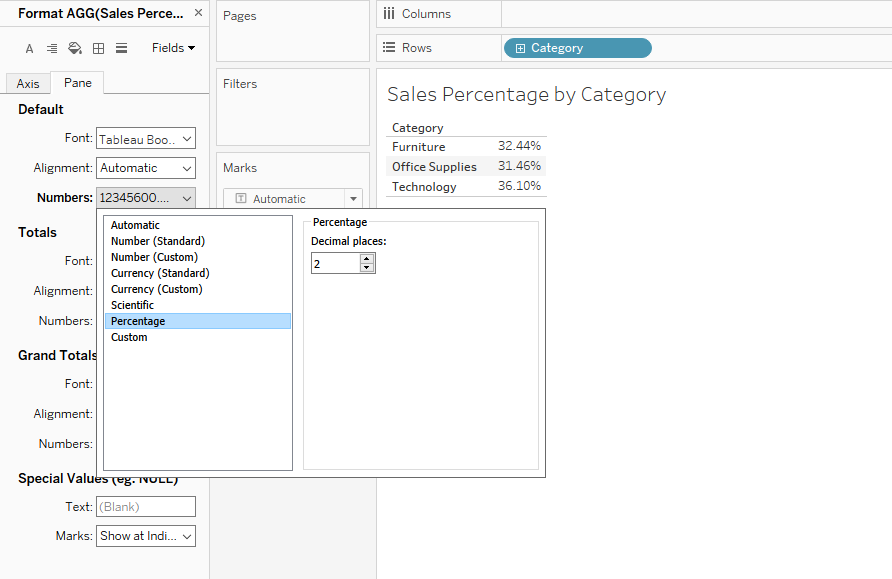
3. How to Calculate Percentages Using Window Function
Using window functions in Tableau allows you to perform calculations across a specified range of rows related to the current row, offering dynamic ways to compute percentages based on your visualization.
Here’s how to calculate percentages using a window function:
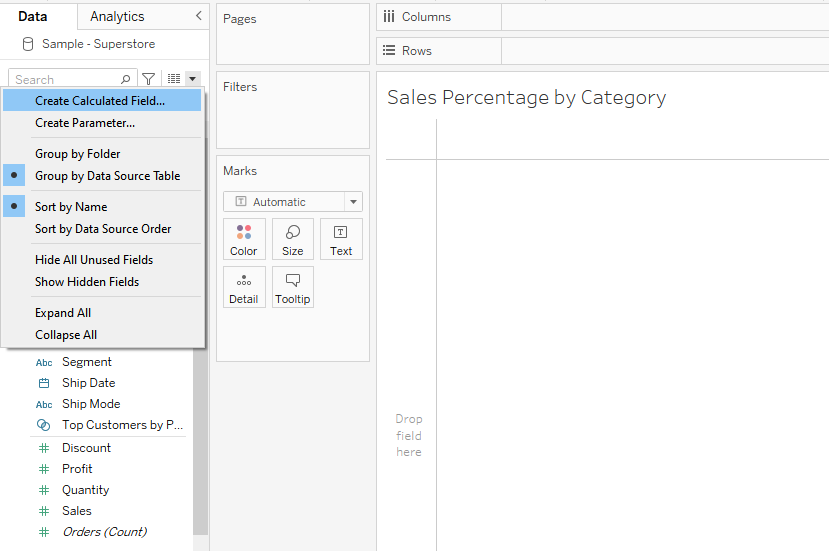
Step 1: Open the Calculated Field Dialog
Navigate to Analysis > Create Calculated Field, or right-click in the “Data” pane and select Create Calculated Field.
Step 2: Name The Calculated Field And Enter Formula
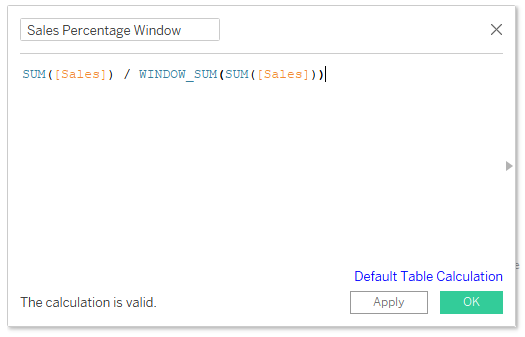
After opening the calculated field dialog box, you’ll enter the appropriate formula.
To compute the percentage of total sales, you can use the following formula:
SUM([Sales]) / WINDOW_SUM(SUM([Sales]))Click OK after entering the formula.
Step 3: Drag the Calculated Field to Your View
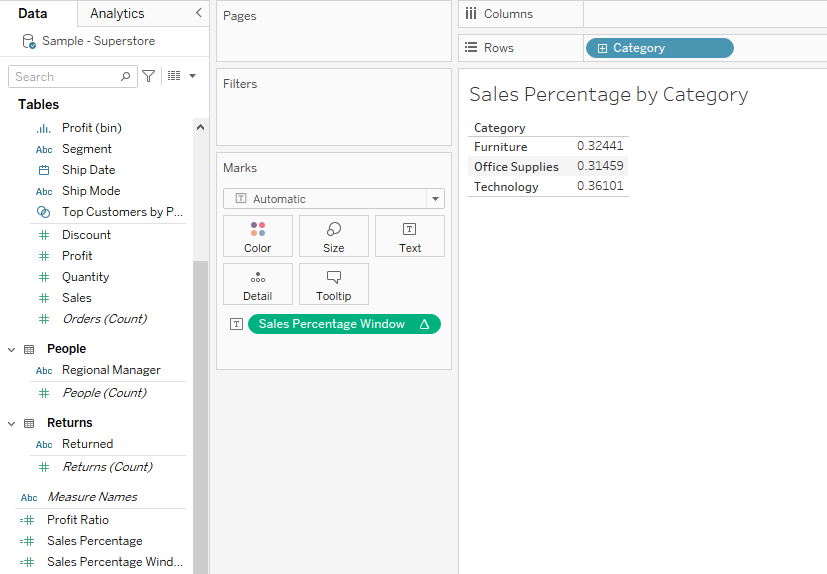
Add your new Sales Percentage Window field (or whatever you named it) to the appropriate shelf.
Step 4: Formatting The Values
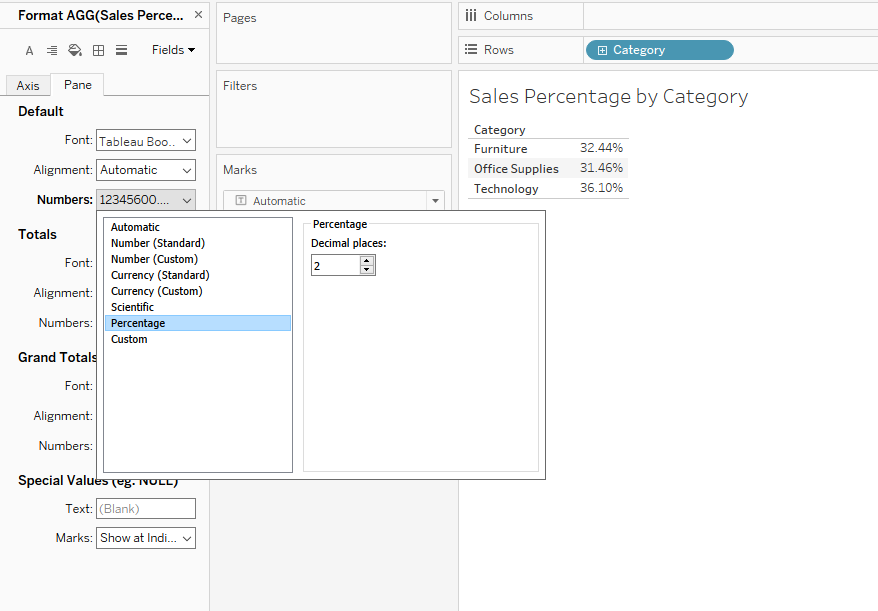
Right-click on the calculated field pill in your view, choose Format, and under the Numbers dropdown, select Percentage.
4. How to Calculate a Percentage Using LOD Expressions
Level of Detail (LOD) expressions in Tableau enable you to perform calculations at specific levels of granularity.
You can use include, exclude, and fixed LOD calculations to compute percentages.
To calculate percentages using the LOD expressions, you can follow the steps given below:
Step 1: Open the Calculated Field Dialog
Navigate to Analysis > Create Calculated Field, or right-click in the Data pane and select Create Calculated Field.
Step 2: Name the Calculated Field And Enter The Formula
Label your calculated field by giving it an appropriate name.
Let’s say you have a view broken down by both Category and Sub-Category, but you want to calculate the percentage of sales for each Sub-Category relative to its Category, excluding the influence of any other dimensions.
You can use the following LOD expression:
{INCLUDE [Sub-Category]: SUM([Sales])} / {EXCLUDE [Sub-Category]: SUM([Sales])}By using the {INCLUDE [Sub-Category]:…} expression, you’re ensuring that the numerator aggregates sales at the Sub-Category level of detail, just like the denominator.
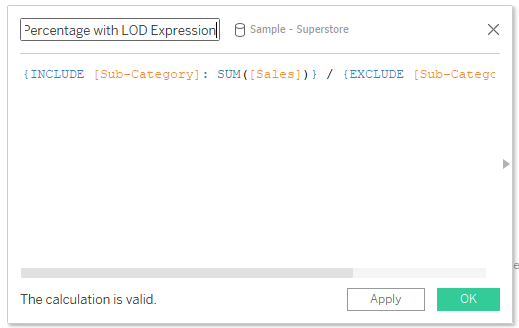
Click OK and then add the calculated field to your view.
5. How to Calculate Percentages Using Table Calculations
Table Calculations are a powerful feature and can be used to calculate percentages across different dimensions and the entire table.
To create a table calculation, follow these steps:
Step 1:
Right-click on a measure in your view, and then select Add Table Calculation.
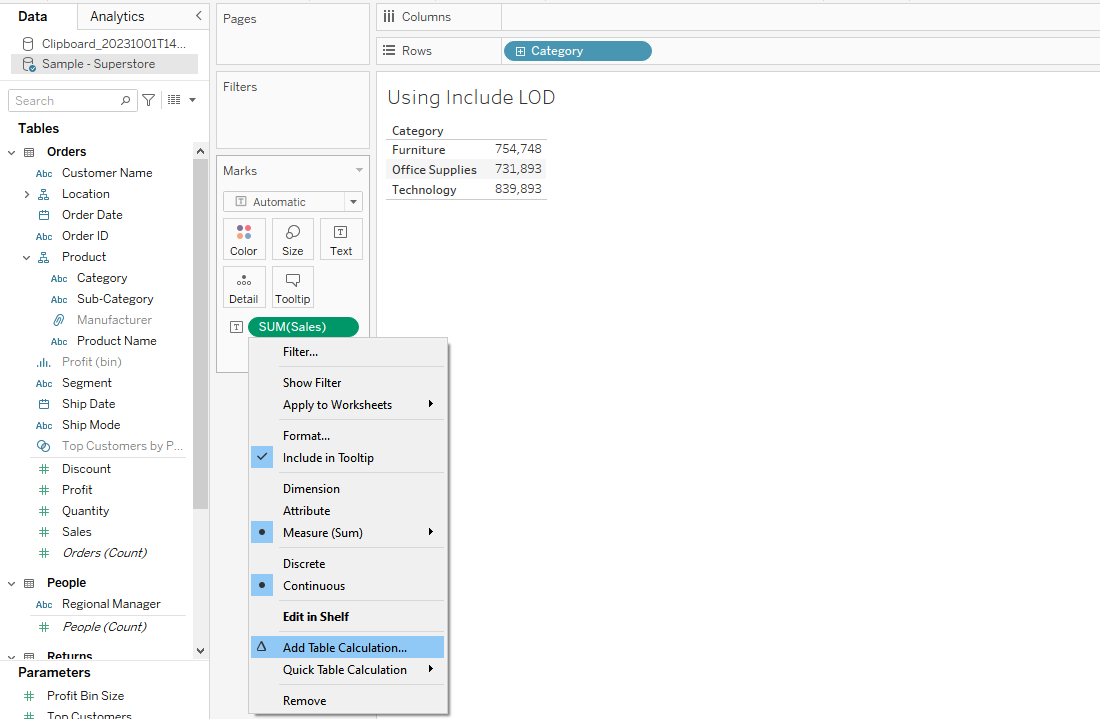
Step 2:
In the Table Calculation dialog box, choose a calculation type that suits your needs (e.g., Percent of Total, Running Total, or Difference).
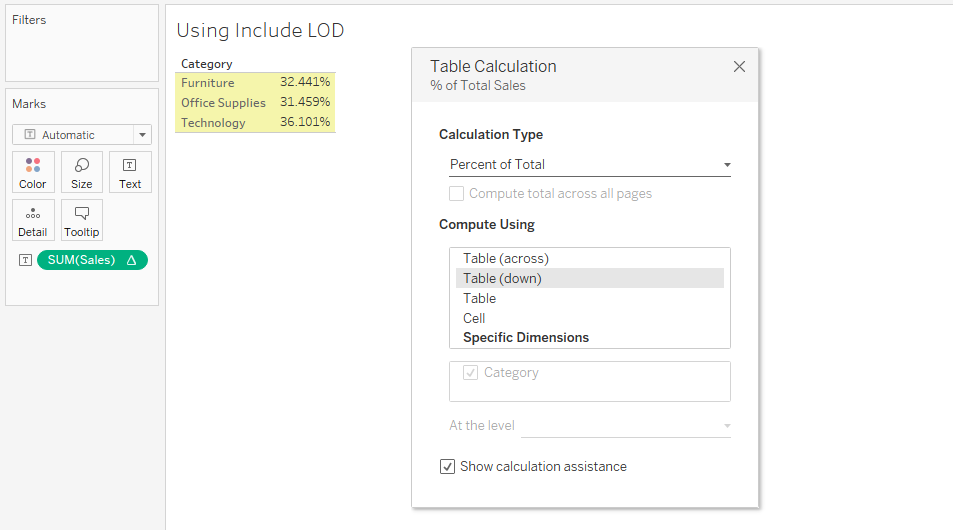
Once you have completed these steps, the percentage values will be displayed in your view.
Take a look at the below video to learn more about Advanced Data Analytics by OpenAI:
Final Thoughts
Calculating percentages in Tableau is a fundamental skill every user should master. Percentages offer a clearer perspective than raw numbers, making data more digestible and insights more actionable.
By understanding how to compute percentages, you ensure that your dashboards and reports are both informative and relatable. This knowledge enhances not only the accuracy of your work but also its relevance.
In a world driven by data, being able to present numbers in a context, like percentages, is invaluable. It aids in better decision-making and clearer communication.
Frequently Asked Questions
In this section, you will find some frequently asked questions you may have when calculating percentages in Tableau.

How to compute the percentage of a total with filters applied?
To compute the percentage of a total with filters applied in Tableau, you should use Level of Detail (LOD) expressions.
For example, create a calculated field using LOD with the FIXED keyword:
SUM([Sales]) / SUM({FIXED : SUM([Sales])})
This will calculate the percentage considering all data, even after applying filters.
How to display a percentage over 100 in Tableau?
In order to display a percentage over 100 in Tableau, you can create a calculated field to manually compute the percentage.
Divide the value by the total, and multiply the result by 100:
(SUM([Value]) / SUM([Total])) * 100
Now, place this calculated field in your visualization to display the percentage, even if it exceeds 100%.
What is the method to convert the number to a percentage in a calculated field?
To convert a number to a percentage in a calculated field in Tableau, divide the value by the total and then multiply by 100.
For example:
(SUM([Value]) / SUM([Total])) * 100
This will provide the percentage value needed for your visualization.
How to calculate the percentage of a total for multiple measures?
If you need to calculate the percentage of a total for multiple measures, create a separate calculated field for each measure:
(SUM([Measure 1]) / SUM([Total])) * 100
(SUM([Measure 2]) / SUM([Total])) * 100
Now, place these calculated fields in your visualization to display the respective percentages for each measure.
What is the process for showing percentages in a bar chart?
To show the percentage in a bar chart, first create a calculated field to calculate the percentage:
(SUM([Value]) / SUM([Total])) * 100
Drag this calculated field to the Rows or Columns shelf, depending on whether you want a vertical or horizontal bar chart.
Then, place the desired dimension on the opposite shelf to create the bar chart with percentage values.
How do I format a value as a percentage in Tableau?
To format a value as a percentage in Tableau, right-click on the field that you want to format on the Rows or Columns shelf or in the view itself.
Choose ‘Format…’, and in the Format pane that appears, click on the Numbers dropdown menu under the Axis or Pane tab, and select ‘Percentage.’
Adjust the number of decimal places as needed.


