
Does the thought of doing repetitive tasks in Excel or Power BI just exhaust you? Power Query is a solution! It’s a tool available in Excel, Power BI, and other apps that lets you collect, combine, and transform data.
Power Query is a data extraction and transformation tool made by Microsoft to help users connect, clean, and prepare data from various sources. It’s available across various Microsoft products and services, allowing for seamless data retrieval and manipulation in a no-code, user-friendly environment.
This comprehensive article aims to provide an in-depth understanding of Power Query, its history, features, and use cases, as well as guide readers through the process of setting up and utilizing the tool to transform data.

By the end, you will be well-equipped with the knowledge and skills necessary to harness the full potential of Power Query in your work.
Let’s get started!
What is Power Query?
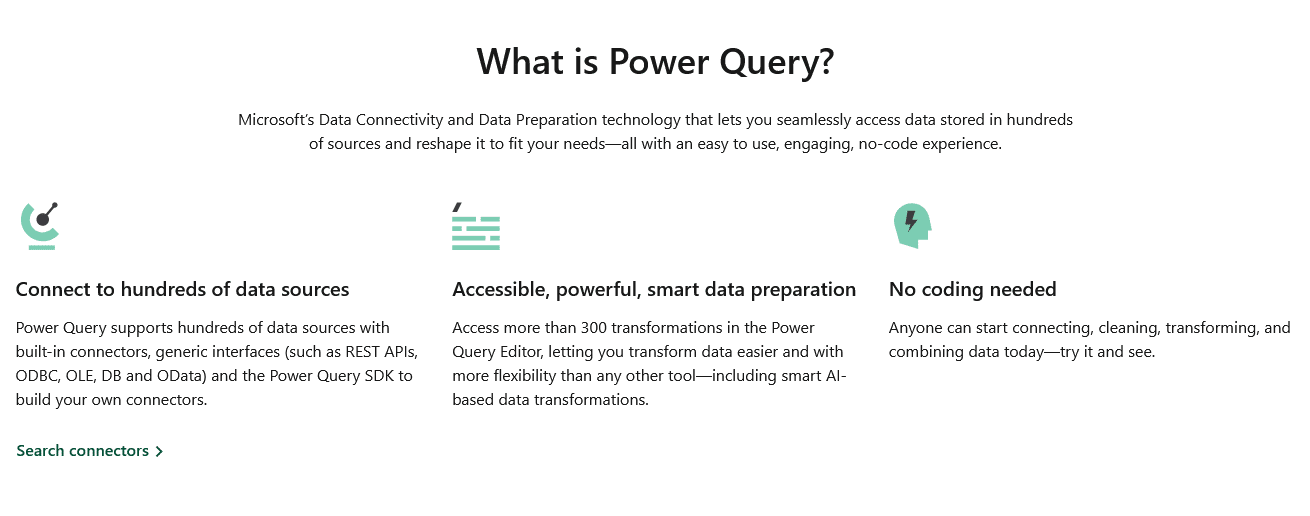
Power Query is a data transformation and preparation tool that was initially developed by Microsoft as a standalone add-in for Excel in 2010 to simplify importing, transforming, and cleaning data for analysis.
In 2013, Power Query was officially launched as an add-in for Excel 2010 and Excel 2013, and it quickly gained popularity among users for its ability to connect to a wide range of data sources and its intuitive user interface.
The success of Power Query prompted Microsoft to incorporate it as a built-in feature in Excel 2016 and subsequent versions, making it accessible to an even larger audience.
Over the years, Microsoft continued to invest in Power Query, adding new features and improving its performance to cater to the growing needs of data professionals.

Power Query today is a data transformation and data preparation engine that enables you to seamlessly access and import data from a wide range of sources, and then reshape and manipulate it to suit your needs.
Its primary function is to connect to hundreds of data sources, import the data, and then apply transformations such as removing columns, changing data types, or merging tables.
The transformed data can then be loaded into various Microsoft products like Excel, Power BI, Analysis Services, and Dataverse for further analysis, reporting, and visualization purposes.
But that’s enough with the introduction. Let’s dive into what Power Query can do for you in the next section!
What is Power Query Used for?
Power Query offers a wide range of features and capabilities that simplify the process of working with data, including:
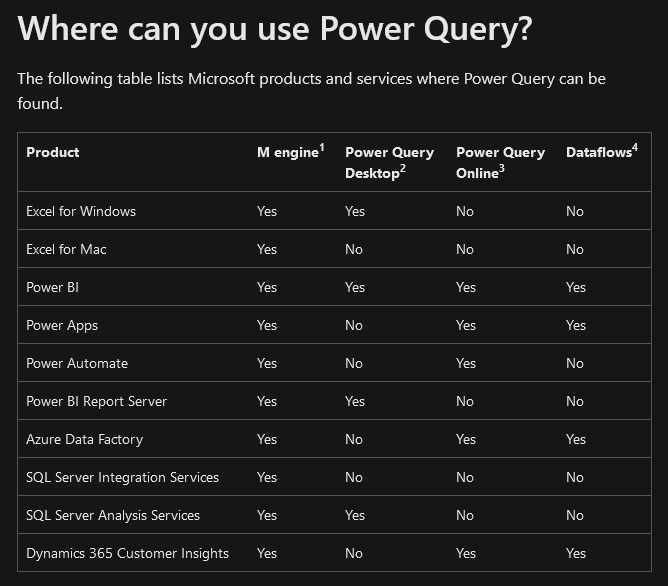
Connectivity: Power Query supports a broad array of data sources, including files, databases, online services, and custom connectors, making it easy for users to access and analyze data from various sources.
Data transformation: With an extensive library of built-in data transformation functions, Power Query allows users to perform complex data manipulation tasks, such as filtering, sorting, merging, pivoting, and aggregating data.
M language: Power Query uses the M language, a powerful and flexible scripting language, enabling users to write custom functions and queries to enhance data transformation capabilities further.
User-friendly interface: Power Query’s intuitive interface allows users to perform data transformation tasks with ease, without requiring extensive knowledge of programming or scripting languages.
Now that we’ve gone over what Power Query can do, let’s take a look at how you can set it up in the next section.
How Do You Set Up Power Query?
Alright, let’s get into the fun stuff — setting up Power Query! Whether you’re a data pro or just starting to dip your toes into the world of data wrangling, this is where the magic begins.
This section is your step-by-step guide to getting Power Query up and running in Excel and Power BI. We’ll cover how to open Power Query and set up your workspace so you’re ready to start cleaning, shaping, and playing with your data.
So buckle up, and by the end of this, you’ll be all set to start making Power Query work wonders with your data. Let’s dive in!
System Requirements
To use Power Query effectively, ensure that your system meets the following requirements:
Microsoft Excel: Excel 2010 or later with the Power Query add-in installed (for Excel 2010 and 2013), or Excel 2016 and later with built-in Power Query functionality.
Power BI: Power BI Desktop or Power BI service with Power Query integrated.
Power Query Installation Process for Excel and Power BI
Before you can start using Power Query, we need to make sure you have it set up and ready to roll in Excel and Power BI. Don’t sweat it though — it’s a pretty straightforward process!
In this section, we’re going to walk you through each step to get Power Query up and running in both Excel and Power BI.
1. Power Query Installation in Excel
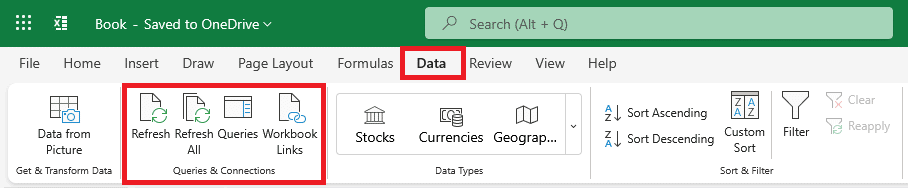
For users with Excel 2016 or later, Power Query is built-in and can be accessed through the “Data” tab in the Excel ribbon. Power Query is known as “Get & Transform” in Excel.
For users with Excel 2010 or Excel 2013, Power Query needs to be installed as an add-in:
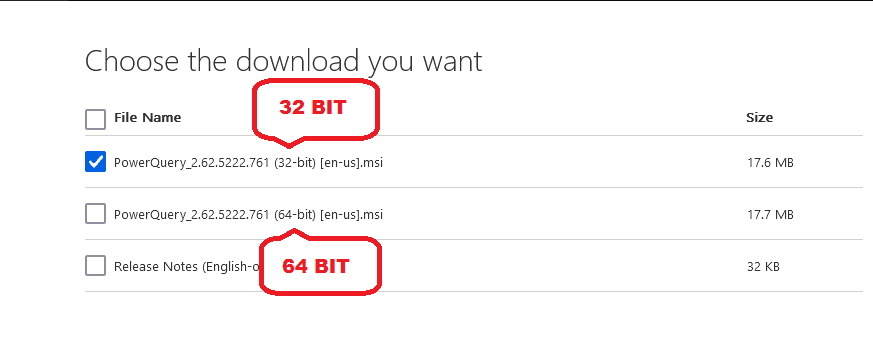
1. If you’re using Excel 2010, find out which version you’re using and whether it’s 32 or 64 bit

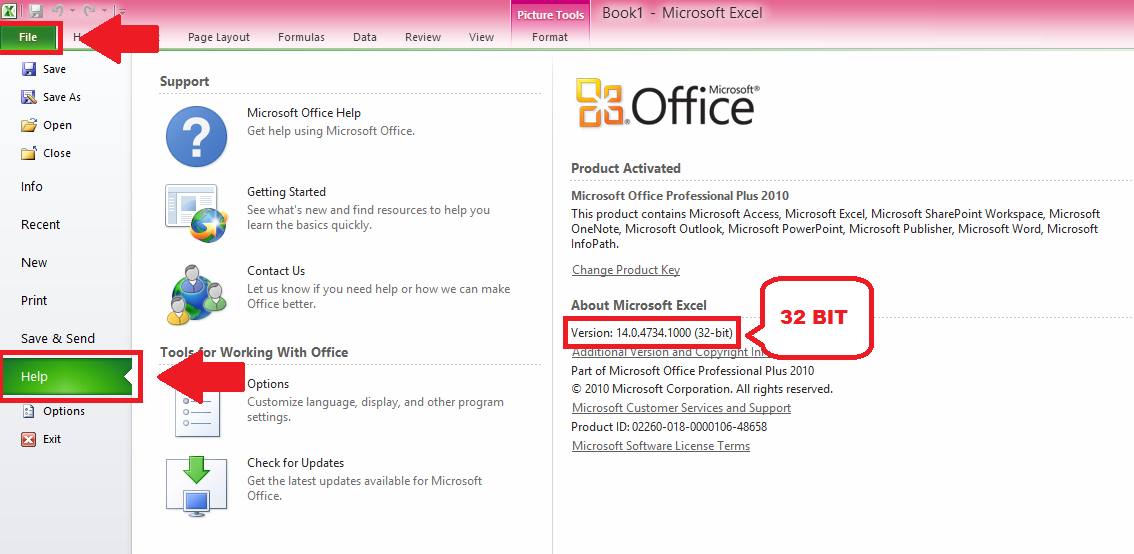
2. Visit the Microsoft Download Center and download the Power Query add-in for your specific version of Excel.
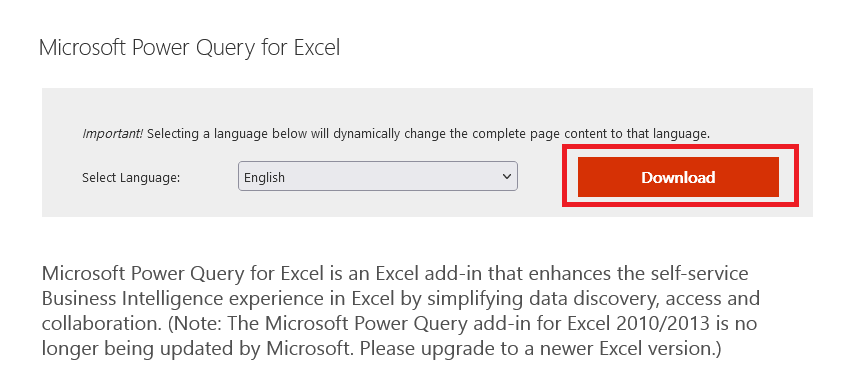
3. Choose the correct version of the add-in from the list
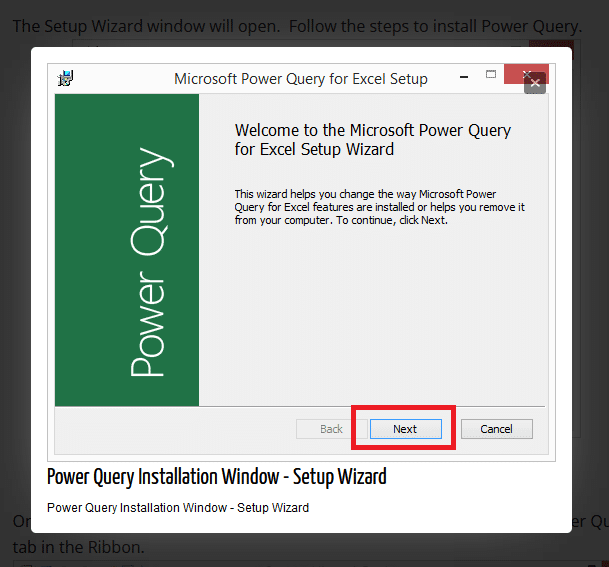
4. Run the downloaded installer to install the Power Query add-in
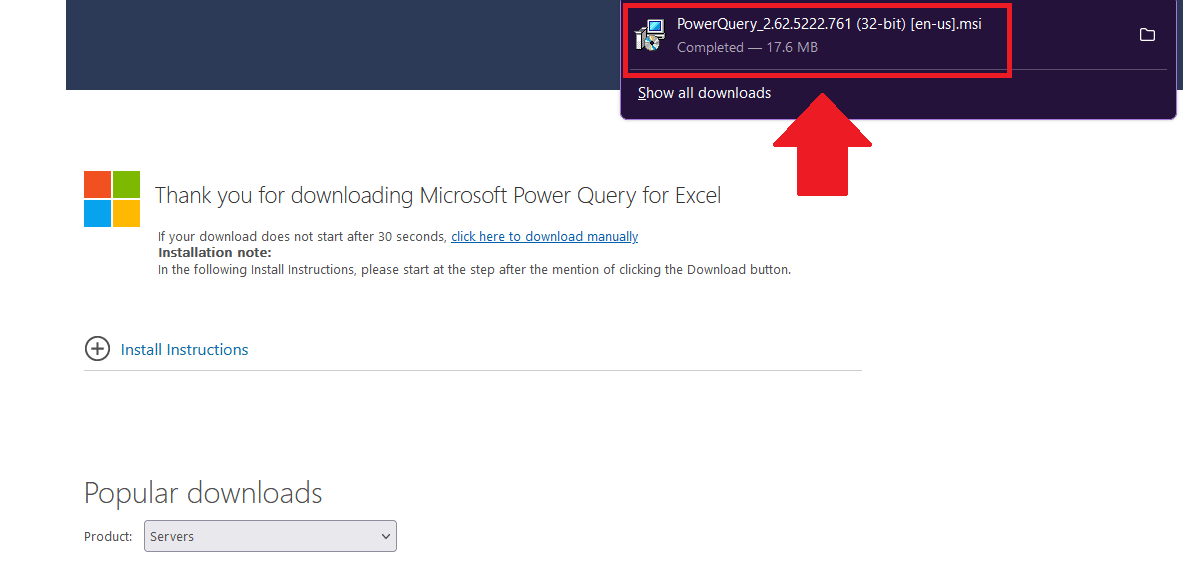
5. Follow the on-screen instructions to complete the installation
6. Open Excel, navigate to the “File” tab, then click on “Options.”
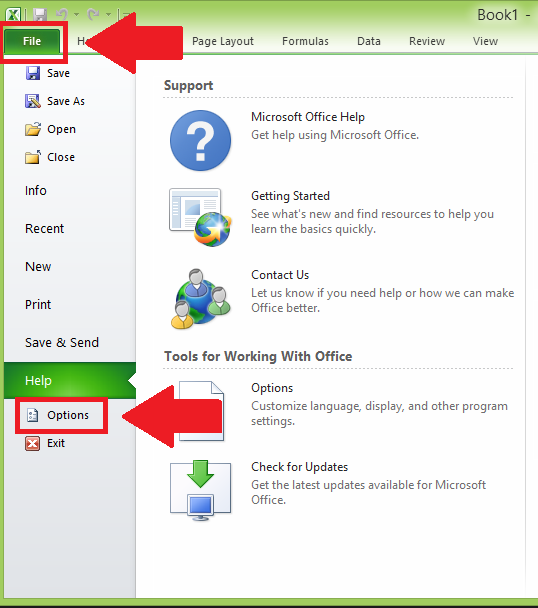
4. In the “Excel Options” dialog box, click on “Add-Ins” in the left pane. In the “Manage” drop-down list at the bottom of the dialog box, select “COM Add-ins” and click “Go.”
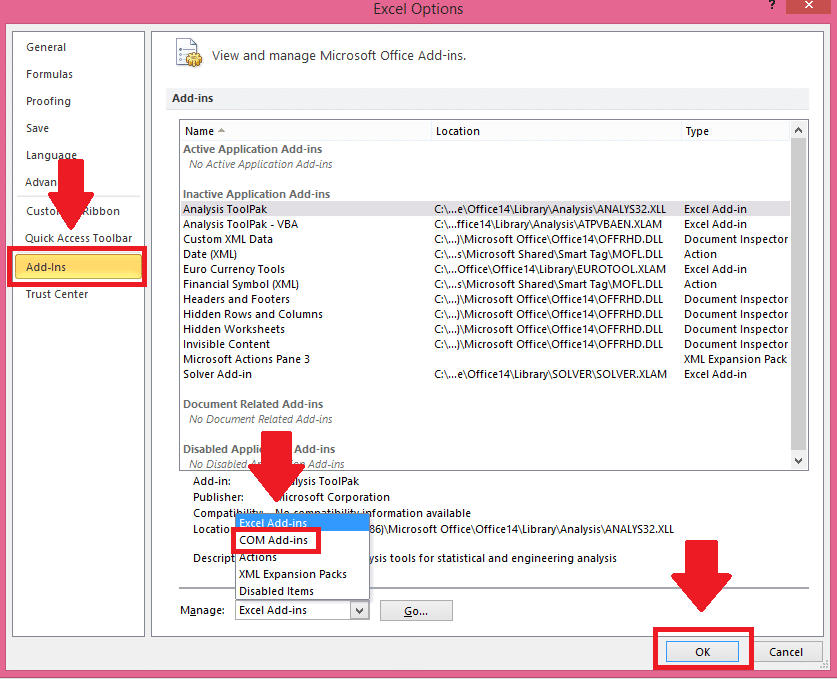
In the “COM Add-Ins” dialog box, check the box next to “Microsoft Power Query for Excel” and click “OK,” and that’s it! Power Query should now be available in Excel.
2. Power Query Installation in Power BI
For Power BI users, Power Query is already integrated into the Power BI Desktop application and can be accessed through the “Home” tab in the Power BI ribbon.
Here’s how you can access Power Query in Power BI:
1. Open Power BI Desktop: Launch Power BI Desktop on your computer. If you do not have it installed, you can download it from the official Microsoft website.
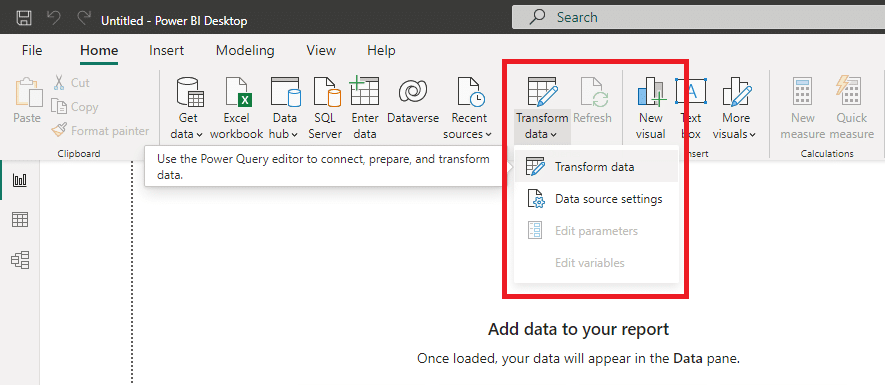
2. Get Data: On the Home ribbon, click on “Transform data” and this will open the Power Query Editor.
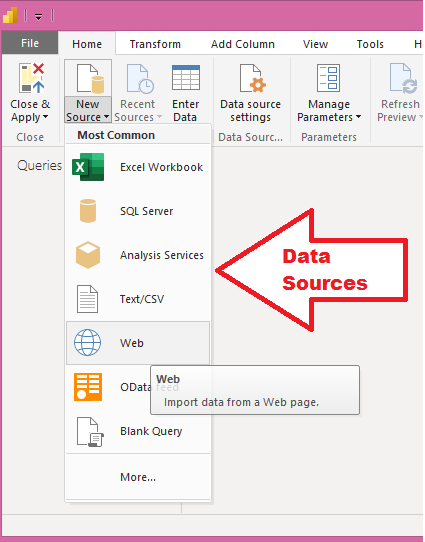
3. Choose a Data Source: From the Power Query Editor, select the type of data source you wish to connect to. You can choose from a wide range of options, such as databases, Excel files, Web pages, APIs, and more.
4. Connect to Data Source: Follow the prompts to connect to your selected data source. This may involve navigating to a file or inputting a URL, server name, or other connection details, depending on the type of data source.
5. Load Data: After connecting to the data source, you will be presented with a Navigator window where you can select the specific tables or elements you wish to import. Click “Load” to import the data directly into Power BI, or click “Edit” to open Power Query Editor and transform the data before loading.
6. Power Query Editor: In the Power Query Editor, you can perform a wide range of data transformation tasks, such as filtering and sorting data, merging and appending queries, creating calculated columns, and much more. After you’ve made your transformations, click “Close & Apply” to apply the changes and load the data into Power BI.
Remember, every step you take in Power Query is recorded, and you can always go back and modify these steps as needed!
How to Use the Power Query User Interface
So, you’ve got Power Query installed and ready to go — awesome! Now, let’s make sure you know your way around.
In this section, we’re going to explore the Power Query user interface, your command center for all things data transformation. We’ll break down the different parts of the interface and show you how to navigate it like a pro.
1. Navigation and Main Components
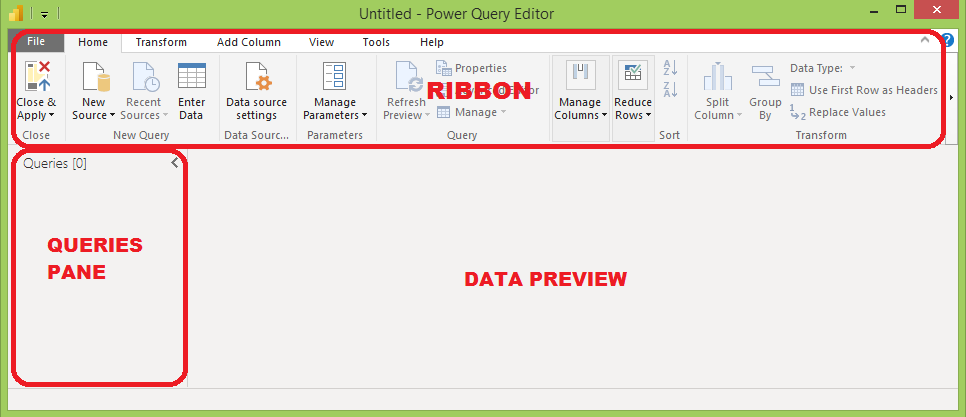
Power Query’s user interface is designed to be intuitive and user-friendly, making it easy for users to navigate and perform tasks within the tool. The main components of the Power Query interface include:
Ribbon: Located at the top of the screen, the ribbon contains various tabs and commands for performing common data transformation tasks, such as connecting to data sources, applying filters, and merging queries.
Queries pane: Located on the left side of the screen, the Queries pane displays a list of all the queries in your workbook or Power BI report. You can use this pane to manage, organize, and navigate your queries.
Data preview: In the center of the screen, the data preview displays a sample of the data from the selected query, allowing you to review and interact with the data as you apply transformations.
2. Query Editor
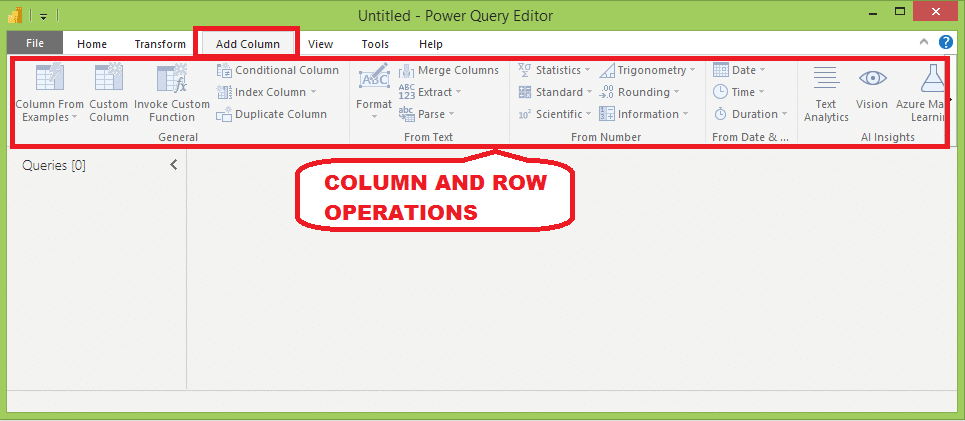
The Query Editor is the primary workspace for creating and editing queries in Power Query. It provides a visual interface for applying data transformations and shaping your data to meet your analysis needs.

Key features of the Query Editor include:
Column and row operations: You can easily add, remove, rename, reorder, and split columns or filter, sort, and remove rows using the Query Editor.
Applied Steps pane: Located on the right side of the screen, the Applied Steps pane displays a list of all the transformations applied to the selected query. You can use this pane to review, modify, reorder, or delete individual steps.
Context menus: Right-clicking on columns, rows, or cells in the data preview will display context menus with relevant transformation options, allowing you to quickly apply transformations without navigating through the ribbon.
3. Applied Steps Pane
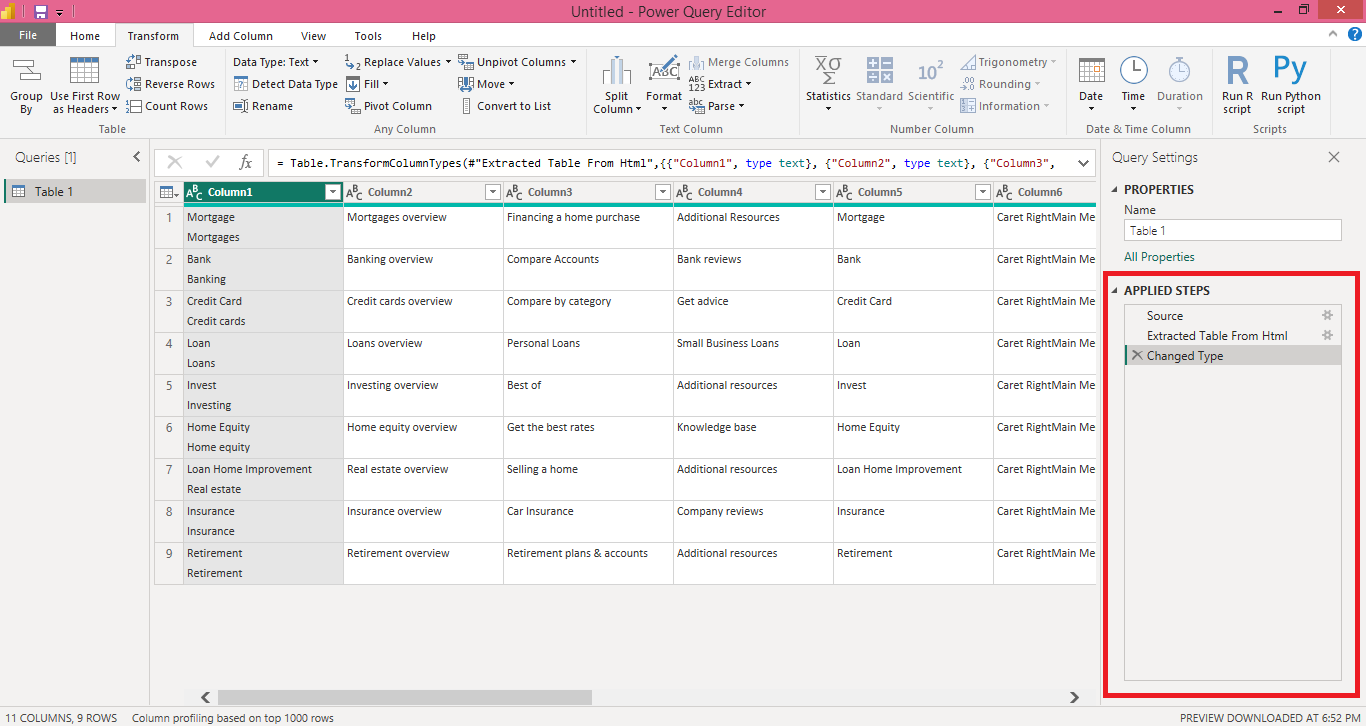
The Applied Steps pane is a handy component of the Power Query interface, as it provides a clear, step-by-step view of the transformations applied to your data.
This pane allows you to:
Review the transformation history: The Applied Steps pane displays a chronological list of all transformations applied to the selected query, making it easy to review and understand the data transformation process.
Modify existing steps: By clicking on a step in the Applied Steps pane, you can modify the associated transformation or change its settings, updating the data preview accordingly.
Reorder or delete steps: You can drag and drop steps within the Applied Steps pane to change their order or use the “X” button next to a step to delete it from the query.
4. Formula Bar and Advanced Editor
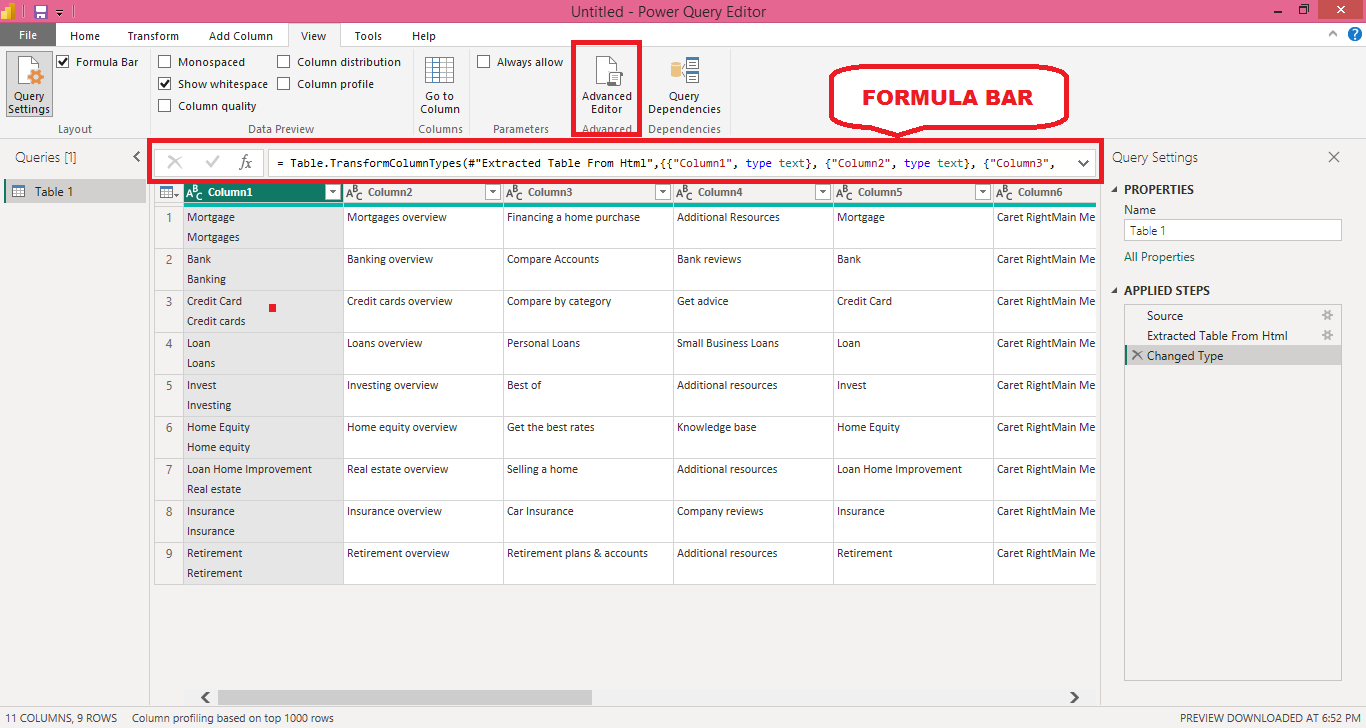
Power Query provides two additional features for users who prefer working with the M language directly:
Formula Bar: Located above the data preview, the Formula Bar displays the M language formula for the selected transformation step. You can edit the formula directly in the Formula Bar to modify the transformation, and the changes will be reflected in the data preview.
Advanced Editor: Accessible from the “View” tab in the ribbon, the Advanced Editor allows you to view and edit the entire M language script for the selected query. This feature is particularly useful for advanced users who want to write custom functions, create complex queries, or optimize their M language code.
By understanding and utilizing Power Query’s user interface and its various components, you can efficiently perform data transformation tasks and shape your data to meet your analysis needs.
Next, we take a look at how you can connect to different data sources using Power Query. Let’s go!
How Do You Connect to Data Sources Using Power Query?
Power Query’s strength lies in its ability to connect to data sources, making it easy for you to access and analyze data from multiple platforms and formats.
In this section, we’ll discuss the process of connecting to different data sources using Power Query and explore some common connection options.
1. Connecting to File-Based Data Sources
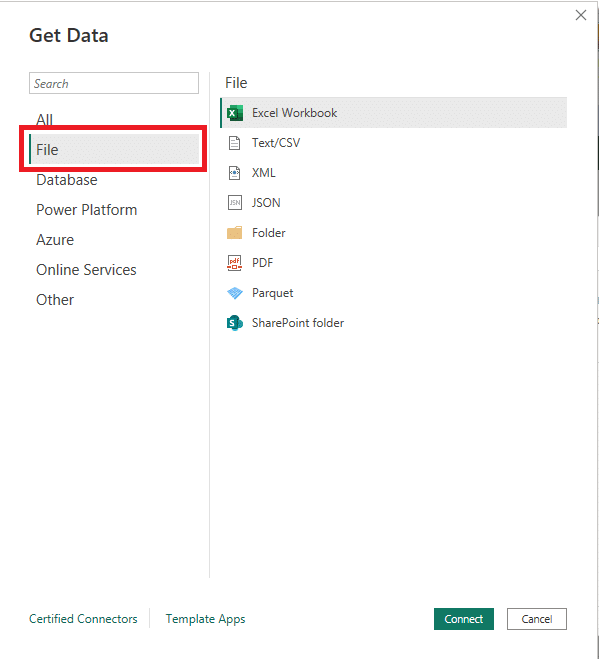
Power Query supports several file formats, including Excel, CSV, XML, JSON, and text files. To connect to a file-based data source:
In Excel or Power BI, click on the “Data” tab in the ribbon (for Excel) or the “Home” tab (for Power BI).
Choose “Get Data” and then select the appropriate file type from the “File” category.
Browse to the location of the file on your computer or network, and click “Open” to establish a connection.
2. Connecting to Database Data Sources
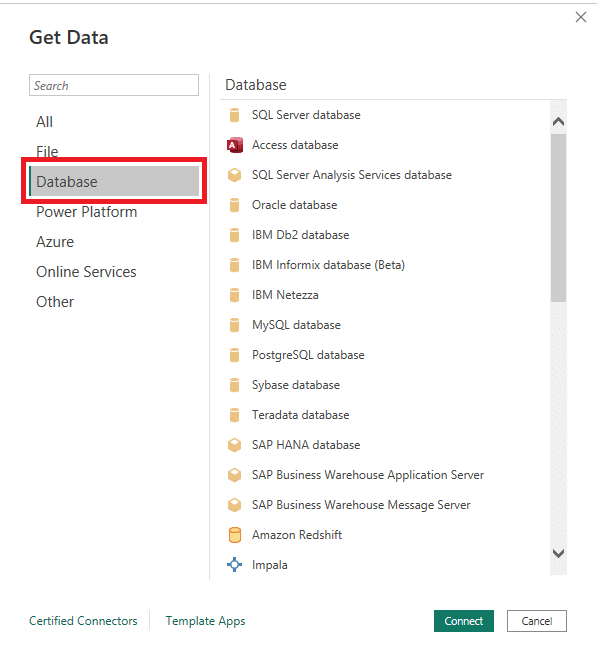
Power Query can connect to databases like SQL Server, Access, Oracle, MySQL, and PostgreSQL. To connect to a database:
In Excel or Power BI, click on the “Data” tab in the ribbon (for Excel) or the “Home” tab (for Power BI).
Choose “Get Data” and then select the appropriate database type from the “Database” category.
Enter the required connection information, such as server name, database name, and authentication credentials, and click “Connect” to establish a connection.
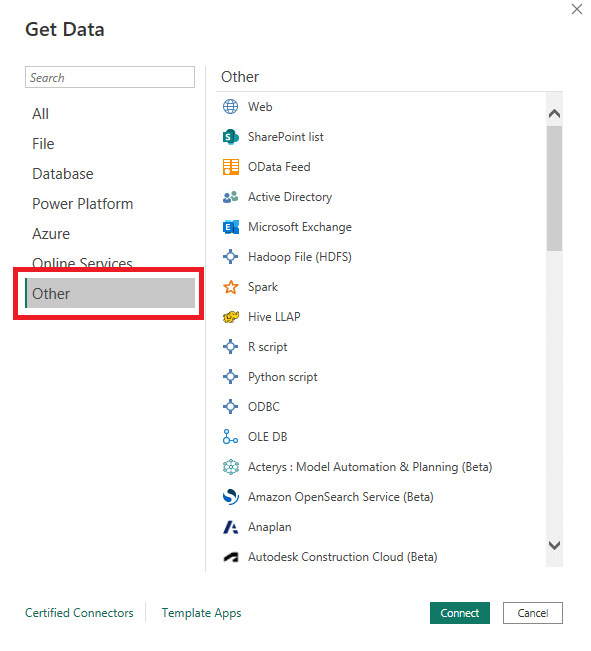
3. Connecting to Online Services and APIs
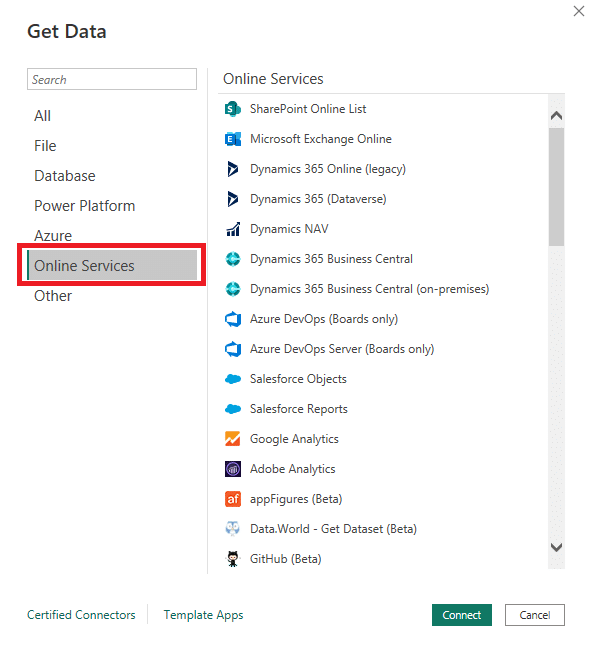
Power Query can also connect to online services, such as SharePoint, Salesforce, OData feeds, REST APIs, or even a website. To connect to an online service or API:
In Excel or Power BI, click on the “Data” tab in the ribbon (for Excel) or the “Home” tab (for Power BI).
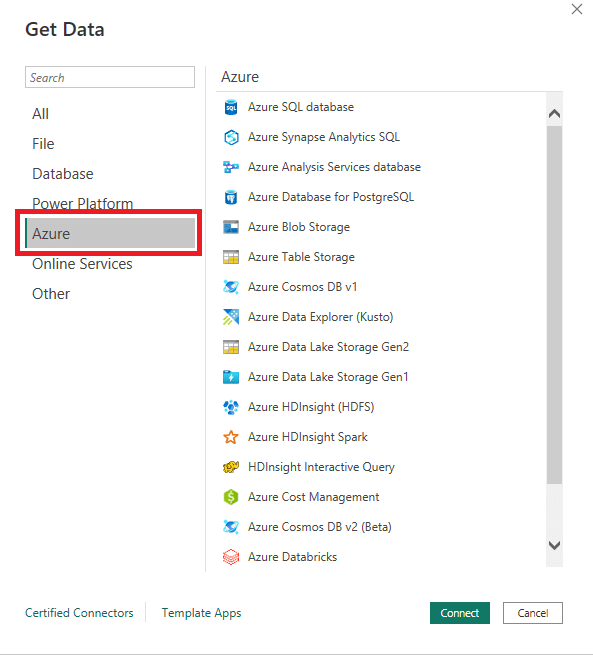
Choose “Get Data” and then select the appropriate service or API from the “Online Services” or “Other” category.
Provide the required connection information, such as the URL, API key, or authentication credentials, and click “Connect” to establish a connection.
4. Creating Custom Connectors
If Power Query does not natively support a specific data source, you can create a custom connector to extend its functionality. Custom connectors are developed using the Power Query SDK and the M language and can be shared with other users.
To create a custom connector:
Download and install the Power Query SDK from the Visual Studio Marketplace.
Open Visual Studio, create a new Power Query Connector project, and follow the project template to develop your custom connector.
Compile the connector and distribute it to other users as a .mez file.
In Excel or Power BI, enable custom connectors by navigating to “File” > “Options and settings” > “Options” > “Security” (for Power BI) or “File” > “Options” > “Trust Center” > “Trust Center Settings” > “Trusted Add-ins Catalog” (for Excel).
Add the .mez file to the appropriate folder, and restart Excel or Power BI to make the custom connector available in the “Get Data” dialog.
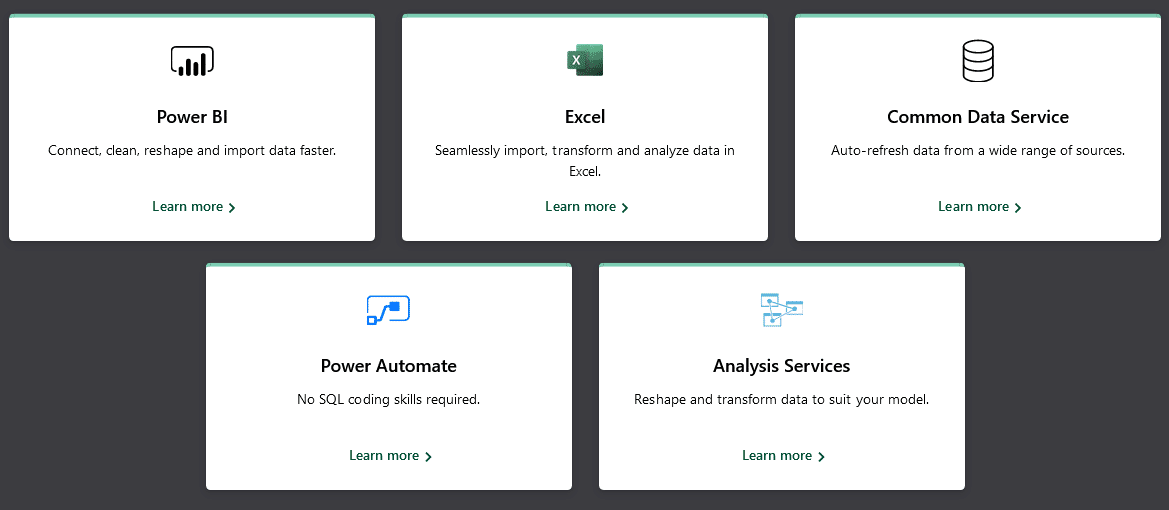
How Do You Integrate Power Query with Other Tools?

Power Query is a versatile tool that can be integrated with various other tools and platforms to streamline your data analysis workflow.
In this section, we will explore some common integrations and explain how to combine Power Query with other tools for enhanced functionality and efficiency.
1. Integration with Excel
As a native feature in Excel 2016 and later versions, Power Query is tightly integrated with Excel’s data analysis capabilities.
By using Power Query in conjunction with Excel, you can:
Load transformed data into Excel tables or the Excel Data Model for further analysis, visualization, or reporting.
Leverage Excel formulas and functions to perform additional calculations or transformations on your data.
Create PivotTables and PivotCharts based on the data imported and transformed using Power Query.
Utilize Excel’s conditional formatting and data validation features to enhance data visualization and maintain data integrity.
2. Integration with Power BI Desktop
Power Query is an integral part of the Power BI ecosystem and plays a crucial role in the data preparation process.
By integrating Power Query with Power BI, you can:
Load transformed data into the Power BI data model for further analysis and visualization.
Combine Power Query with Power BI’s advanced data modeling and DAX (Data Analysis Expressions) language for more sophisticated calculations and measures.
Use Power BI’s rich visualization capabilities to create interactive reports and dashboards based on the data imported and transformed using Power Query.
Leverage Power BI’s sharing and collaboration features to distribute your reports and dashboards to stakeholders.
3. Integration with Power Automate
Power Automate (formerly known as Microsoft Flow) is a cloud-based service that enables users to create automated workflows between various applications and services.
By integrating Power Query with Power Automate, you can:
Automate data refresh processes in Power Query by triggering them through events or schedules in Power Automate.
Export transformed data from Power Query to other applications, such as SharePoint, OneDrive, or SQL Server, using Power Automate connectors.
Create multi-step workflows that include Power Query data transformations, along with actions from other applications and services.
4. Integration with Azure Data Factory
Azure Data Factory is a cloud-based data integration service that allows you to create, schedule, and manage data pipelines.
By integrating Power Query with Azure Data Factory, you can:
Incorporate Power Query data transformations as part of your Azure Data Factory pipelines, allowing you to preprocess and clean your data before loading it into data stores or analytical services.
Schedule and automate Power Query data transformations alongside other data movement and transformation activities in Azure Data Factory.
Leverage Azure Data Factory’s monitoring and alerting capabilities to track the progress and performance of your Power Query data transformations.
5. Integration with Custom Applications and Services
Power Query can also be integrated with custom applications and services using the Power Query SDK and M language.
By developing custom connectors or embedding Power Query functionality within your applications, you can:
Enable users to connect to proprietary data sources or APIs not natively supported by Power Query.
Embed Power Query data transformation capabilities directly within your application’s user interface, providing a seamless experience for your users.
Leverage the M language and Power Query SDK to create custom functions or transformations specific to your application’s requirements.
By integrating Power Query with other tools and platforms, you can create a streamlined and efficient data analysis workflow that leverages the strengths of each tool and enhances overall functionality.
Is Power Query the Same as SQL?
Power Query and SQL (Structured Query Language) are both used for data manipulation and retrieval, but they serve different purposes and operate in distinct ways.
In this section, we will explore the similarities and differences between Power Query and SQL, and help you understand when to use each tool in your data analysis workflows.
What is SQL?
SQL is a domain-specific language designed for managing and querying relational databases. It allows users to create, read, update, and delete data in a structured and efficient manner.
SQL has been the standard language for working with relational databases since the 1970s and is widely adopted across various database management systems (DBMS) such as MySQL, SQL Server, Oracle, and PostgreSQL.
Comparing Power Query and SQL

Let’s do some comparing and contrasting! How does Power Query stack up against SQL?
In this section, we’re going to put Power Query and SQL side by side to see how they differ and where each shines. Let’s dive in!
1. Purpose and Use Cases
While both Power Query and SQL are used for data manipulation and retrieval, they cater to different use cases.
Power Query is a data transformation and integration tool that primarily focuses on cleaning, reshaping, and combining data from various sources.
SQL, on the other hand, is a language specifically designed for querying and managing relational databases.
2. User-friendliness
Power Query is known for its user-friendly interface and intuitive features, making it accessible to users with varying levels of technical expertise.
SQL, while powerful, requires users to have a deeper understanding of relational databases and the SQL language itself.
3. Data Sources and Formats
Power Query supports a wide range of data sources and formats, including relational databases, flat files (e.g., CSV, Excel), and web-based sources (e.g., APIs, web pages).
SQL, by contrast, is limited to querying data stored within relational databases.
4. Integration with Other Tools
Power Query is tightly integrated with the Microsoft ecosystem, including Excel, Power BI, and the Power Platform.
SQL, while widely adopted across various DBMS, does not offer the same level of seamless integration with data analysis and visualization tools.
5. Language and Syntax
Power Query uses the M language, a functional and case-sensitive language, for expressing data transformations.
SQL has its own distinct syntax, based on a combination of keywords, clauses, and expressions.
Speaking of the M language, let’s take a quick look at what it can do for you in the next section!
What is the Power Query M Language?

Power Query is a powerful tool designed for data transformation and preparation. At its core, the data manipulation engine of Power Query runs on the M language.
M is a functional language, specifically tailored for transforming and shaping data from various sources into the desired output.
The M language is used to express data mashups and operations carried out within Power Query. Although Power Query comes with a user-friendly graphical interface, understanding the M language provides additional flexibility when working with complex data transformation tasks.
For those seeking to dive deeper into the functionality and syntax of M, there are a plethora of functions available, each with a specific purpose. Some common functions in Power Query M language include:
Table.AddColumn – Adds a new column with specified names and values to a table.
Table.SelectRows – Filters rows in a table based on a certain condition.
Table.Join – Combines rows of two tables using a specified join condition.
List.Sum – Returns the sum of all numbers in a list.
In addition to these functions, Power Query provides an Advanced Editor where users can access and modify the underlying M script for their query. This editor enables the user to fine-tune transformations and apply custom functions as needed.
As Power Query and M language continue to evolve, its capabilities expand, and its range of supported data sources grows.
The ability to harness the M language in combination with Power Query’s user-friendly interface opens doors to more advanced, efficient, and customizable data transformations.
To learn more about how to use Power Query and the M language, check out the video below:
5 Real-World Power Query Use Cases

Power Query can be applied to a wide range of real-world scenarios.
In this section, we will discuss some common real-world use cases for Power Query and show you its practical applications and benefits.
1. Data Cleaning and Preprocessing
One of the most common use cases for Power Query is data cleaning and preprocessing. You can leverage Power Query to:
Remove unwanted columns or rows from datasets, ensuring that only relevant data is used in the analysis.
Split or merge columns to create new data fields or consolidate information.
Standardize data formats, such as date and time, currency, or text capitalization, to ensure consistency across the dataset.
Identify and handle missing or erroneous data values, either by replacing them with default values or removing the affected records.
2. Data Consolidation and Transformation
If you want to consolidate and transform data from multiple sources, then look no further. Some real-world applications of Power Query in this area include:
Combining data from multiple files, such as Excel workbooks or CSV files, into a single dataset for analysis.
Integrating data from various databases, APIs, or online services, such as Salesforce, SharePoint, or Google Analytics, to create a unified view of your organization’s data.
Performing complex data transformations, such as pivoting, unpivoting, aggregating, or grouping, to reshape the data for specific analytical requirements.
Merging or appending datasets to create relationships between different data sources or expand the scope of your analysis.
3. Data Validation and Quality Assurance

Power Query can be used to perform data validation and quality assurance tasks to ensure that your data is accurate, complete, and reliable. Some examples include:
Implementing data validation rules, such as range checks, pattern matching, or custom logic, to identify and correct data entry errors.
Comparing and reconciling data from different sources, such as verifying transaction data against bank statements or comparing sales data across different systems.
Detecting and investigating data anomalies, outliers, or inconsistencies to identify potential issues in your data or business processes.
Automating data quality checks and generating validation reports to monitor and maintain data quality over time.
4. Automating and Scheduling Data Refresh Processes
If you’re looking to automate and schedule data refresh processes to ensure that your analyses and reports are based on the most up-to-date information, then Power Query may be a solution. Some practical applications in this area include:
Automating the retrieval and transformation of data from APIs or online services, such as daily exchange rate updates or monthly sales data.
Scheduling periodic data refreshes in Power BI or Excel to keep reports and dashboards current and relevant.
Integrating Power Query with tools like Power Automate or Azure Data Factory to create sophisticated data workflows that automatically refresh and preprocess data as needed.
5. Ad-hoc Data Analysis and Reporting
Power Query can be used for ad-hoc data analysis and reporting tasks, allowing you to quickly explore and analyze data without the need for complex data modeling or programming. Some examples of ad-hoc analysis and reporting use cases include:
Extracting and summarizing data from log files, survey responses, or user-generated content for quick insights and decision-making.
Creating custom reports or visualizations based on specific business questions or requirements, without relying on pre-built templates or dashboards.
Performing exploratory data analysis to identify trends, patterns, or relationships in your data that can inform further research or investigation.
These real-world use cases demonstrate the versatility and power of Power Query as a data preparation and analysis tool, capable of addressing a wide range of scenarios and requirements across various industries and applications.
Of course, like with any technology, there is a learning curve. To help you on your journey to Power Query mastery, we’ve compiled some helpful resources in the next section!
3 Helpful Power Query Learning Resources

In this section, we’ll discuss some helpful resources for learning and utilizing Power Query effectively. These resources will be categorized into tutorials, documentation, and community support.
1. Tutorials
For those who are new to Power Query or want to enhance their skills, there are numerous tutorials available online. These tutorials can help users understand how to import, transform, and combine data from various sources. Some popular websites for Power Query tutorials include:
Microsoft Learn
These tutorials range from beginner to advanced levels, providing valuable insights and practical examples to help users become proficient in Power Query.
2. Documentation
The official documentation is a great resource for understanding the features and functionality of Power Query in depth. The following links can be used to access detailed documentation on various topics related to Power Query:
These resources are maintained by Microsoft and provide comprehensive information on everything from getting started with Power Query to advanced techniques for data transformation and preparation.
3. Community Support
When working with Power Query, users may have questions or encounter challenges that are not directly addressed in official documentation or tutorials. In such cases, community support can be invaluable.
There are various forums and online communities where Power Query users can ask questions, share knowledge, and collaborate with others. Some popular Power Query community platforms are:
Power Query community on Reddit
These community platforms allow users to seek help from experienced professionals, share solutions, and stay updated with the latest developments in the world of Power Query.
Final Thoughts

And there you have it! Power Query, in all its glory, is like your personal data wizard. It’s all about cleaning, shaping, and transforming raw data into something meaningful, straight from Excel or Power BI.
Power Query has become an indispensable tool for data professionals and enthusiasts alike, providing a powerful and user-friendly solution for data preparation and transformation tasks.
Its versatility and integration with the Microsoft ecosystem, including Excel, Power BI, and the broader Power Platform, make it a go-to choice for handling data from various sources, formats, and complexities.
So, don’t be a stranger to Power Query. It’s a friend you’ll want to keep close in your data journey. Keep exploring, stay curious, and remember, data is only as good as what you can do with it. Happy querying!


