
Are you looking to take your data analysis skills to the next level? Adding Power BI to Excel is a great way to do this. Power BI is an analytics platform that helps you create interactive visuals, discover insights, and tell compelling stories with your data.
To add Power BI to Microsoft Excel, select Excel as the data source in the import options. Doing so allows you to make a seamless connection between Power BI and Excel for sending data to and from Power BI.

With Power BI, you can get more out of your data by creating custom visuals and static reports, performing predictive analytics, and gaining insight into trends.

In this guide, we’ll walk you through the steps of adding Power BI to Excel and getting started. You’ll learn how to connect your data sources and use the Power BI visualizations to explore your data in more depth.
You’ll also discover how Power BI can help you share insights with colleagues and present them in a compelling way.
Let’s get into it!
What is Power BI Desktop?
Power BI is a suite of business analytics tools from Microsoft that allows you to visualize and analyze your data using Power BI datasets.
Using Power BI, you can create dashboards, Power BI reports, and interactive visuals that help you make better decisions.
With Power BI and Excel together, you can easily transform, clean, and sort data to gain insights into your business processes. You can also analyze data in Excel by importing Power BI datasets, making it even more convenient to work with your data.

By combining the flexibility of Excel with the power of Power BI, you can quickly generate powerful visualizations that are easy to share and use across different devices. This includes using Excel features to access data from Power BI and exporting Power BI data to an Excel file.
Power BI also offers advanced features such as natural language query (NLQ), which enables users to ask questions in plain text about their data instead of having to type out complex formulas. This makes it easy for anyone to interact with their Power BI data in an intuitive way.
What is Excel?
Excel is a powerful spreadsheet program that is used to manage data, create charts and graphs, manipulate formulas, and develop basic applications.
The program is designed to be user-friendly and intuitive, allowing users to quickly learn its features quickly and start making insights.
Microsoft Excel can also integrate with other applications such as Power BI, allowing users even more functionality. This is usually done through the Excel Plugin.
Adding the Power BI service to Excel is a great way to extend the reach of your documents by allowing you to easily import data from various sources and create visualizations that can be shared with colleagues or customers.
By utilizing the “Analyze in Excel” feature, you can access Power BI data and work with it directly in Excel.
Now that we’ve covered what these two tools can do, let’s take a look at the steps to follow to set them up in the next section.
4 Steps to Set Up Power BI Dashboard in Excel
Getting started with Power BI in your Excel worksheets is a simple process. Here are the detailed steps to take.
Step 1. Connect to Your Data Sources
Before you can begin using Power BI, you will need to connect to your data sources. This can be done by first logging into your Power BI account going to File > Get Data > Source and then clicking the ‘Connections’ button.
Select the type of data you would like to connect, such as a database or flat file, and then select the specific connection option (e.g., SQL Server).
The type of files that you can download include csv or xlsx files.
Step 2. Create an Analysis Worksheet
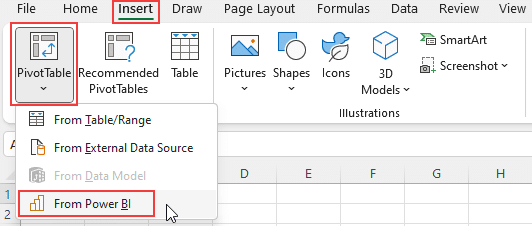
Once you have connected your data sources, you will need to create an analysis worksheet inside Excel. This can be done by navigating to Insert > Pivot Table > Power BI and selecting the option for a Power BI worksheet.
After this step is complete, you should now have an analysis worksheet ready for use inside Excel.
Step 3. Choose the Power BI workspace
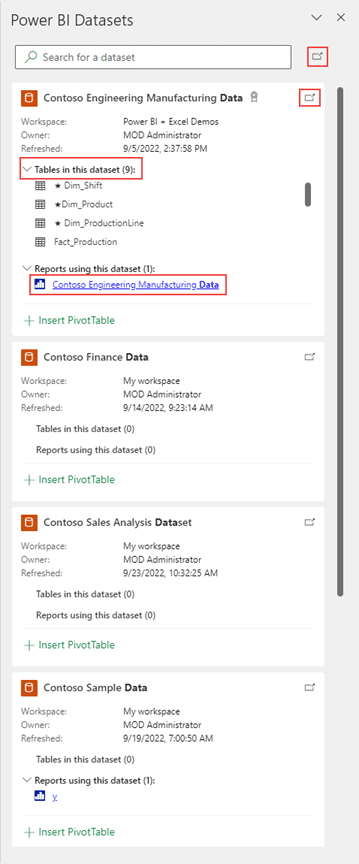
Now that your analysis worksheet is ready in Excel, it is time to choose the Power BI workspace you want to use!

A pane will open on the left side which will allow you to choose the workspace you want.
Step 4. Publish Your Workbook
The final step is publishing your workbook with all the data models and their new visualizations so that others can view it.
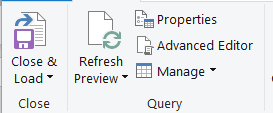
To do this, simply click File > Publish > Publish Selected Sheets and select a destination for where whole data models in your workbook should be published.
This is a way to also export workbook data and export data from underlying data models anywhere.
In the next section, we’ll take a look at how you can prepare and clean the data you export.
Preparing and Cleaning Data in Microsoft Excel
Once your dataset is imported into an Excel file, it’s time to prepare it for use within Power BI. There are two primary activities to prepare and clean your exported data from your export data set:
1. Sorting & Filtering
When sorting data, you can rearrange the rows or columns of data filtered in your database by alphabetical or numerical order. When filtering, you can restrict the data to show only the information you need.
Sorting and filtering will help to quickly organize and delete unnecessary sections in your database. It also enables easier searching for specific values or records, as well as formulating organized visualizations.
2. Data Validation
Data validation is used to ensure the accuracy of data entered into a spreadsheet by using formulas to check for correct input types.
For example, if a field requires a date format, when someone enters “10-20-2020” instead of “2020-10-20” it will alert them that there is an error in formatting.
Using data validation helps maintain consistency throughout a dataset and eliminates errors due to incorrect formatting or incorrect values being entered into the spreadsheet.
How to Connect Excel Files to Power BI
Adding a Power BI service report data back to your analysis in Excel is easy to do, and it opens up a wealth of data visualization and analysis capabilities that were previously out of reach.
When you connect your Excel file to access Power BI datasets, you can quickly gain insights from your data that would otherwise be hidden.
The best part? It only takes a few simple steps:
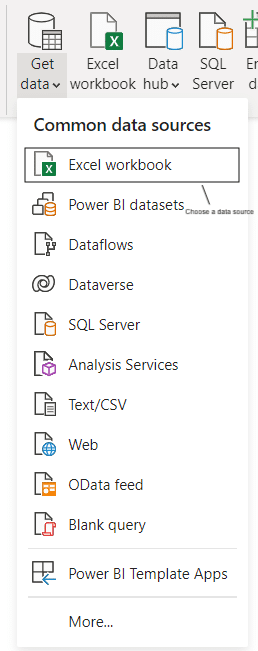
Step 1. Use the Get Data button and choose “Excel workbook” from the drop-down menu to get data from your Excel file. This will open the data tab for your Excel file in Power BI Desktop
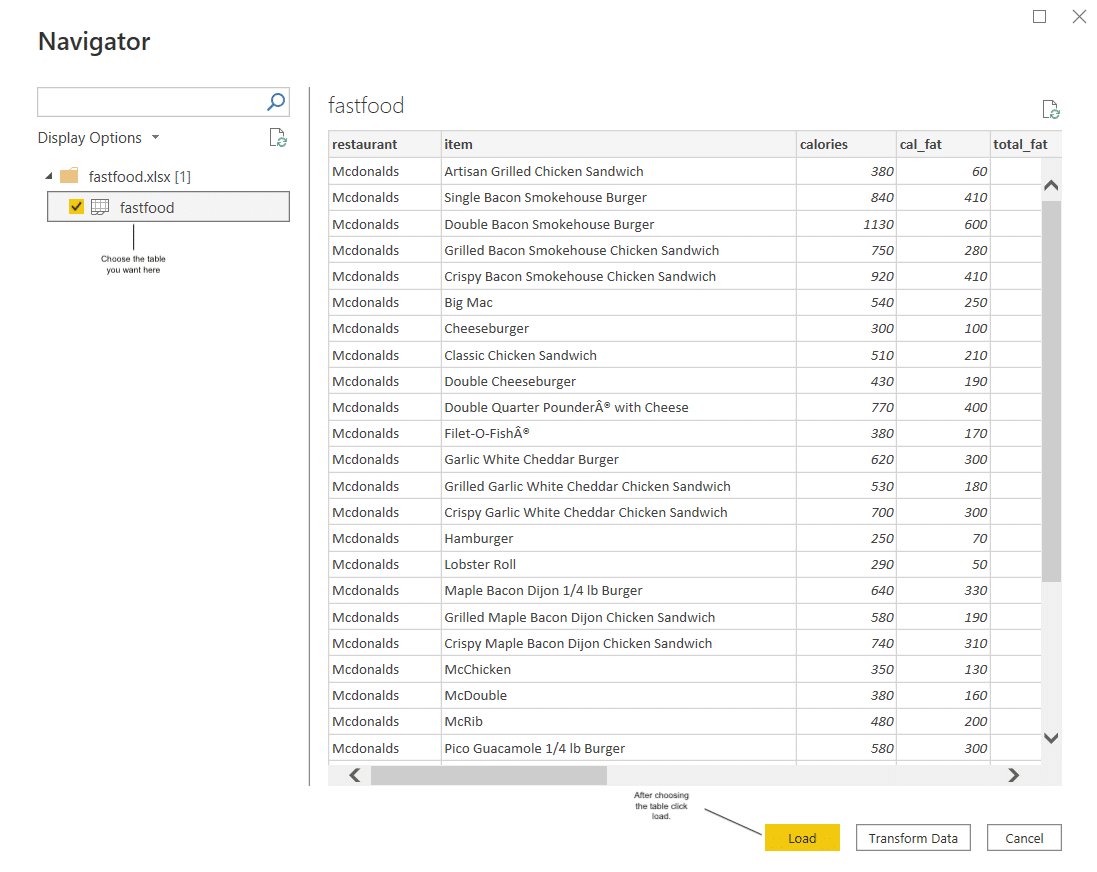
Step 2. Select the table or range or data model you want to export data in the Power BI report server. Connect the tables and load them into the Power BI report
Step 3. Generate visualizations and reports by dragging fields onto the canvas
Step 4. Publish the Power BI report to make it available online

And that’s it! You can finally choose to publish your report so that it’s available online. In the next section, we’ll take a look at some of the benefits of using Power BI with Excel.
3 Benefits of Using Power BI With Excel
Adding PowerBI to your Excel files has some major benefits, such as:
Creating visuals: With PowerBI, you can create visuals for your data to visualize trends, patterns, and correlations.
Access to different data sources: You can easily access a variety of data sources from within Excel, allowing you to make decisions based on the most up-to-date information.
Advanced data editing and filtering: Power BI provides features such as data filtering and query editing, which enables you to manipulate and drill down into large datasets with ease. Although the Excel pivot table is great, the Power BI visual also adds to the functionality and helps visualize whole data sets.
In short, the Power BI service integrates with Excel to provide you with a powerful toolset for data analysis and business intelligence.
Not only does it open up up-to-date data and the possibility of insights into your existing datasets, but it also helps you access external data sources quickly and efficiently.
The next section will outline the basic requirements for adding Power BI to Excel. Let’s get into it!
3 Basic Requirements for Adding Power BI to Excel
Adding Power BI to Excel is an incredibly useful tool that can transform your spreadsheets and provide valuable insights to businesses. However, there are a few basic requirements you’ll need to make the most of this powerful application.

1. Software Compatibility
Power BI can be integrated with Excel 2016 or later versions on Windows computers. Additionally, you need to ensure that your Microsoft Office 365 subscription includes Power BI Pro and Excel Online services. If you don’t have these already, they can be easily added.
2. Internet Access
As the Power BI service for desktops uses cloud-based technology, you’ll need access to the internet in order to use it. Without access to the internet, you won’t be able to connect your Excel spreadsheet with the Power BI service.
3. Authorizations Required
For users to successfully get up and running with Power BI on their local computer, they must first be authorized by their administrator as an analytics service administrator (ASA).
This will provide them with admin privileges so they can set up and manage content in their Power BI reports and dashboards.
Steps for Creating Power BI Arrays in Excel
Power BI arrays provide a powerful way to visualize data in Excel. With a few simple clicks, you can create dynamic charts and reports that update as your data changes.
To get started, you’ll need to open up an Excel file and insert an array into the worksheet. Here’s how:
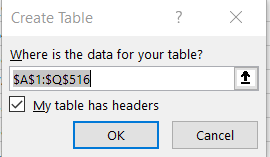
Step 1. Open Excel and go to the “Data” tab.

Step 2. Click on the “From Table/Range” button to load your own data directly into Power Query.
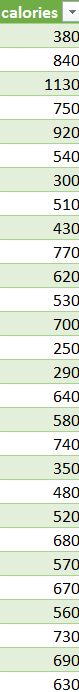
Step 3. In Power Query, select the column that you want to convert into an array.
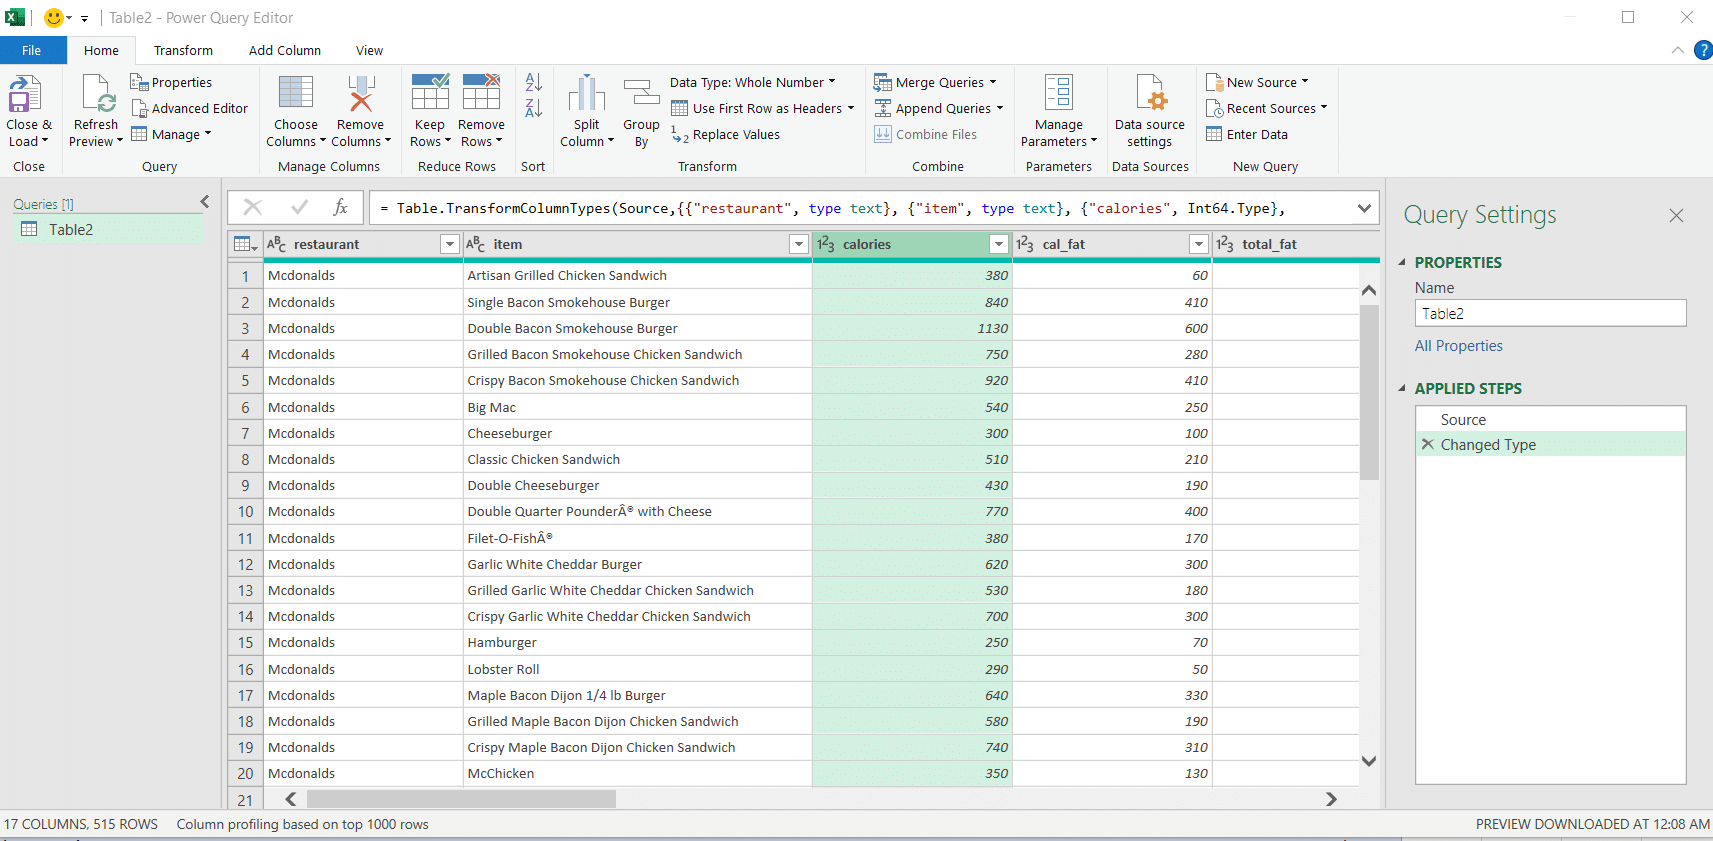
Step 4. Click on the “Transform” tab, and then click on the “Group By” button.

Step 5. In the “Group By” dialog box, select the column that you want to group by.
Step 6. In the “New column name” field, enter a name for your new array column.
Step 7. In the “Operation” column, select “All Rows.”
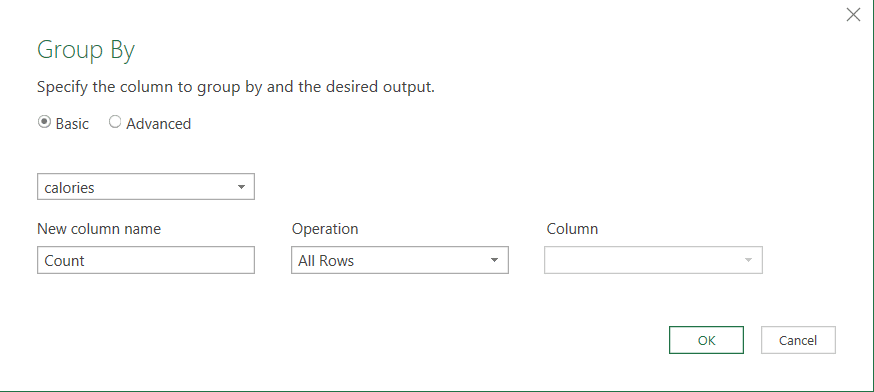
Step 8. In the “Column Name” column, select the column that you want to include in your array.
Step 9. Click on the “OK” button to create your array.
Step 10. Close the Power Query Editor and return to your Excel sheet.
Step 11. You should now see a new column in your table that contains arrays.
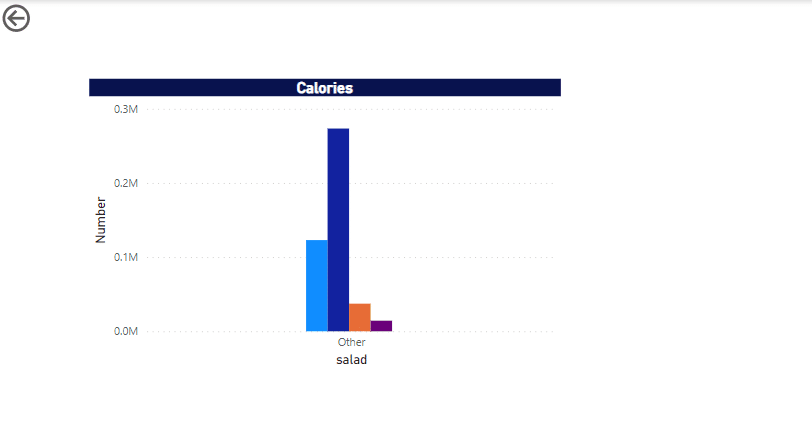
With Power BI arrays in your Excel file, you can quickly create charts, graphs, and other visuals that will update dynamically with any change in your underlying data itself — simplifying the process of gathering insights from large datasets!
Next, let’s take a look at how you can use Power BI to create visualizations.
How to Create Visualizations in Power BI
You’ve connected your Excel data to Power BI, but now what? The real value of Power BI lies in its ability to create interactive visualizations.
Visualizations with Power BI are a great way to explore your data, identify patterns and relationships, and tell stories with your data.
The Power BI dashboard offers many ways to visualize your data. Here are just a few of the most popular types of visualizations in Power BI:
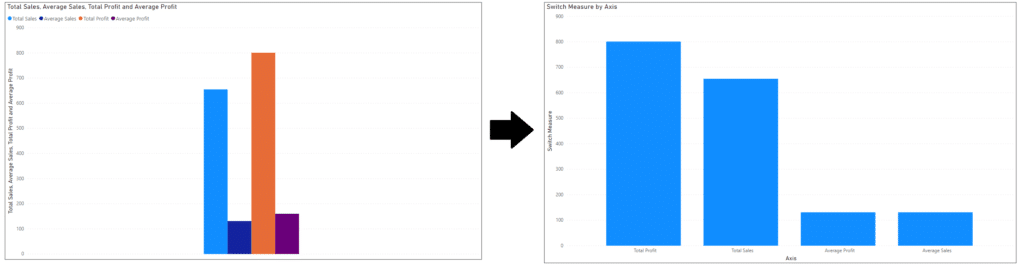
1. Bar Chart: A standard way to compare different categories of data
2. Pie Chart: Used when you’re comparing parts of a whole

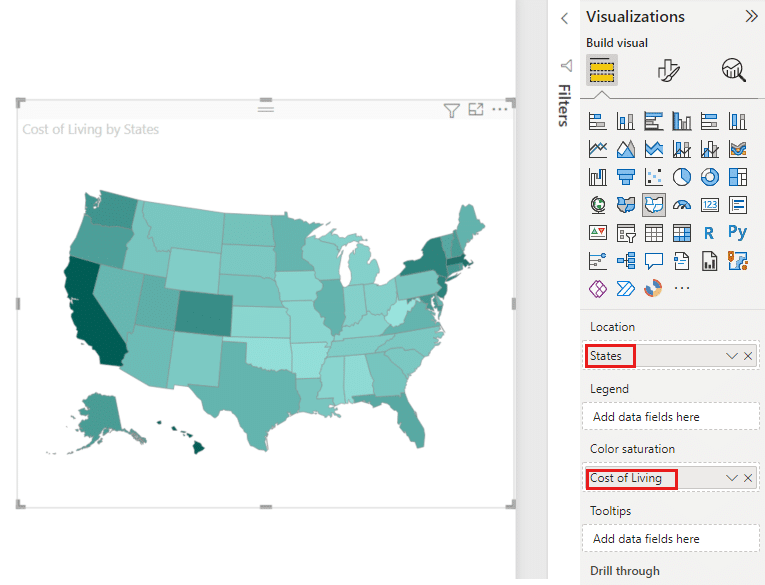
3. Map Visualizations: Used when you have geographic or spatial data that you want to map out and compare between different categories or locations
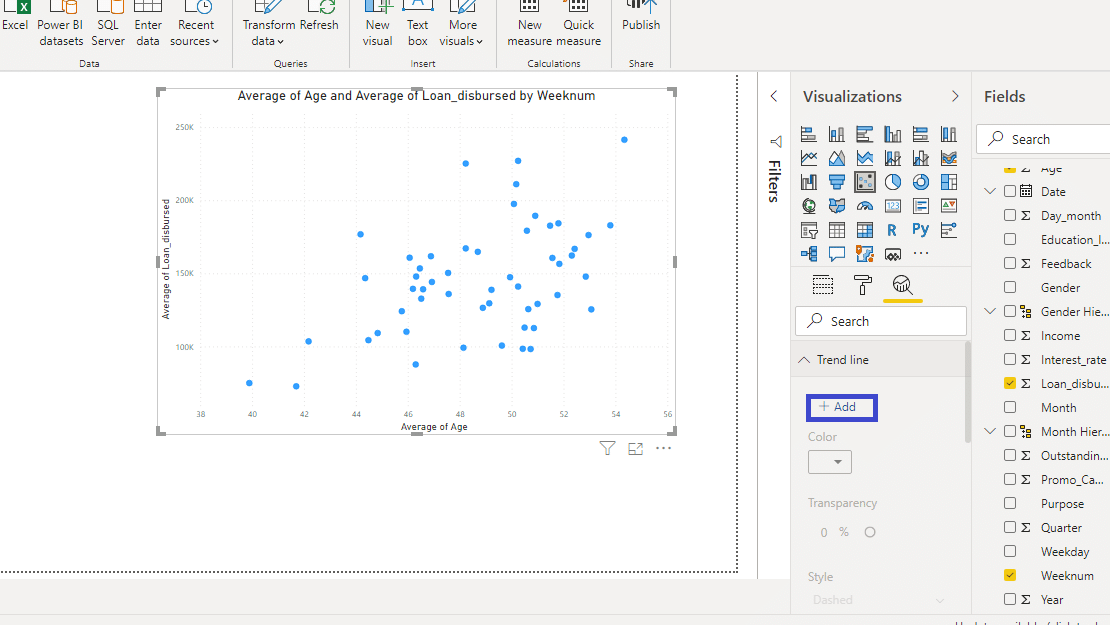
4. Scatter Plots: Used to identify relationships between two or more variables in a dataset
Power BI can create a variety of charts and graphs in power view, from using data in tabular format to plotting trends over time to identifying correlations or outliers in a group of data from a Power BI report, reports, datasets, reports, or data points.
Visualizations can help bring your data to life and show relationships between different elements of your dataset that might not be immediately obvious if looking at raw numbers or tables alone. So get creative and explore the possibilities with the Power BI desktop!
If you’d like to know more about specific examples of using Power BI with Excel, check the following video out:
Common Issues and Troubleshooting Power BI and Excel
Using Power BI and Excel together can be a powerful combination — allowing you to analyze data with the speed and precision of Power BI while still retaining the flexibility of Excel.

That being said, there are a few issues that you may run into when working with these two programs. We’re going to cover two of them: installation issues and data refresh errors.
1. Installation Issues
If your installation of Power BI encounters any errors, here are some of the most common solutions:
Restart your computer
Update or reinstall the appropriate software
Uninstall conflicting applications that may interfere with Power BI
Run in compatibility mode (for older versions of Windows)
Contact Microsoft Power BI Support if none of these methods work
2. Data Refresh Errors
Another common issue is data refresh errors. This error message occurs when the Power BI data back service is unable to get data from your Excel file or another external source due to an internet connection issue or incorrect credentials.
To troubleshoot this issue, try these steps:
Check your internet connection to ensure that it is stable and secure
Check that you have entered the correct credentials for your data source
Try refreshing the data manually
Try re-authenticating the connection with your data source
Final Thoughts
In conclusion, integrating Power BI into Excel can be a useful tool for any data analyst, creating the potential to increase their efficiency and broaden their analytical capabilities.
Now that you understand the process of adding Power BI to Excel, you can begin using this powerful platform to unlock the insights within your data.
With the right strategies and techniques, you can create powerful Power BI dashboard pivot charts, reports, and more that can help your organization make more informed decisions and provide more accurate insights!


