
Many people believe that we cannot perform Power BI custom sort using DAX, but that is not true. DAX can absolutely guarantee sort, and it’s actually pretty simple to do. In today’s blog, I will show you how you can easily do exactly that. You can watch the full video of this tutorial at the bottom of this blog.
Our Data Model
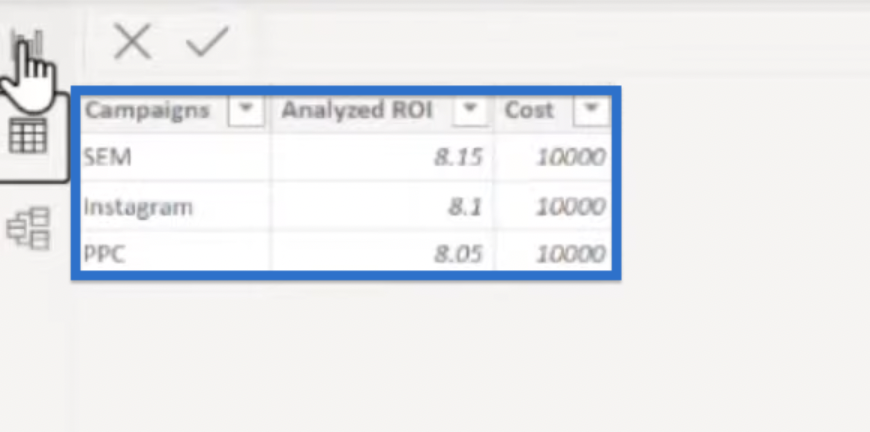
Let’s start with a simple data model. Our data table has three Campaigns, Analyzed ROI, and Cost.

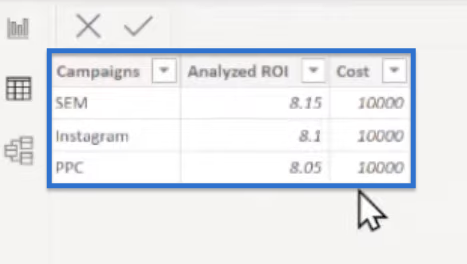
As you can see in the table, they have the same costs but their ROIs are different. The concept here is to know which campaigns we should run depending on their ROIs for a given budget.
Power BI Custom Sort: Using The While Loop
Let’s start with a measure with a simple while loop.
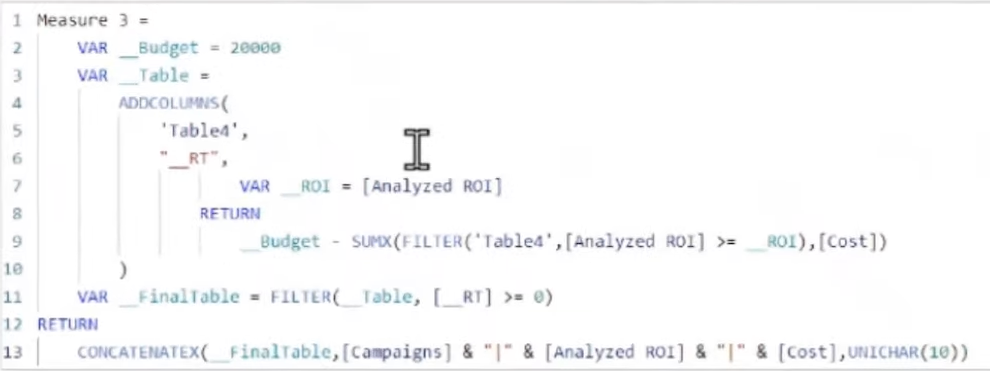
We’ll set our budget at 20000 and save it in the Budget variable using VAR_Budget.

And then we’ll use the while loop by creating a Table variable VAR_Table.

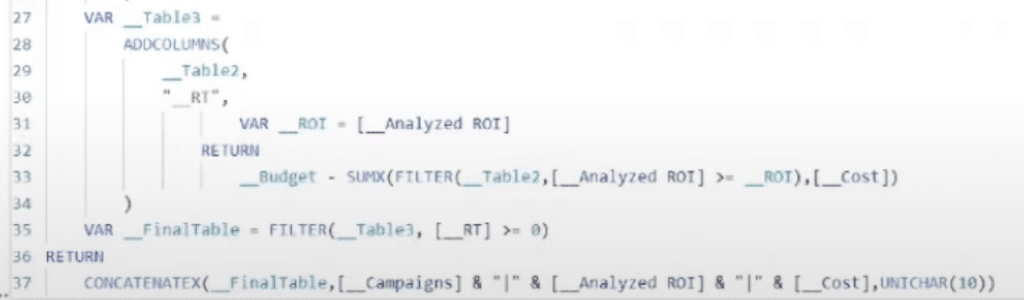
We then use ADDCOLUMNS that go against our base Table 4 and add a running total column using “_RT”.

Next, we grab the [Analyzed ROI] in our current row saved as VAR_ROI. Then, we take our Budget. From it, we subtract SUMX, filter Table 4 for the Analyzed ROI that is greater than or equal to the ROI that we grab for our current row, and grab the [Cost].
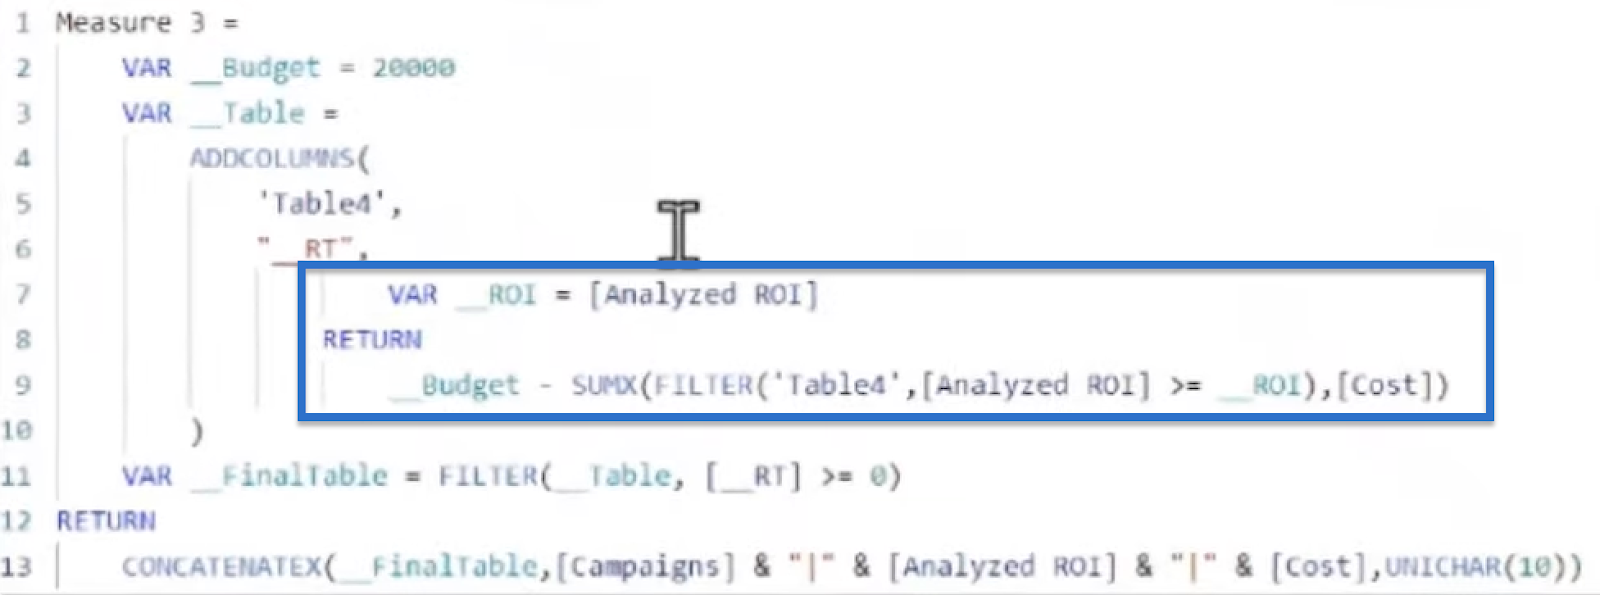
These lines will take the highest ROI in the first row, then the next highest for the next row, and so on. So essentially, we’ll have a column that’s a running total counting down to zero in negatives.

Then we exit our while loop. We create our FinalTable variable with VAR_FinalTable where we simply filter our Table variable for the Running Total that is greater than or equal to zero. We apply this filter because anything below zero means we’ve gone negative and we’re out of budget.

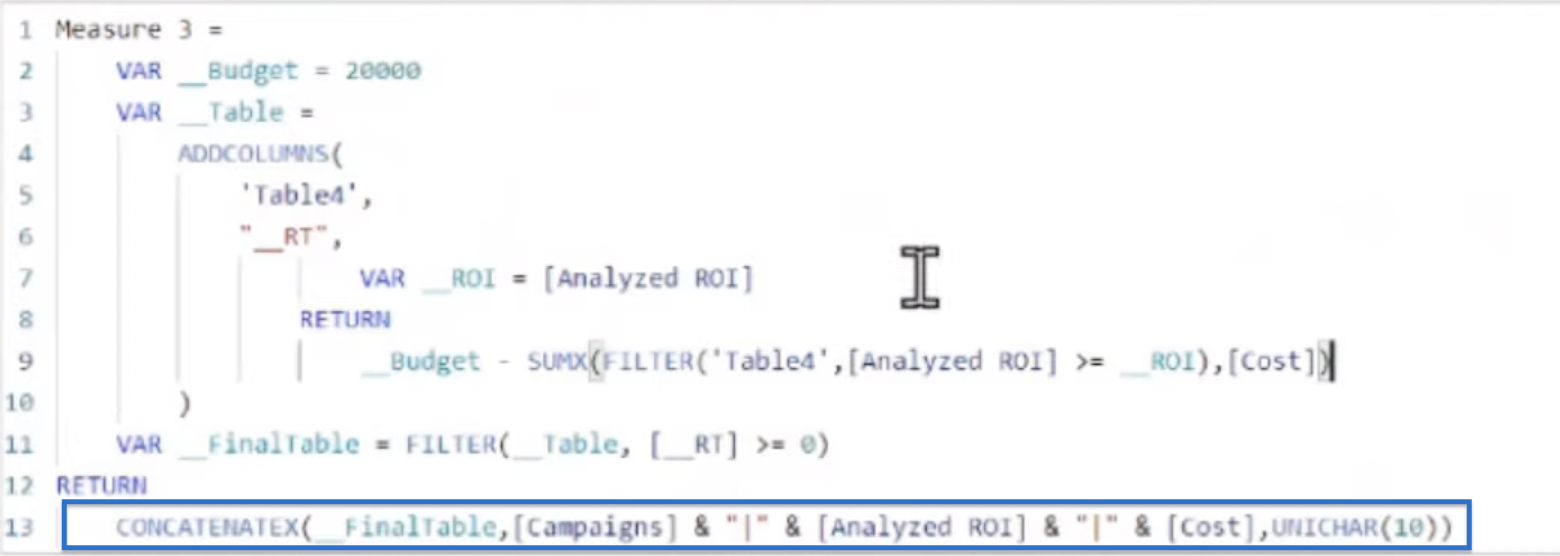
Then we can use CONCATENATEX for those values. We’ll include our columns—Campaigns, Analyzed ROI, and Cost—and add UNICHAR.
We can unhide this Card visual in the Selection pane and see that we have our Instagram and SEM, which are our two highest ROIs.
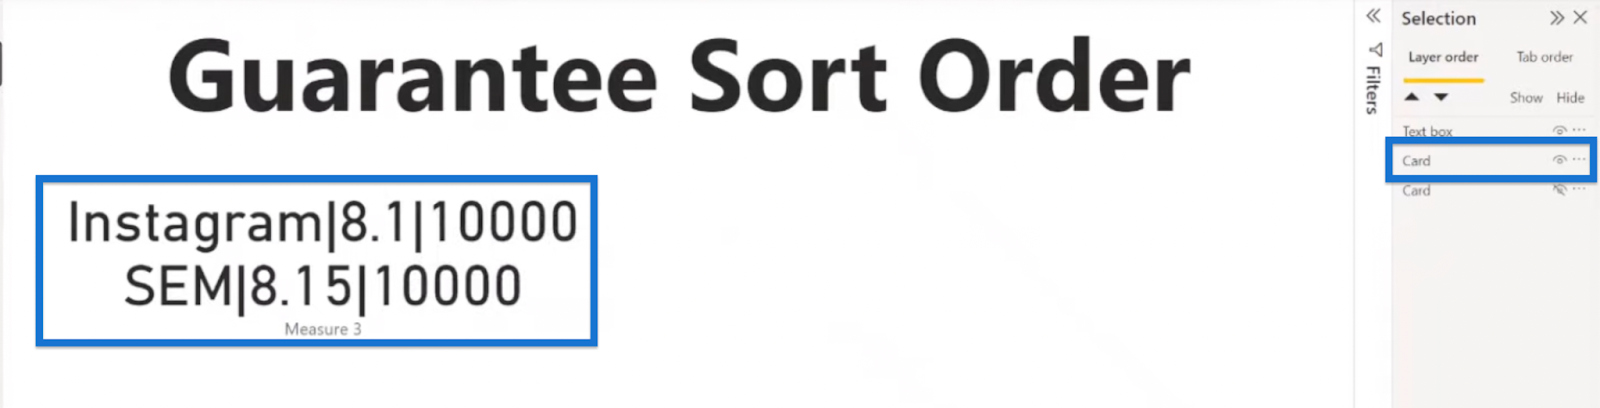
Let’s check our original table to compare the results.
We can see that the PPC indeed has a lower ROI than SEM and Instagram.
However, as you may have noticed, our result didn’t come back in the correct order, with Instagram’s 8.1 showing first before SEM’s 8.15.
Applying Power BI Sort Order
But what if we want Instagram to be returned first because it has the highest ROI and SEM to be returned second? Basically, we want to guarantee sort order. This gets a little bit tricky, but it’s not difficult to understand how to do it.
Here’s how our function should look like, with the bottom section being the same as the while loop we had earlier.
And in order to guarantee sort order, we need to do a little extra work.
Again, we start with our VAR_Budget which we set at 20000. Then, we create our Count variable using VAR_CountI and apply COUNTROWS on Table 4.
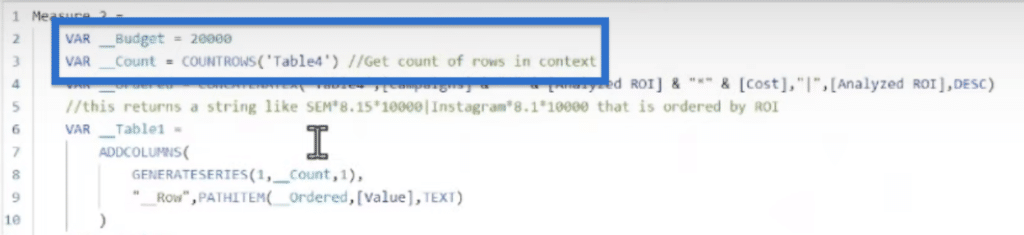
In the next line, we will use the CONCATENATEX function to concatenate our Campaigns, Analyzed ROI, and Cost columns. You can use anything as a separator as long as it’s not in your data, so in this case, let’s just use asterisks.
Then we’ll use a pipe character (|) in the next parameter after the cost column. We’ll also use VAR_Ordered to sort by the Analyzed ROI in descending order, meaning the highest ROI will be at the top.
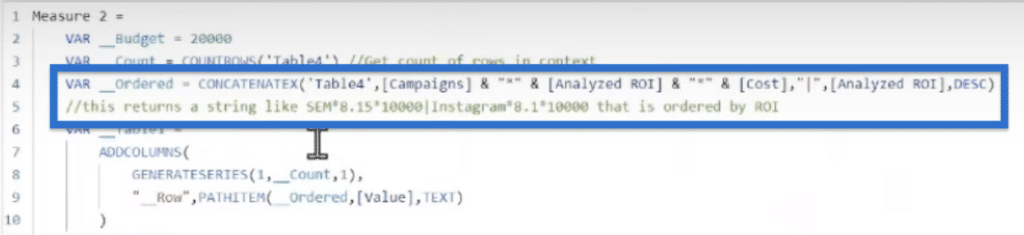
If we look at the comment line, it says that the code will give us the result in the format like SEM*8.158*10000 | Instagram*8.1*10000. It will also come out in the order of the highest ROI to the lowest ROI.
Power BI Custom Sort: Using For Loop
This example is interesting because we get a for loop, while loop, and all kinds of cool functions. This time around, we’ll use the for loop.
Table1
For this example, Table1 is our for loop, and what we’re doing is ADDCOLUMNS to GENERATESERIES that goes from one to our count by one written as (1,_Count,1).

In our Row, we then use PATHITEM because we use the pipe character in order to separate the rows of our table. Using PATHITEM, we then grab the path from the Ordered variable, which is our string.
We also use Value, which is our automatic column that is created with GENERATESERIES, or our Calendars 1, 2, 3, 4, 5, until we exhaust the number of rows we have in our table. Then, we return it back as Text.
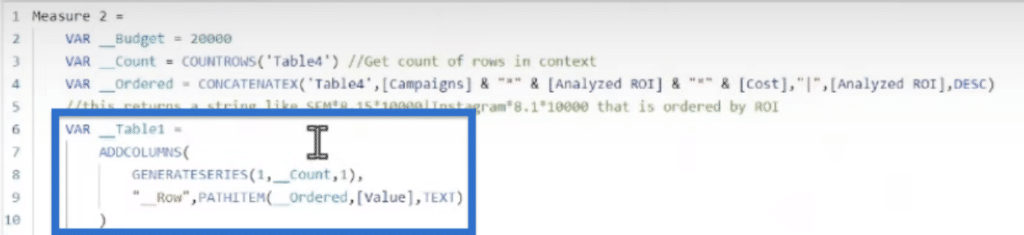
What we have now is a guaranteed sort order for our table, which goes from the highest ROI to the lowest. So, here’s your DAX for guaranteeing sort order.
Table2
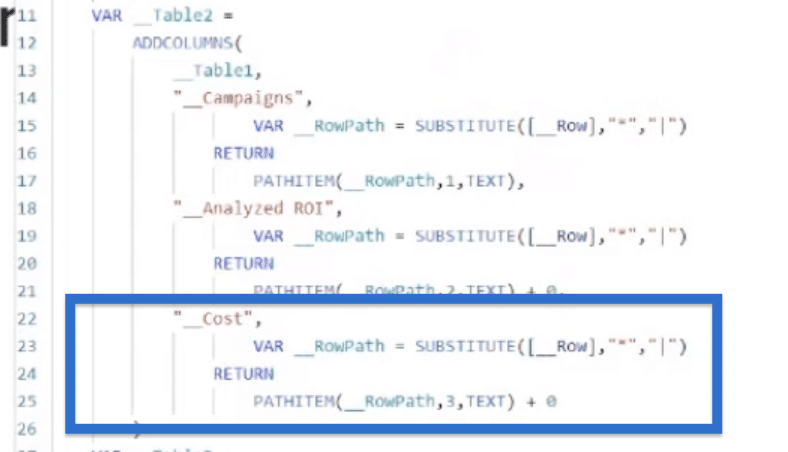
Now, in order to get this in a usable format, we have to do Table2 where we’ll pick out the individual columns from our string that we have.
Let’s use another ADDCOLUMNS to add to Table1, our for loop. For Campaigns, create a campaigns column and use SUBSTITUTE to replace asterisks with pipes. Then, we’ll use PATHITEM on RowPath to grab the first element and return it as TEXT.
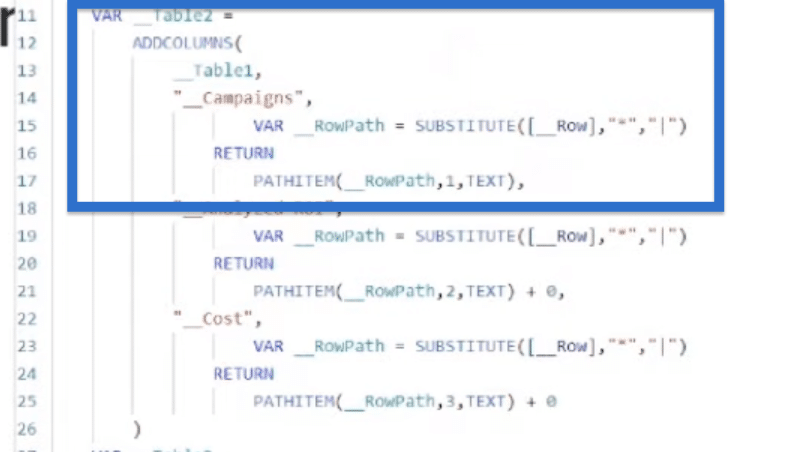
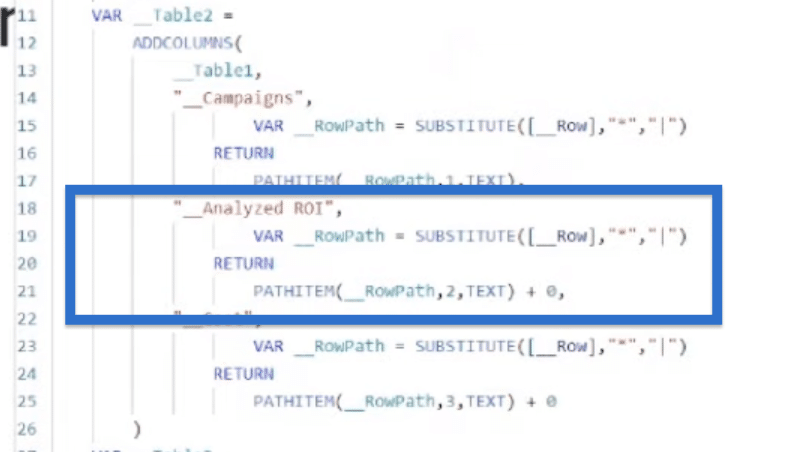
In the Analyzed ROI column, we’ll basically do the same thing. SUBSTITUTE asterisks with pipes. Then, grab the second item in our path and return it as TEXT. We do this because for some reason, PATHITEM lets us return as integer or text but not decimal numbers.
That’s kind of weird, but we can solve that because all we have to do is add zero, and DAX will automatically convert the TEXT string to a numeric value.
Again, we do the same thing for the Cost column. We use SUBSTITUTE and PATHITEM to grab the third item. Then, to return a number, we add zero again because it’s a whole number in this case.
The rest of our code is the while loop that we discussed earlier. What we get now is our guaranteed sort order from highest to lowest campaign.

Our SEM was our highest ranked ROI for our campaign and Instagram is the second one.
***** Related Links *****
External Tools In Power BI – Enterprise DNA Power Sort Pro
How To Sort & Filter Chart In Report Builder
Sort Visualizations Dynamically In Your Power BI Reports
Conclusion
Using the while and for loops, we successfully used Power BI custom sort in our data model based on their ROIs—a proof that DAX can definitely guarantee sort order.
It is important to ensure that your data is correctly sorted in DAX to accurately analyze and visualize it. You can apply what you learned in this tutorial to appropriately sort your data for your next report.
All the best,
Greg Deckler


