Microsoft Excel is full of features; you can use the basics, or you can go deep into the abyss of calculations and data analytics.
There are endless features, but there are 10 features you need to know about.
One of the most popular features of Excel is its ability to perform calculations and analyze data through the use of functions and formulas. Other features of Excel include charts and graphs, Pivot Tables, data filtering and sorting, conditional formatting, data validation, VBA, and many more.
Through this article, we will provide you with a complete breakdown of all the important and frequently used features of Excel.
Each feature will be demonstrated with examples to help you better understand how you can utilize these features to your advantage.
Let’s get number-crunching!
What Are The Top 10 Features of Excel?
In this section, we will review our top 10 things you need to know about, even if you are not ready to use them.
See, the great thing about Excel is that you can start using it with even the most basic knowledge.
So, this is what we will be covering in this guide.
- Worksheets and Workbooks
- Formulas and Functions
- PivotTables
- Data Filtering and Sorting
- Charts and Graphs
- Conditional Formatting
- Data Validation
- Macros and VBA
- Lookup and Reference Functions
- Data Import and Export

1) Worksheets And Workbooks in Excel
In Excel, the terms “worksheets” and “workbooks” refer to specific components of the software, and understanding the distinction between the two is fundamental to navigating and utilizing Excel efficiently.
What is a Worksheet?
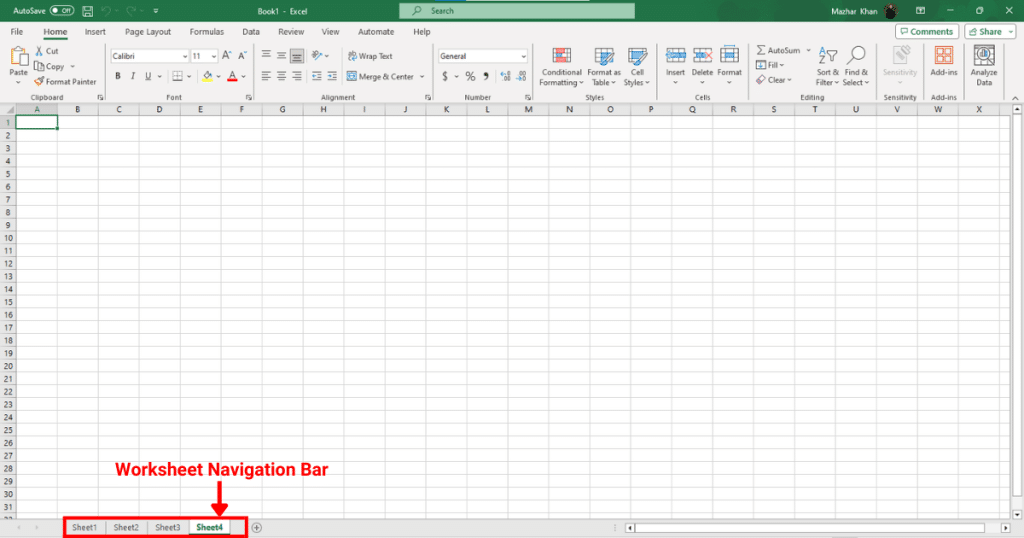
A worksheet is a single page or tab within an Excel file where you enter and manipulate data. Each worksheet contains a grid of cells organized in rows and columns. These cells are where you enter data, formulas, and functions.
In the Excel interface, tabs at the bottom of the window represent different worksheets.
The following is an Excel worksheet:
What is a Workbook?
A workbook is the entire Excel file, and it can contain one or more worksheets.
The workbook file is what you save, open, and share. When you save an Excel file, you’re saving the entire workbook, which includes all its worksheets.
In addition to worksheets, a workbook can also contain other components, such as charts, macros, and VBA modules.
The typical file extension for an Excel workbook (for versions 2007 and later) is .xlsx. If a workbook contains macros, it will have the extension .xlsm.

2) Formulas And Functions in Excel
In Microsoft Excel, both formulas and functions are tools that allow you to perform calculations and manipulate data.
What Are Formulas?
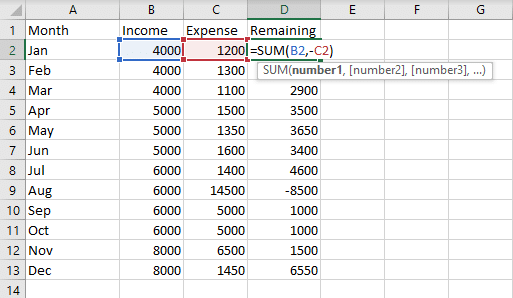
A formula is an expression that performs calculations on values in your worksheet.
It always begins with an equal sign (=).
A formula can contain numbers (like 2 or 5.5), arithmetic operators (like +, -, *, /), cell references (like A1 or B2:C5), and functions.
The following is an example of a basic formula in Excel:

What Are Functions
A function is a predefined operation in Excel, designed to simplify complex calculations.
Functions can be used within formulas to carry out their designated task.
Excel has a vast library of built-in functions for various purposes like mathematical operations, text manipulation, date and time calculations, financial calculations, lookup operations, and more.
The following is an example of a simple formula in Excel:
3) PivotTables in Excel
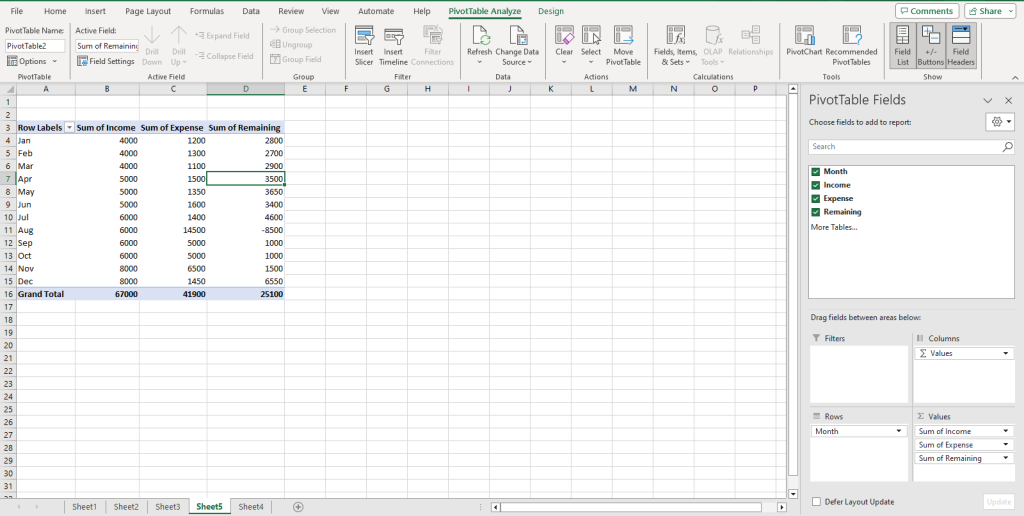
PivotTables in Excel are one of the most powerful tools, especially when dealing with large amounts of data.
They allow users to reorganize, summarize, and extract insights from data without requiring complex formulas or functions.
The following is an example of a PivotTable in Excel:
4) Data Filtering and Sorting in Excel
In Excel, data filtering and sorting are essential features that allow you to control the display of data and organize it in a meaningful order.
Data Filtering
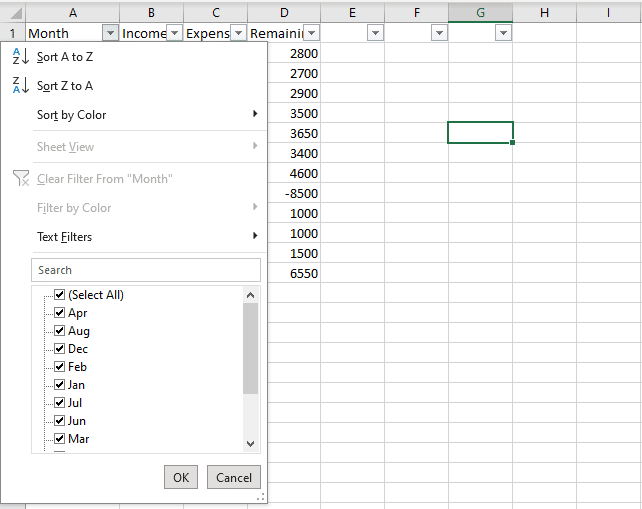
Excel provides drop-down arrows in the column headers when the filter feature is activated. By selecting specific criteria from these drop-downs, you can filter the rows in the worksheet.
Filtering is particularly useful when dealing with large datasets where you want to focus on specific records, like sales of a particular product or records from a specific date range.
Data Sorting
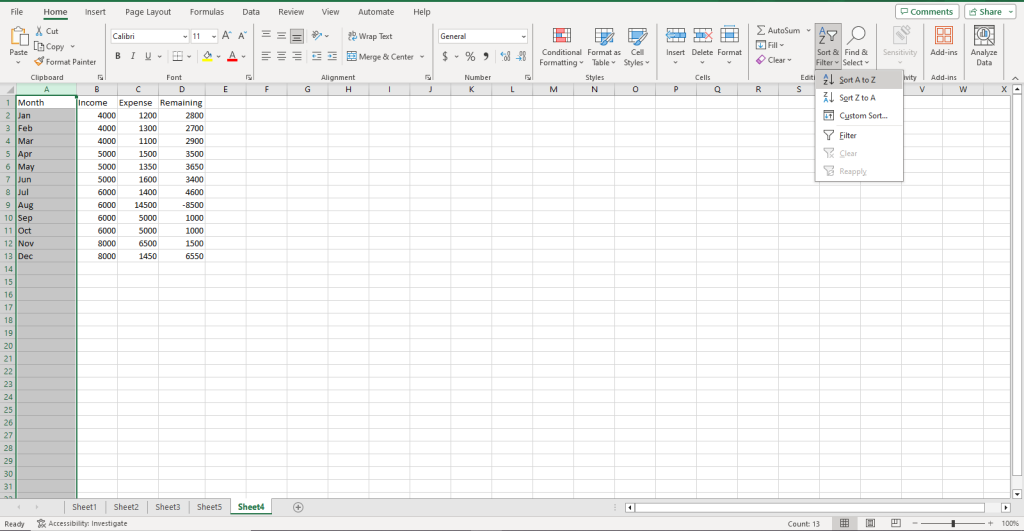
By selecting a column and using the sort feature, you can organize data in either an ascending order (A to Z, smallest to largest) or a descending order (Z to A, largest to smallest).
Sorting is crucial when you want to view records in a particular sequence, like sorting a list of products by their sales figures or organizing customer data alphabetically by last name.
5) Charts and Graphs in Excel
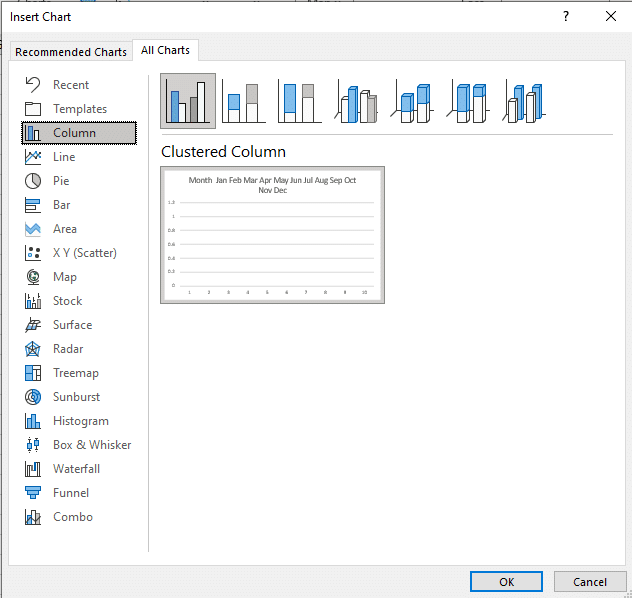
Another important feature of Excel is that you can organize your data into charts and graphs. These graphical features provide a visual representation of data, making it easier to understand and analyze datasets.
Some chart types in Excel are:
- Column and Bar Charts
- Line Charts
- Pie Charts
- Area Charts
- Scatter (or XY) Charts:
- Doughnut Charts
- Radar (or Spider) Charts
- Bubble Charts
- Stock Charts
- Combo Charts
6) Conditional Formatting in Excel
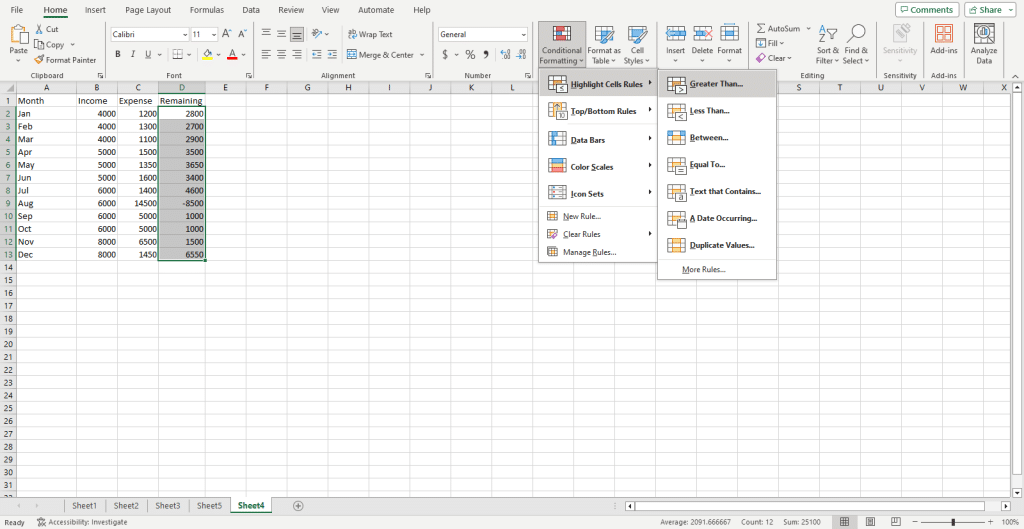
Conditional formatting in Excel allows you to apply specific formatting to cells or ranges of cells based on certain conditions or criteria.
Essentially, it enables the automatic change of a cell’s appearance—such as its background color, font color, or font style—depending on the cell’s value or the outcome of a formula.
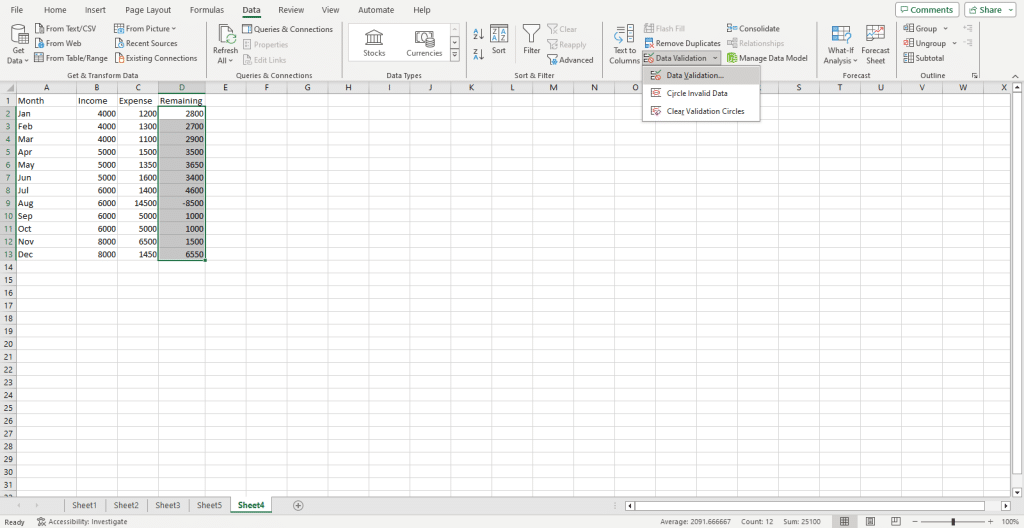
7) Data Validation in Excel
Data validation in Excel is a feature that allows you to set specific rules and criteria to control what data can be entered into a cell.
This ensures that only valid and accurate data is entered, reducing the risk of errors and inconsistencies in your worksheets.
8) Macros and VBA in Excel
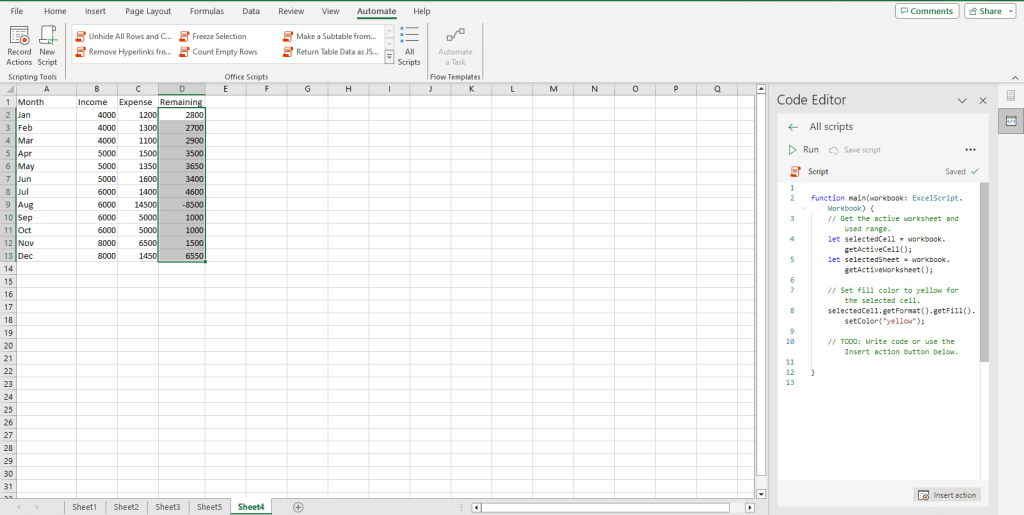
Macros and VBA in Excel are tools that allow you to automate tasks, enhance functionality, and develop custom solutions within Excel.
Excel offers a “Macro Recorder” feature that enables users to record a sequence of actions without writing any code. Once recorded, the macro can be replayed to repeat those actions as many times as needed.

VBA is a programming language developed by Microsoft that is used for writing macros in Microsoft Office applications, including Excel. It’s a subset of the Visual Basic programming language tailored specifically for Office applications.
9) Lookup and Reference Functions
In Excel, the category of “Lookup & Reference” functions is designed to help you find specific values in a dataset, retrieve related information, or reference specific parts of a worksheet or workbook.
These functional features are crucial for data analysis, especially when working with large datasets.
Common lookup functions are:
- VLOOKUP (Vertical Lookup)
- HLOOKUP (Horizontal Lookup)
- LOOKUP
- XLOOKUP
Common reference functions are:
- INDEX
- MATCH
- OFFSET
- INDIRECT

10) Data Import and Export in Excel
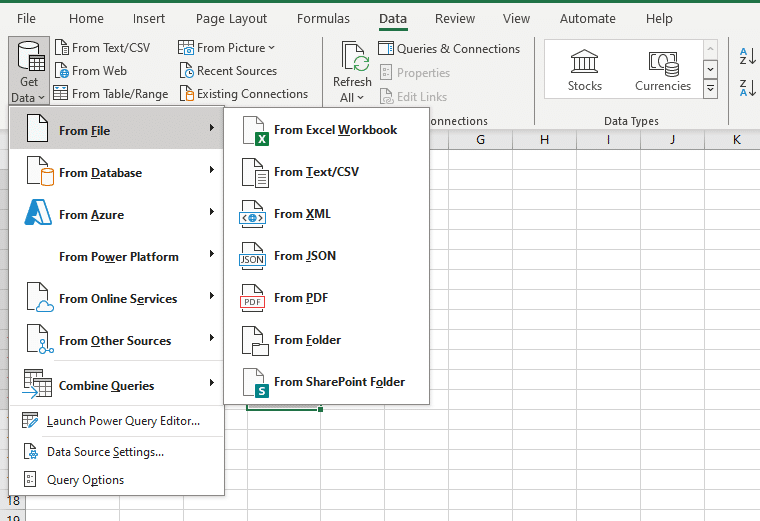
In Microsoft Excel, the capability to import and export data allows you to interact with a wide variety of data sources and formats, facilitating data analytics, reporting, and sharing.
MS Excel supports a range of imports including:
- Text Files
- Databases
- Web
- XML and JSON Files
- ODBC & OLE DB
- External Data Sources such as Microsoft SharePoint or Azure
Exporting involves saving or sending data from a Microsoft Excel workbook to an external file or system.
Common export destinations are:
- Text Files: Like .txt or .csv.
- Databases: Data can be exported back to databases after processing in Excel.
- PDF: Save the workbook or specific worksheets as a PDF document.
- Open XML File Structure and OData.
- Email: Using features in MS Excel, you can directly send usage data in the workbook as an attachment
The capability to import and export data in MS Excel bridges the gap between Excel and other data systems, making it a solid tool in data management, reporting, and analysis.

Learn more about the recent advancements in AI and how you can use them in your Excel projects by watching the following video:
Final Thoughts
Understanding the features of MS Excel is similar to unlocking a toolbox, each tool designed to make your tasks more efficient and your analyses more profound.
By diving into these features, you’re not just learning a software; you’re equipping yourself with the ability to handle data, make informed decisions, and present information compellingly.
It’s essential to grasp these features they empower you to transform numerical data into meaningful insights.
Every time you get familiar with a new MS Excel feature, you’re boosting your productivity and enhancing your professional skill set.
Frequently Asked Questions
In this section, you will find some frequently asked questions you may have when exploring the top MS Excel features.

What are the top functions used in Excel?
In Excel, some of the most commonly used functions include SUM for adding values, AVERAGE for calculating the mean, VLOOKUP for searching related data, and IF for applying logical conditions. With these functions, you can perform basic calculations, analyze data, and automate tasks in your spreadsheets.
How do Excel formulas enhance data manipulation?
Excel spreadsheet formulas are powerful tools that allow you to manipulate and analyze data with precision.
They allow you to perform calculations, compare values, and work with dynamic ranges.
With features like cell referencing and formula updates, your calculations remain accurate and up-to-date as you modify or add new data to your worksheets.
Which advanced features enhance Excel productivity?
Some of the advanced features in Excel that boost productivity include Pivot Tables for summarizing large datasets, Conditional Formatting for highlighting specific data points, and Data Validation for maintaining data integrity.
Excel also offers robust charts to visually represent data and macros that can automate repetitive tasks using Visual Basic for Applications (VBA).
How is Excel used in various professional scenarios?
Excel is an important part of many industries and job roles, including finance, sales, marketing, research, and data analysis.
Professionals use Excel to prepare reports, forecast trends, track performance, manage budgets, and generate insights from raw data.
It also aids in project management, inventory planning, and decision-making processes, making Excel a vital tool for businesses worldwide.
What functions are unique to Excel 2007?
Excel 2007 introduced new functions like IFERROR for handling errors gracefully and AVERAGEIF and SUMIF for conditional calculations.
Improvements were also made to existing features like conditional formatting, expanded Pivot Table capabilities, and the ability to use over a million rows and 16,000 columns to handle large datasets.
How can Excel improve skills in data analysis?
To enhance your data analysis skills in Excel, you can start by mastering basic functions and operations like sorting, filtering, and charting.
As you progress, explore more advanced techniques such as VLOOKUP, INDEX, MATCH, and nested IF statements.
Finally, use Power Query and Power Pivot features for data transformation and modeling. By mastering Excel’s powerful data analysis tools, you’ll learn to make informed decisions faster and with more confidence.


