
A spreadsheet in Microsoft Excel is a powerful tool that allows you to efficiently organize, analyze, and manipulate data arranged in rows and columns.
This versatile application functions as an electronic counterpart to a paper spreadsheet, enabling you to store and arrange data within cells, while performing calculations using formulas.
In Excel spreadsheets, you’ll find features such as tabs for organizing multiple sheets within a workbook, functions to automate calculations, and tables for neatly structuring data.

Furthermore, Microsoft Excel offers the ability to create visually appealing charts to represent and interpret your data effectively.
By gaining proficiency in Excel, you can harness its full potential to manage your information and make informed decisions.
Want to learn the basics? C’mon, it’s easy.
Let’s get started.
Understanding the Excel Interface
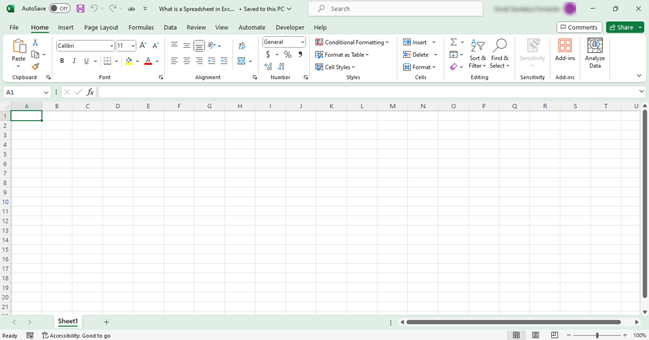
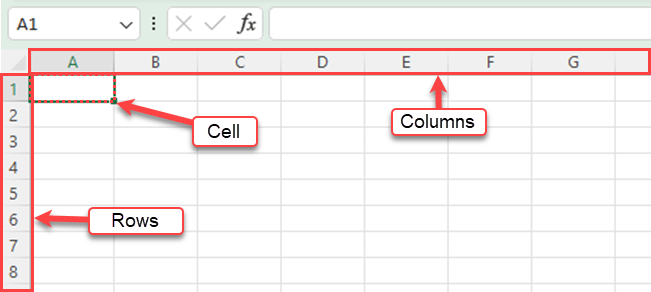
Microsoft Excel uses a grid layout to organize data into rows, columns, and cells, as seen below.
In this section, we’ll discuss the key components of the Excel interface to help you effectively navigate and manage your worksheets and workbooks.

Working with The Ribbon
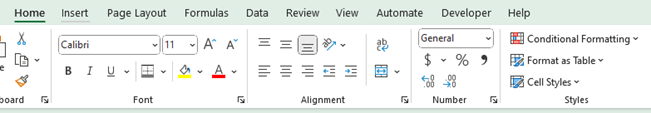
Excel’s primary tool for accessing commands and features is called The Ribbon. It is located at the top of the interface and consists of a series of tabs, each containing a group of related functions.
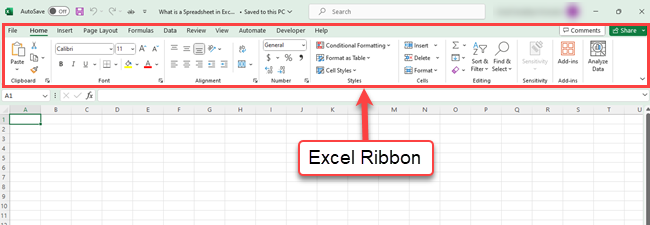
For example, the “Home” tab includes options for formatting cells, managing rows and columns, and sorting data.
To use The Ribbon, simply click on a tab to reveal its functions and select the desired command. Some commands may open additional menus or dialog boxes, providing you with further options.
Also, familiarizing yourself with The Ribbon is essential for efficient work in Excel.
How to Manage Worksheets and Workbooks
Let’s just clarify a few things here.
In Excel, a workbook is a single file that can contain multiple worksheets.
Each worksheet is represented by a tab at the bottom of the workbook window.
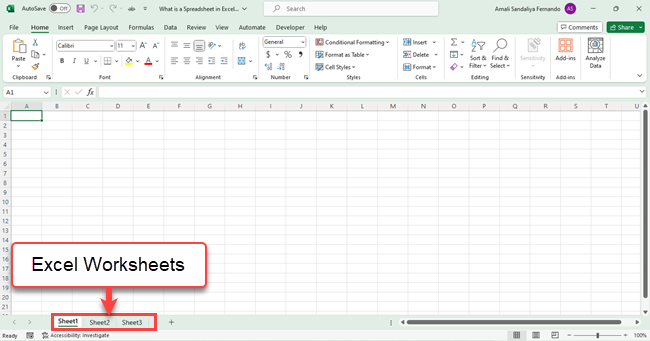
To create a new worksheet, click on the “+” icon next to the existing worksheet tabs.
You can also right-click on any worksheet tab and select “Insert” to add a new worksheet. To rename a worksheet, double-click on its tab and enter the new name.
Also, If you want to know how many worksheets are in your Excel file, enter the below formula in any cell.
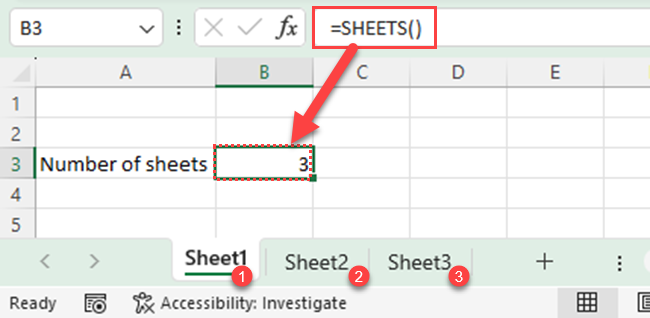
Navigating between worksheets is simple: click on the desired tab to bring it to the foreground. To move a worksheet within a workbook, click and drag its tab to the desired position.
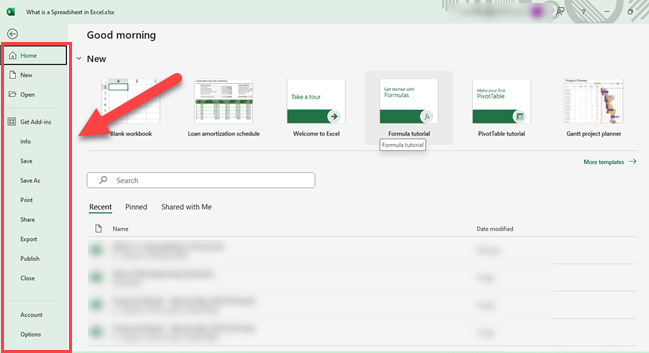
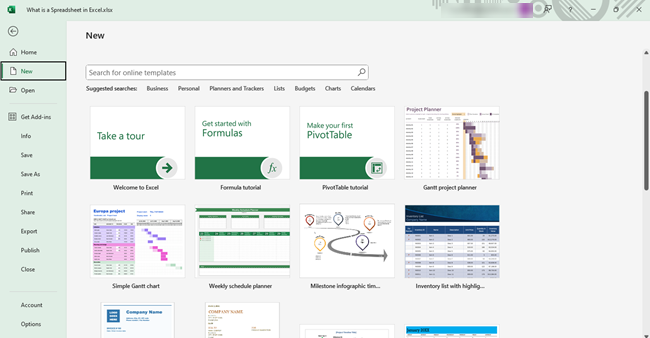
To manage your workbooks, click the “File” tab on the Ribbon.
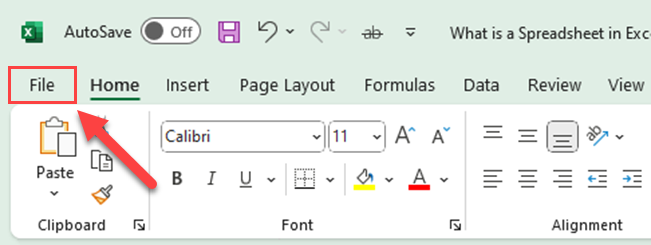
Here you can create a new workbook, open MS Excel, save your work, or export it to various file formats.
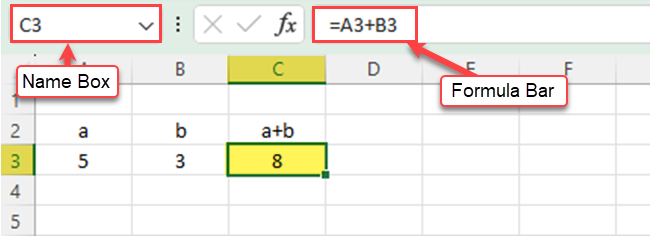
The formula bar shows the formula of the active cell or the selected cell. The cell address of the selected cell is shown in the name box.
If a range of cells is selected, the Name box shows the cell references of the first cell in the top left.

By understanding the Excel interface and mastering its key components such as The Ribbon, worksheets, and workbooks, you’ll be well-equipped to manage your data and effectively utilize the powerful features Excel offers.
It might have been around for a while (the first version came out in 1985!), but Excel is still a very powerful application.
Now let’s check out some of the core basic functions.
Utilizing Basic Excel Functions
Common Excel Formulas
To get started, you need to understand some common Excel formulas, let’s run through them here:
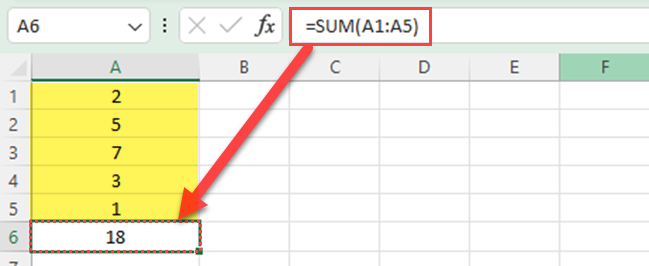
- SUM: This formula helps you add numbers in cells. For example, =SUM (A1:A5) will add the values from cells A1 through A5.
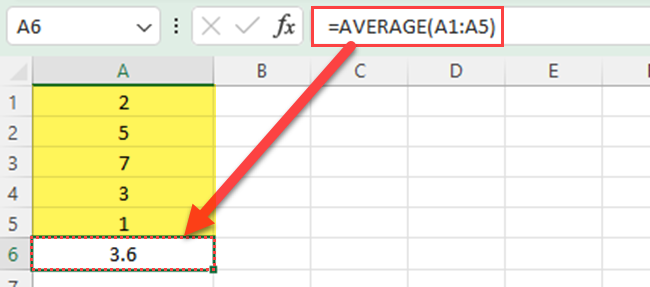
- AVERAGE: This formula calculates the average value of a range of cells. For example, =AVERAGE (A1:A5) gives you the average of cells A1 to A5.
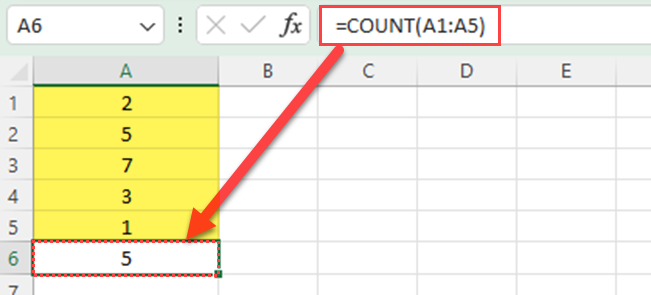
- COUNT: This formula counts the number of cells with data in a range. For instance, =COUNT(A1:A5) will count the number of non-empty cells from A1 to A5.
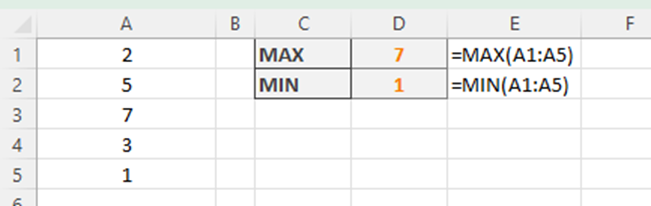
- MAX/MIN: These formulas find the highest and lowest values in a range, respectively. For example, =MAX(C1:C5) will return the highest value within cells C1 to C5, while =MIN(C1:C5) finds the lowest value.
How to Create Charts and Graphs
Excel provides a wide variety of charts and graphs to visualize your data.
Here’s how you can create a chart or graph in a few simple steps:
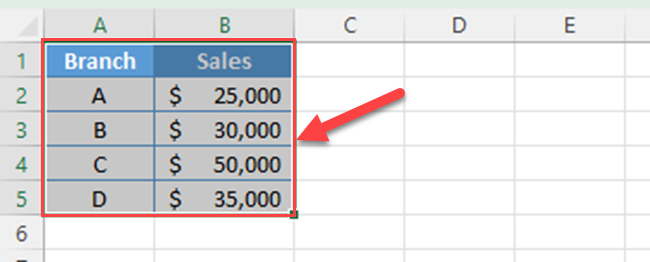
Step 1
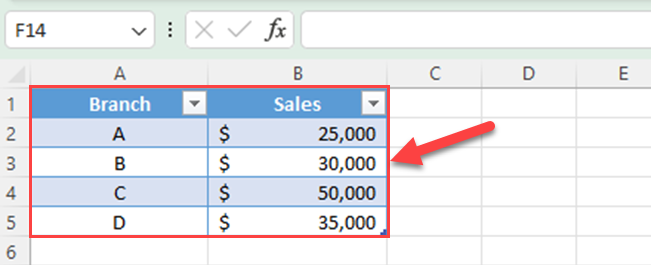
Select data: First, select the range of cells containing the data you want to include in the chart. For example, if you have sales data in cells A1 to B5, you would click and drag to select those cells.
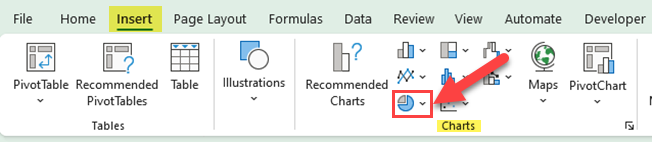
Step 2
Choose a chart type: Go to the “Insert” tab on Excel’s ribbon, and select a chart type from the “Charts” group, such as “Column,” “Line,” “Pie,” or “Bar.” You can also pick from various other built-in chart types.
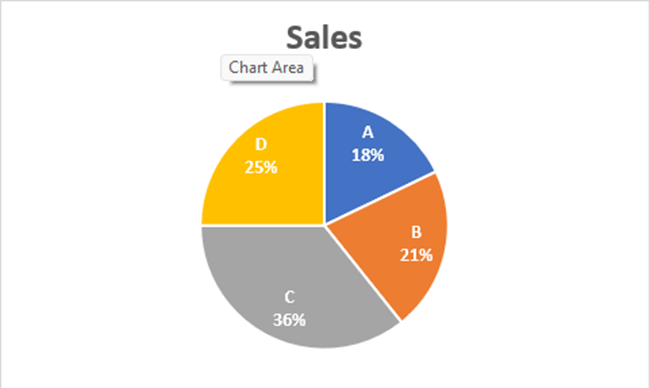
Step 3
Customize your chart: After inserting the chart, you can customize its appearance by adjusting settings like colors, labels, and axes. You can also add a chart title and modify its size and position on the worksheet.
By using these basic Excel functions, you can efficiently perform various calculations in your spreadsheets and present your data in a more visually appealing way through charts and graphs.
Data Management
How to Format Data in Excel
When working with spreadsheet programs, organizing and managing your data is essential.
A key part of this process is formatting data to make it easier to read and understand. You can apply various formatting options to the content in your worksheet, such as font size, font color, and cell shading.
Excel also allows you to automatically format your data using tools like conditional formatting and custom number formats, which can help highlight important information or display it in a more meaningful way.
How to Manipulate Excel Tables
Another crucial aspect of data management in Excel is the ability to manipulate tables.
Excel Tables are essentially collections of related data, organized into rows and columns. If you create tables in Excel, you can:
- Sort data by column values
- Filter data based on specific criteria
- Calculate summary statistics, such as sums or averages
- Apply formatting to entire rows or columns based on a single cell’s value
- Use structured references, making your formulas more readable and dynamic
Using Tables in Excel allows you to analyze and manage your data more effectively, ultimately making it easier to draw conclusions and make informed decisions.
How to Use Excel Templates
One way to streamline your data management process in Excel is by using Excel templates.

Templates are pre-built Excel files designed to help you in specific tasks like budgeting, project management, and tracking data such as inventory tracking.
These templates often include pre-defined tables, formatting, and formulas tailored to the task at hand, which can save you time and effort.
To use a Microsoft Office Excel template, simply open the template file, input your own data, and customize the template to fit your needs.
By using templates, you can spend less time setting up your spreadsheets and more time focusing on the data and insights they provide.
Advanced Excel Features
Excel offers powerful features to analyze and manipulate data, taking your spreadsheet skills to the next level.
This section focuses on three essential advanced Excel concepts: PivotTables, Power Query, and Security and Support.
Understanding PivotTables
PivotTables is an Excel tool for summarizing data by creating a dynamic table. With a few clicks, you can analyze large data sets, allowing you to understand trends and patterns. To create a PivotTable:
Step 1
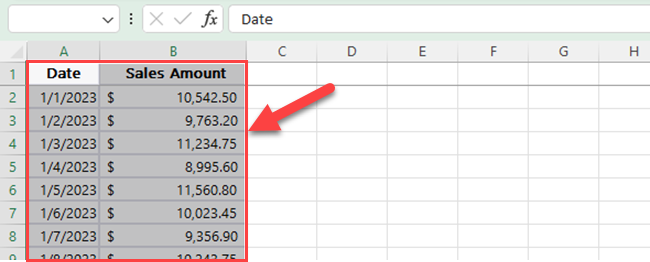
Select your data range.
Step 2
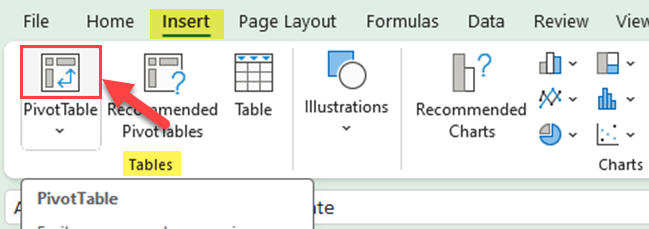
Click on the Insert tab in the Ribbon and choose PivotTable.
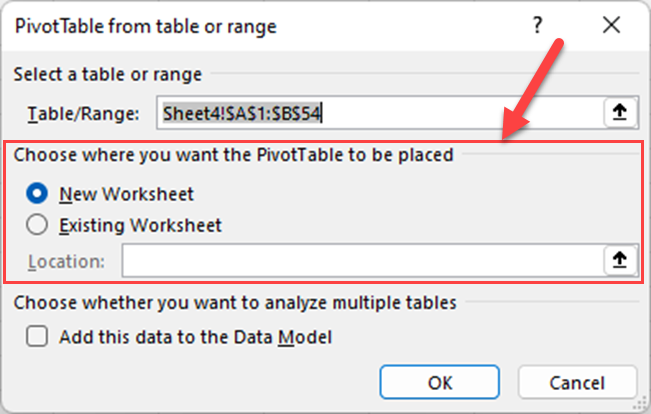
Step 3
Choose the location where you want to insert the Pivot Table.
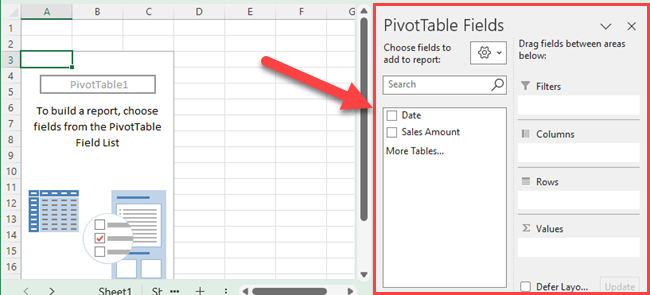
Step 4
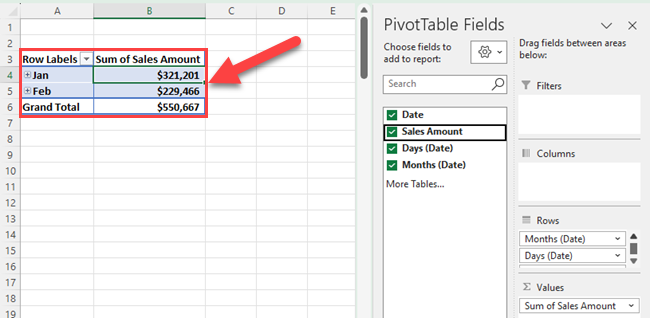
Use the PivotTable Fields pane to drag and drop your columns to form rows, columns, values, and filters.
You can easily customize the format and style of your Pivot Table.
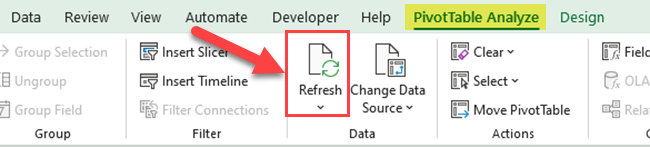
Remember to refresh your Pivot Table when the source data changes to keep the summary updated.
Power Query and Excel
Power Query is an essential tool for Excel users who want to import, connect, clean, and transform data from various sources.
It is integrated into the Excel Data tab, and the process typically involves:
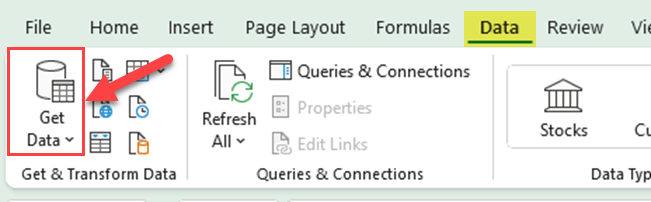
Step 1
Click on the Data tab in the Ribbon and choose Get Data.
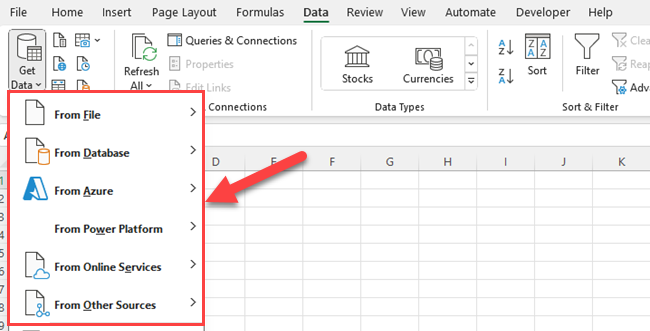
Step 2
Select the data source you want to connect to.
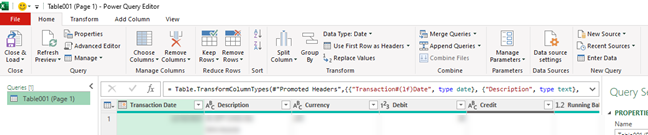
Step 3
Use the Power Query Editor to manipulate and clean the data as needed.
Step 4
Load the data into your Excel worksheet.
Power Query simplifies data management tasks and reduces manual work, making it an invaluable tool for mastering advanced Excel techniques.
Excel Security and Support
Security is an essential aspect of spreadsheet management, especially when sharing sensitive information across teams. Microsoft 365 offers several features to help secure your Excel files:
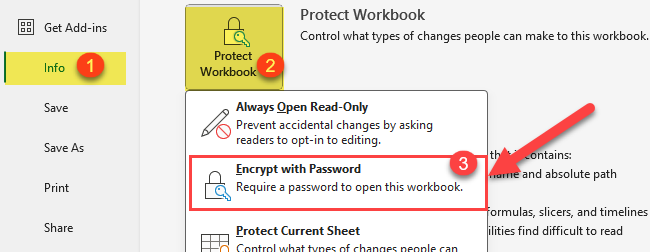
- File Encryption: Safeguard your files with passwords to prevent unauthorized access. Navigate to File > Info > Protect Workbook > Encrypt with Password.
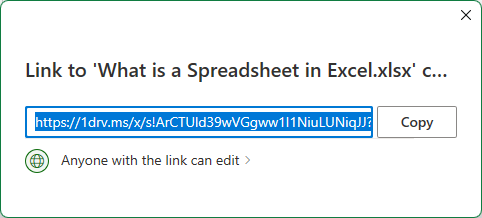
- Share with Specific Users: Restrict access by sharing the file with selected users only. In the Share tab, invite people individually and adjust permissions as needed. When you share your Excel spreadsheet with others, you can work with others similar to Google Sheets.
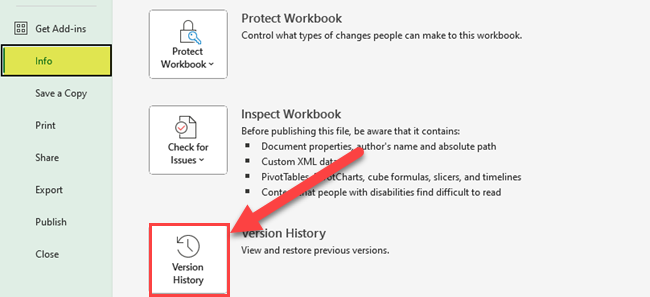
- Version History: Keep track of changes and revert to previous versions if required. Access the Version History in the File > Info section.
As a Microsoft 365 user, you also benefit from continuous software updates and dedicated customer support, ensuring your data remains secure and up-to-date.
Remember to leverage the available security and support features to maximize the effectiveness of your spreadsheets.
Excel in Professional Settings
Excel is a versatile tool that can be used in various professional settings, especially when it comes to accounting and enhancing productivity.
Excel for Accounting
In accounting, Excel plays a crucial role in managing and analyzing financial data.

Here are some ways Excel is useful for accounting tasks:
- Data management: You can organize, store, and sort large amounts of data within Excel, making it easier to manage and analyze your financial information.
- Formulas and calculations: Excel can perform complex calculations with ease, allowing you to generate accurate financial reports and forecasts.
- Pivot tables: You can create pivot tables that summarize and analyze data, making it easier to spot trends and patterns in your financial information.
- Excel templates: Excel offers a wide range of accounting templates, such as income statements, balance sheets, and cash flow statements, which can help streamline your work and improve accuracy.
Enhancing Productivity with Excel
Excel not only excels in the field of accounting, but it also greatly enhances overall productivity in various areas.
Here’s how:
- Microsoft 365 integration: Being part of the Microsoft 365 suite, Excel integrates seamlessly with other Microsoft applications like Word, PowerPoint, and Outlook, allowing for smooth coordination and collaboration between team members.
- Excel templates: Excel offers numerous templates for a wide range of tasks, making it easier and faster to start new projects.
- Customization and automation: Through the use of macros, you can automate repetitive tasks and customize Excel to better suit your needs, saving time and increasing efficiency.
- Data visualization: Excel provides multiple chart options, allowing you to create visually appealing and informative charts that help with data analysis and presentation.
- Training and resources: There are a vast number of resources and training courses available online, making it easy for you and your team to enhance your Excel skills and boost productivity.
Excel is an invaluable tool for many professionals and organizations, providing a wide range of functionalities that improve efficiency, streamline tasks, and facilitate better decision-making. By mastering Excel, you can not only improve your accounting skills but also significantly enhance your overall productivity.
Final Thoughts
Now you know that a spreadsheet in Excel is like a digital table where you can put numbers and words. It’s like a super calculator that can add, subtract, and do many other math things with the numbers you put in.
You can also make charts and graphs to help you understand the numbers better. It’s useful for lots of things, like making budgets, keeping track of stuff, or doing schoolwork. Excel is a computer program that helps you do all of this easily.
Become a master of this invaluable spreadsheet software and excel in Excel!
If you’ve got the hang of things and are ready to combine Excel with a little AI and some other cool tools, check out our latest video below!
Frequently Asked Questions
How do I create a spreadsheet in Excel?
To create a spreadsheet in Excel, open the application and go to File > New. Choose Blank Workbook and a new spreadsheet will be created. You can start entering data in the cells, organized in rows and columns.
What are the main features of a spreadsheet?
Spreadsheets have numerous features, including:
- Data organization: Data is organized in rows and columns, which create cells.
- Formulas and functions: Spreadsheets allow you to create and apply formulas to perform calculations between values, and use built-in functions to streamline operations.
- Formatting: Customize fonts, sizes, colors, conditional formatting, and more to make the spreadsheet visually appealing and easy to read.
- Charts and graphs: Represent your data visually using charts and graphs for better analysis.
- Sorting and filtering: You can sort and filter the data in your spreadsheet based on specific criteria.
What are some common uses for spreadsheets?
Spreadsheets are versatile and used across various industries for tasks such as:
- Financial analysis and budgeting
- Sales forecasting and tracking
- Inventory management
- Project management and scheduling
- Data analysis and visualization
How can I apply formulas to my Excel spreadsheet?
To apply a formula in Excel, click on an empty cell, type the = sign, and then type the formula following it. For example, =SUM(A1:A5) calculates the sum of the values from cells A1 to A5. Press Enter to complete the formula and display the result.
What are some examples of spreadsheets?
Some examples of spreadsheets include:
- A personal budget spreadsheet to keep track of income and expenses
- A business financial statement for profit and loss analysis
- An event guest list for managing RSVPs and seating arrangements
- A sales dashboard to monitor sales revenue and targets
- An invoice template for creating professional invoices
What is the main purpose of using a spreadsheet?
The main purpose of using a spreadsheet is to organize, analyze, and manipulate large amounts of data efficiently. By working with structured data in rows and columns, you can easily perform calculations, create visual representations, and make informed decisions based on the information available.


