
In today’s fast-paced digital world, dealing with data is an integral aspect of our everyday lives. It might of been around for years, but Microsoft Excel still stands strong.
The importance of Microsoft Excel in the professional realm cannot be overstated. This powerful spreadsheet software has become an indispensable tool across various industries due to its unparalleled adaptability. Professionals from diverse fields rely on Excel to streamline their workflows, save time, and make better-informed decisions.
Equipped with a wide array of features, including data input, formatting, mathematical operations, and graphical representation tools, Excel enables efficient data management and simplifies the communication of insights.

In this article, we’ll explore some of Excel’s main features and explain why it’s a tool you can’t live without (well, we certainly can’t).
Ready to revolutionize the way you manage and analyze data?
Let’s go!
9 Reasons Why Excel is Important

While its core functionality revolves around organizing data into rows and columns, Excel truly shines through its extensive features designed to enhance productivity and streamline workflows.
Let’s take a look at some of the reasons why Excel is important and showcase what you can do with it:
1. Organize and Manage Your Data
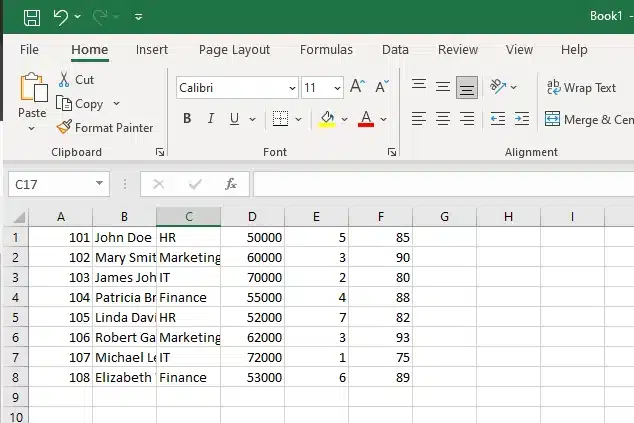
Excel’s grid system is fundamental to organizing data. You can break down big projects into smaller pieces by creating separate worksheets, and then further divide those worksheets into neat rows and columns called cells.

This way, Excel provides the capability to arrange large amounts of data in a structured manner, while ensuring accuracy and organization.
Plus, having all your data organized like this helps prevent mistakes and makes it easier for you to get things done faster.
Another essential feature of Microsoft Excel is its ability to sort and filter data.
2. Sorting and Filtering Data
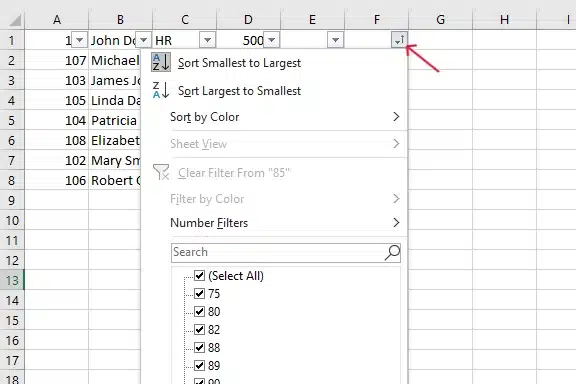
Sorting and filtering are essential tools within Microsoft Excel that empower you to efficiently analyze your data and uncover valuable insights.
By leveraging these features, you can swiftly identify patterns, trends, and potential outliers within your datasets, enabling you to make more informed decisions based on accurate information.
In addition to sorting and filtering, Excel offers conditional formatting capabilities that allow you to apply visual cues to specific cells or ranges based on predefined criteria.
Furthermore, this feature proves particularly useful in highlighting important information or drawing attention to areas of concern.
Next, let’s examine how managing complex databases is streamlined in Excel.
3. Manage Complex Databases
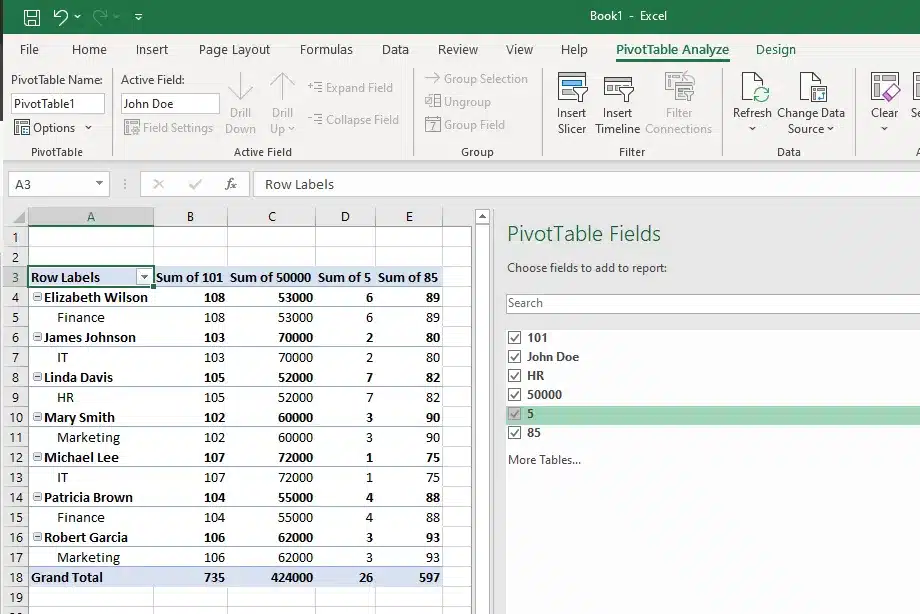
Advanced features such as pivot tables and Power Query enable users to manage complex databases effectively. They can take your messy, raw data and turn it into useful information that helps you understand what’s going on.
And since Excel can connect to all kinds of different databases, like ones using SQL, you can bring in data from lots of different places and mix it to get even more insights. This makes it very helpful for managing and analyzing complex databases.
Now, let’s discuss calculations and Maths in Excel.
4. Perform Calculations and Mathematical Operations
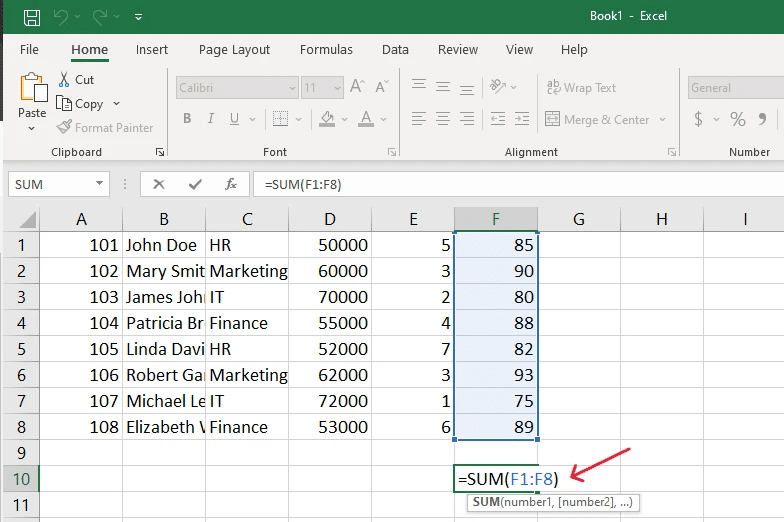
If you need to do some math, Excel has got you covered! It’s got all sorts of functions for basic arithmetic, trigonometry, and even statistics. So whether you’re calculating a simple sum or running a complex regression analysis, Excel can handle it with ease.
The extensive library of pre-built functions and formulae in Excel supports a wide range of mathematical, statistical, financial, and engineering computations, making it a versatile tool for quantitative analysis.
Next, let’s explore how analyzing data in Excel reveals insightful trends and patterns.
5. Analyze Data and Create Visualizations
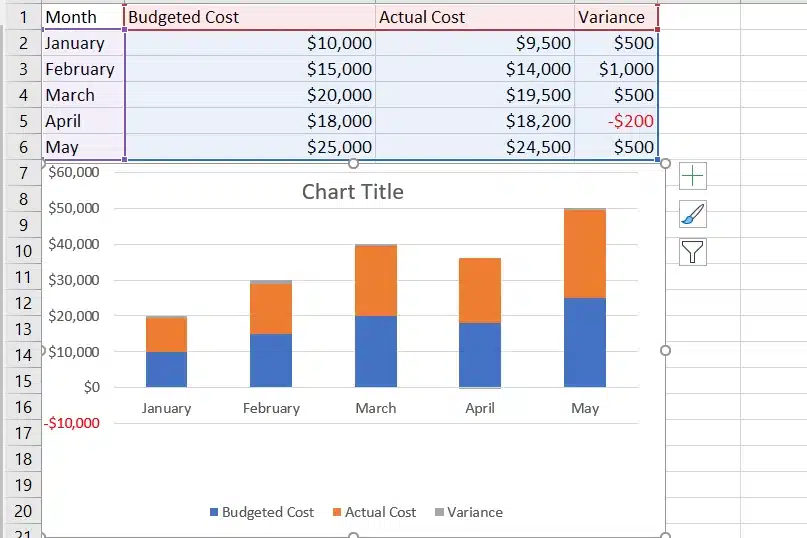
Learning how to create data visualizations in Microsoft Excel can make you a key player in any professional team. You can create things like charts and graphs that make it easy to see patterns and trends in the data, which can then help people make better decisions.

As you gain proficiency in data visualization with Excel, you’ll be able to highlight key trends, identify areas for improvement, and showcase your organization’s progress toward achieving its goals.
Need to team up? Read about the collaborative features of Excel below.
6. Collaborate and communicate
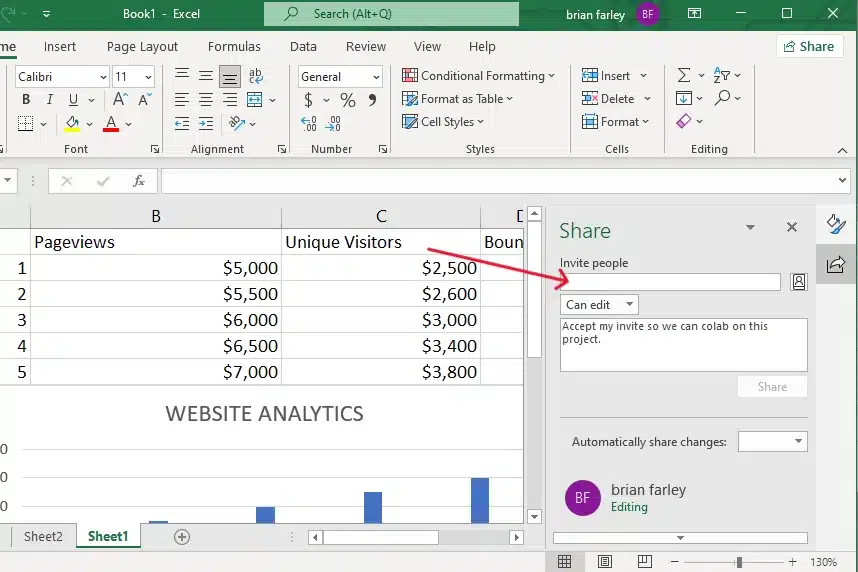
Collaboration has never been easier thanks to Microsoft Excel’s innovative features. One such feature allows multiple users to simultaneously edit and contribute to a single spreadsheet, promoting efficient idea exchange, constructive feedback, and real-time updates.
This collaborative functionality significantly reduces the time spent on manual data sharing and synchronization while ensuring that all team members remain aligned with each other’s progress and objectives.
Now, let’s take a look at how Excel integrates with other Microsoft applications.
7. Integrate with Other Microsoft Applications

Microsoft Excel’s compatibility with other Microsoft applications, such as Word and PowerPoint, is another testament to its versatility and importance in the professional realm.
By seamlessly integrating with these popular office suites, Excel empowers users to create clear and concise reports, presentations, and other documentation that effectively communicate their findings to colleagues and stakeholders alike.
This interconnectedness between various Microsoft products fosters better collaboration among team members.
Exhausted from repetitive data entry tasks?
Check out the Macros and VBA below.
8. Automate Repetitive Tasks with Macros and VBA

Mastering Microsoft Excel is key for professionals! It lets you automate repetitive tasks with macros and VBA programming, saving time and reducing errors.
Plus, you can organize large amounts of data on multiple sheets and workbooks, making it simple to spot trends. As you get better at using Excel, you’ll find it’s a powerful ally in staying ahead of the competition.
Alright, Let’s discover how to transform tedious spreadsheets into stunning visual stories.
9. Unlock Potential With Extensive Tools Like Power Query & Power BI

One of the key aspects of Microsoft Excel’s significance in the professional world is its seamless integration with other powerful tools like Power BI and Power Query.
With Power BI, users can effortlessly connect to multiple data sources, perform complex data transformations, and generate visually engaging and interactive dashboards for real-time data analysis.
Meanwhile, Power Query provides a robust platform for extracting, transforming, and loading data from a wide range of sources, further enhancing Excel’s capabilities as an indispensable tool for modern professionals.
These tools enable users to extend Excel’s functionality far beyond what one might expect from a typical spreadsheet application.
Now, let’s dive in as we unravel the reasons behind Excel’s enduring significance.
Final Thoughts

In conclusion, Microsoft Excel is an indispensable tool for modern professionals in many different fields. Its importance lies in streamlining data management and analysis, which allows for informed decision-making.
As the demand for skilled Excel users grows alongside the increasing importance of data analysis in various industries, there’s no denying that this trusty spreadsheet application will remain a vital part of any successful professional’s toolkit well into the future.

By investing time and effort into mastering Excel, professionals can position themselves at the forefront of their industries, staying ahead of the competition and adapting to changing landscapes with ease.
If you’re interested in learning more about other Microsoft products and their impact on the modern workplace, be sure to check out the enterprise DNA YouTube channel.
Frequently Asked Questions
How can Microsoft Excel assist in organizing data and creating data visualizations?
Excel helps users by structuring data in an organized manner, making it simpler to create powerful tools for data visualization such as charts and graphs. This is crucial for various aspects including performance reporting, sales targets, and expense reports.
How does learning Excel benefit my professional resume?
Acquiring Excel skills can significantly enhance your resume. It demonstrates your proficiency in database systems and data analytics while opening doors to leadership opportunities in many industries, including product management and finance.
Can Microsoft Excel be used to track business expenses and manage budgets?
Yes, Excel is highly effective at managing business expenses. You can utilize it to track business expenses, monitor sales targets, and generate performance reports for each pay period, making it an essential tool for financial planning and budgeting.
What are some powerful tools or Excel functions that I should learn?
Excel offers various powerful tools and functions for enhanced data analytics, such as Pivot Tables, Index Match Match, and other Excel functions that allow for advanced data sorting and analysis, helping in areas like tracking business expenses and achieving sales targets.
How does knowledge of Excel contribute to success in product management?
Knowledge of Excel is vital for roles like product management where you need to constantly analyze performance, track expenses, and monitor sales targets. The ability to create detailed data visualizations and manage database systems makes Excel a key tool in these fields.
What are some of the performance reporting capabilities of Excel?
Excel offers robust performance reporting capabilities. It can organize data related to sales, business expenses, and even pay levels, making it easier to generate comprehensive reports that guide business strategies and decisions.
How is Excel used in setting and monitoring sales targets?
Excel assists in setting and monitoring sales targets by organizing relevant data, allowing for the creation of visual aids like charts to better analyze performance against set targets over specific pay periods.


