So you’d like to add a grand total in Tableau? You’re in luck; it’s easy to do.
Grand totals offer a quick and effective way to summarize the entire data source, allowing you to compare the individual values to the overall total.
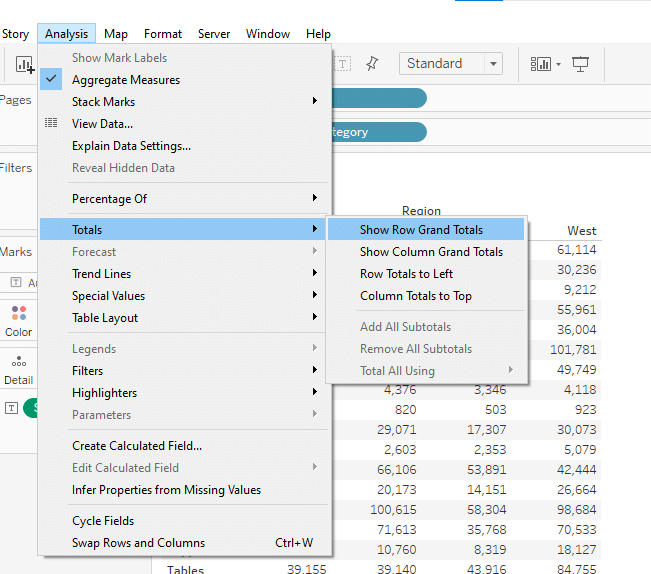
To add a grand total in Tableau, you can use the built-in Tableau feature to easily display grand totals. To do this, go to the Analysis menu, select Totals, and then click the “Show Row Grand Totals” or “Show Column Grand Totals” option. This will display the grand total for the entire row or column.
This article will go over 3 great ways of adding grand totals in Tableau, including the different ways of formatting grand totals to make your visualizations more insightful and informative.
Let’s get started!

3 Methods to Add Grand Totals in Tableau
In this section, we will go over 3 methods of adding grand totals to your visualization.
Specifically, we will go over the following:
Adding grand totals in the Analysis menu
Adding grand totals from the Analytics Pane
Adding grand totals using calculated field

1. How to Add Grand Totals in The Analysis menu
To add grand total using the Analysis menu, click on the Analysis tab from the toolbar.
Now, select Totals.
Next, choose either Show Row Grand Totals or Show Column Grand Totals.

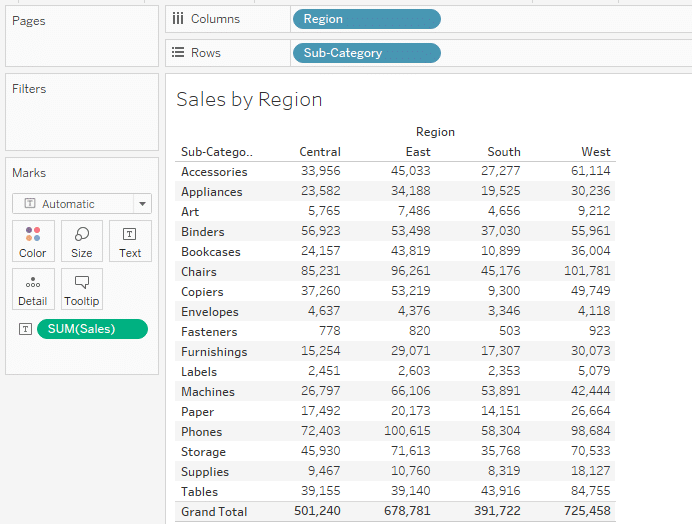
You can see the grand total added at the end of the row or column for the underlying data source.

2. How to Add Grand Totals From The Analytics Pane
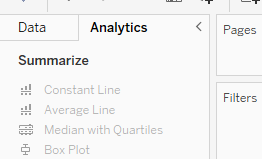
To add grand totals from the analytics pane, click on Analytics located right next to the Data pane.

Drag and drop Totals from the Analytics pane to the view.
You can select subtotals, row grand totals, or column totals.

Once done, Tableau will add grand totals to your desired dimension.

Learn Advanced Data Analytics from OpenAI by watching the following video:
Final Thoughts
In this article, we have discussed the significance of grand totals in your data analysis, along with the step-by-step process of adding them to your Tableau visualizations.
As you have seen, grand totals offer a comprehensive view of your data, enabling better insights and decision-making.
The use of grand totals not only enhances the understanding of data but also simplifies complex datasets, making them more accessible to your audience.
By following the methods described, you can effectively integrate grand totals into your Tableau visualizations, thus improving their overall impact and usability.
Happy data visualization!
Frequently Asked Questions
In this section, you will find some frequently asked questions you may have when adding grand totals in Tableau.

How can I show grand totals in Tableau?
To show grand totals in Tableau, you can use the Analysis menu.
Select the Totals option and then choose either Show Row Grand Totals or Show Column Grand Totals, depending on your preference.
What is the difference between Sub-Total and Grand Total in Tableau?
Sub-Total is the sum of values within a specific group or category, while Grand Total is the sum of all values in the entire dataset.
Sub-Total provides a more detailed view of the data, while Grand Total offers a higher-level summary.
Can I add a total column in Tableau?
Yes, you can add a grand total column in Tableau by using the Analysis menu.
Select the Totals option and then choose either Show Row Grand Totals or Show Column Grand Totals, depending on your desired location for the total column. Tableau will display totals at the end of the column.
How to calculate a grand total in Tableau Desktop?
To calculate a grand total in Tableau Desktop, you can use the Analysis menu.
Select the Totals option and then choose either Show Row Grand Totals or Show Column Grand Totals, depending on the desired location for the grand total.
What is the alternative method for adding grand totals in Tableau?
An alternative method for adding grand totals in Tableau is by using table calculations.
You can right-click on a measure in the view, choose Add Table Calculation, and then select the desired calculation type to show the grand total. This method is more suitable for aggregated data operations.


