
In Excel, queries are great for managing data! Why? They let you quickly find exactly what you need from all sorts of sources simply by setting some simple rules.
In Excel, a query is a way to retrieve and process data from internal or external sources. It allows you to use structured query language (SQL) or a graphical interface to filter, sort, and manipulate data from databases, text files, other spreadsheets, or web services directly within Excel.
Also, With queries, you can define specific criteria to selectively extract and display the data you need for analysis or reporting.

In this article, we’ll show you Excel queries, the different kinds you can use, and how to set them up quickly.
We’ll also look at how queries make sorting through data and creating reports much easier!
Are you ready to master Excel and simplify your data tasks like never before?
Let’s get started!
What Are The Types of Queries in Excel?

When working with queries in Excel, you can choose between two types: internal and external queries.
Internal queries allow you to sift through data in an Excel workbook, pulling information from multiple tables without needing external sources. This is perfect for consolidating data across different sheets without relying on additional tools or programs.

On the other hand, external queries connect to external data sources, allowing you to tap into a broader range of data. Examples of these external sources include SQL Server databases, text files, Access databases, and even Power BI.
As for static vs dynamic queries, here’s what you need to know:
One fantastic feature of queries in Excel is how they handle changes to the original data. Static queries serve as a snapshot, preserving the data as it was retrieved, which requires a manual refresh to access updated content.
Whereas dynamic queries are agile, automatically reflecting changes in the underlying data, thus saving precious time and reducing manual work when handling evolving datasets.
Now, let’s take a look at how to construct a query.
How to Create a Query in Excel

To create a query in Excel, follow these three simple steps:
Specify the data range or table name: Begin by identifying the specific data you wish to retrieve. You can either select a cell range containing the desired information or refer to an existing table within your workbook.
Define the criteria for selecting data: Once you’ve identified the relevant data, set the criteria that will determine which records should be included in your query results. For example, you might choose to filter based on equality, inequality, containment, or other conditions appropriate for your dataset.
Choose how you want the query results to be displayed: Finally, decide how you would like the query results to appear in your workbook. Options include creating a new worksheet, inserting a table to organize the output, or even embedding the query directly into an existing worksheet or chart.
Next, let’s explore creating a query with some real-world examples.
Example 1: students and their grades in an exam

Suppose you have a list of students and their grades in an exam. You want to find out the average grade for all students who scored above 70.
Here’s a step-by-step on how to formulate a filter query:
Example 1: Basic Filtering
Select the Range and Apply the filter
How to Apply the Filter:
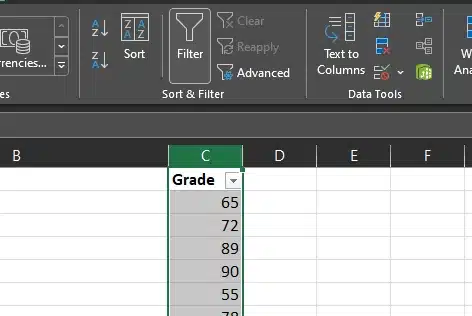
Select the range of cells containing the grades (let’s say these are in cells C2:C10).
Click on the Data tab in the ribbon menu.
Under the ‘Sort & Filter‘ group, click on the ‘Filter‘ button (it looks like a funnel icon). This will add drop-down arrows to each column header.
Set the Filter Options
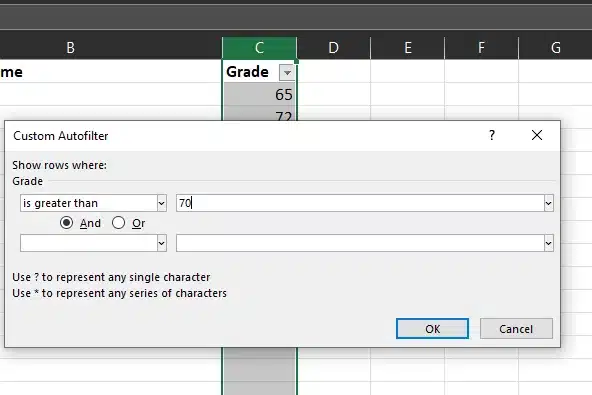
Go to column B and click on the drop-down, expand the number filters options and select “Greater Than”, then enter “>70“. This sets up a filter so that only values greater than 70 are displayed.
Now let’s combine the query with a basic formula.
Combine With A Formula
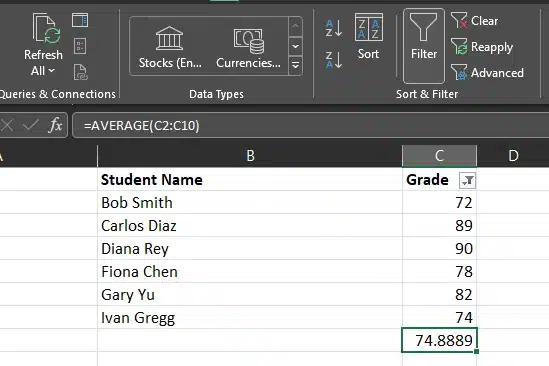
Now go to cell B1 and type the formula “=AVERAGE(C2:C10)“. Since we’re only looking at values greater than 70, this formula will calculate the average of those values.
That’s it! By setting up filters and using a simple formula, you’ve formulated a query to get the information you need.
Now, let’s take a deeper look at using queries with Formulas and Functions.

How to Use Queries in Formulas and Functions

One of the most powerful aspects of Excel queries lies in their ability to be seamlessly integrated into various formulas and functions.
Let’s take a look at some examples of combining queries with functions:
Example 1: High Earners Query
Select the Range
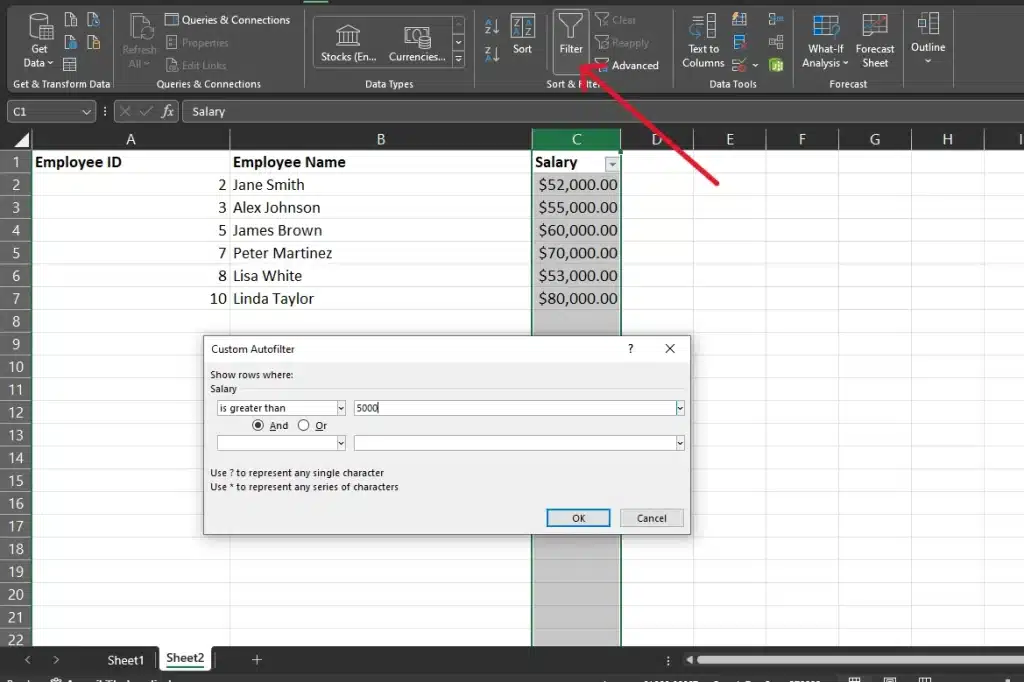
Imagine you want to pinpoint which members of your team are in the top earning bracket. Begin by selecting the range that includes employee names and corresponding salaries, which we’ll refer to as the “Salary_Range” in your spreadsheet.
Now, we’re going to set our criteria and apply the filter.
Apply The Filter
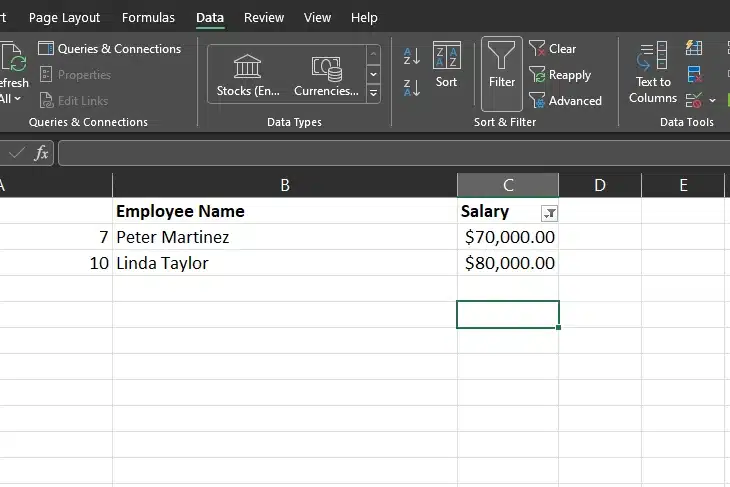
Let’s apply a filter criterion for salaries set as “Salary > 60000“. Execute the query, and then direct the output to a fresh worksheet named “Top_Earners”.
This action generates a streamlined list of individuals who are earning above $60,000.
Next up, we’ll dissect an example query focused on analyzing regional sales.
Example 2: Regional Sales Analysis Query
Apply the Filter
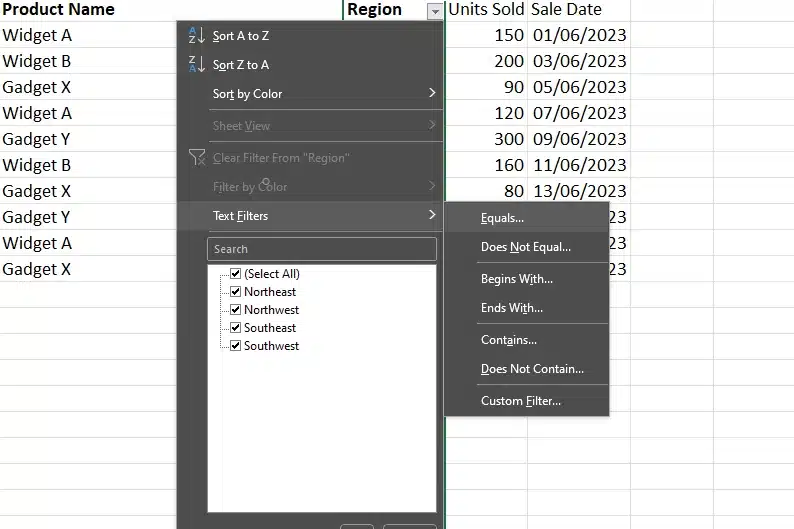
Let’s say you aim to dissect your product performance in the Northwest region. Start with your comprehensive sales dataset, which we’ll call “Product_Sales_Data”.
Define your filter criterion to hone in on the Northwest area, go to the drop-down and select “text filter” and “equals..” using a parameter like “Region contains ‘Northwest'”.
View the Filtered Results
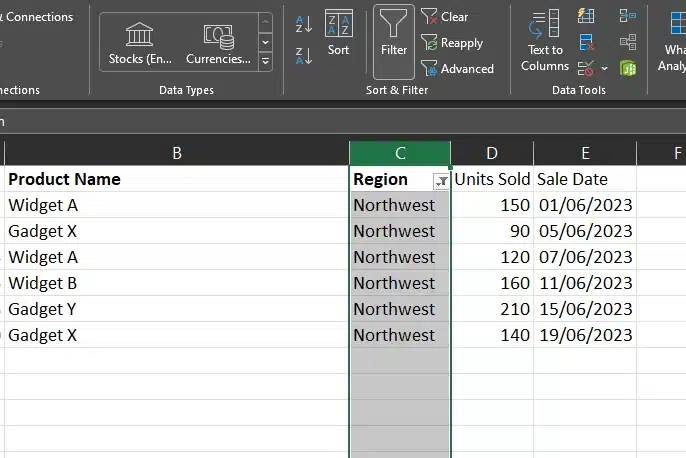
Now you should only see the products that meet those criteria in the list after applying the filter.
Example 3: Total Sales for a Specific Product
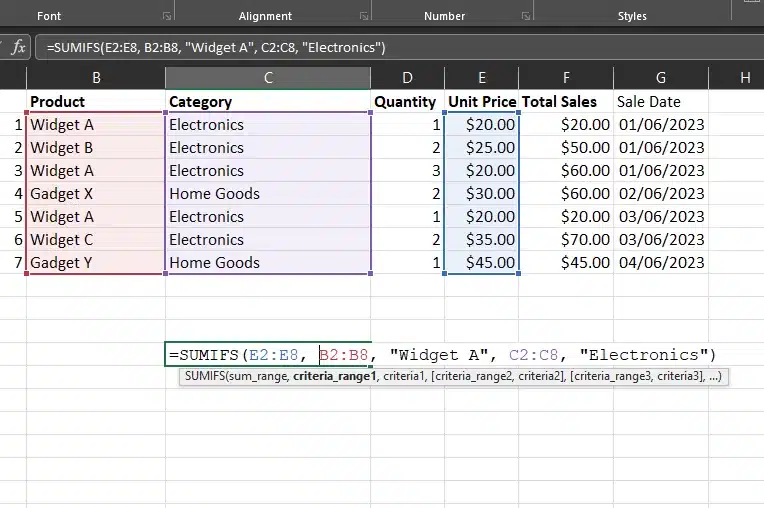
If you want to calculate the total sales for ‘Widget A’ in the ‘Electronics’ category. First, we filter the dataset using a query to show only ‘Electronics’ products.
Then we apply the SUMIFS function:
=SUMIFS([Total Sales], [Product], "Widget A", [Category], "Electronics")This formula gives us the total sales for ‘Widget A’ after filtering out only the electronics.
By harnessing the power of queries within your formulas and functions, you can optimize your data analysis process and uncover valuable patterns and trends hidden within your dataset.
Alright, now that we’ve covered creating some queries, let’s check out how to edit and manage them.
How to Edit and Manage Queries

Once you have created a query, it’s important to manage and edit as needed to ensure accurate and up-to-date results. This involves modifying the query criteria, updating the data range, or adjusting how the results are displayed.
For example, if your initial filter was too broad and now you need to refine it further, simply change the criteria or add additional conditions to narrow down the selection.
Additionally, if the source data has been updated, remember to refresh the query to incorporate these changes.
To maintain a well-organized workbook, consider deleting or renaming queries that are no longer relevant or reorganizing them into logical groups for easier access.
By regularly editing and managing your queries, you can streamline your processing and minimize potential errors caused by outdated or incorrect information.

Now that we’ve covered the basics, let’s see how queries supercharge your formulas and functions.
How to Create and Enhance Data Queries with Excel Power Query

When you jump into Excel’s Power Query feature, you’ll be blown away by its incredible ability to bring in data from all sorts of places.
With the Power Query add-in, Excel users can easily perform the data transformations needed for advanced analysis tasks.
Let’s check out how Power Query enhances your workflow.
Using Power Query from the Data Tab
To start with Power Query in Excel, just click on the ‘Get Data’ option in the Data tab. This opens up a user-friendly interface that gets your data ready for analysis.
Bringing in and Shaping Data
Power Query is great for pulling in data, whether it’s from an Excel table, a CSV file, or another source.
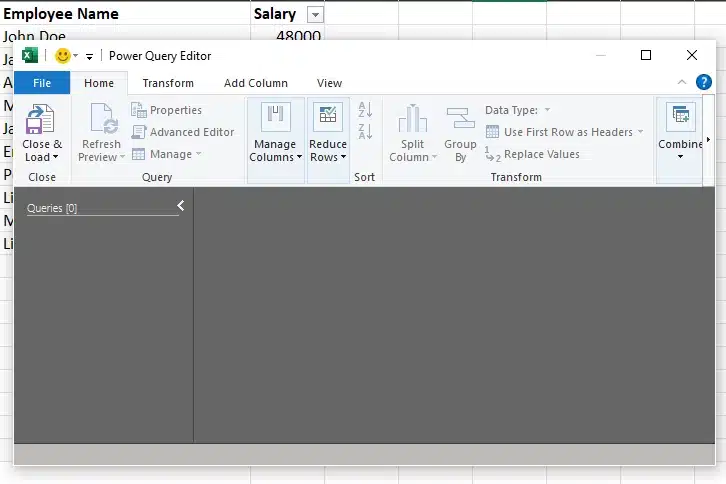
To import Data from a table, select “Get Data”, on the drop-down, select “From other sources” then select “From Tables/Ranges”. Now all your data from the table should be displayed in the power query editor.
It’s also handy when you need to combine or tweak your data, like merging lists or sorting information from different tables.
Next, let’s dive deeper into Power Query’s many features.
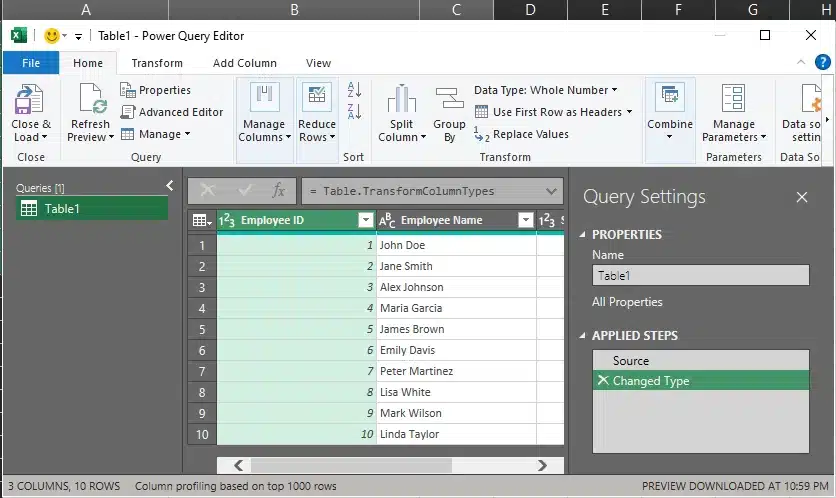
Getting to Know the Power Query Editor
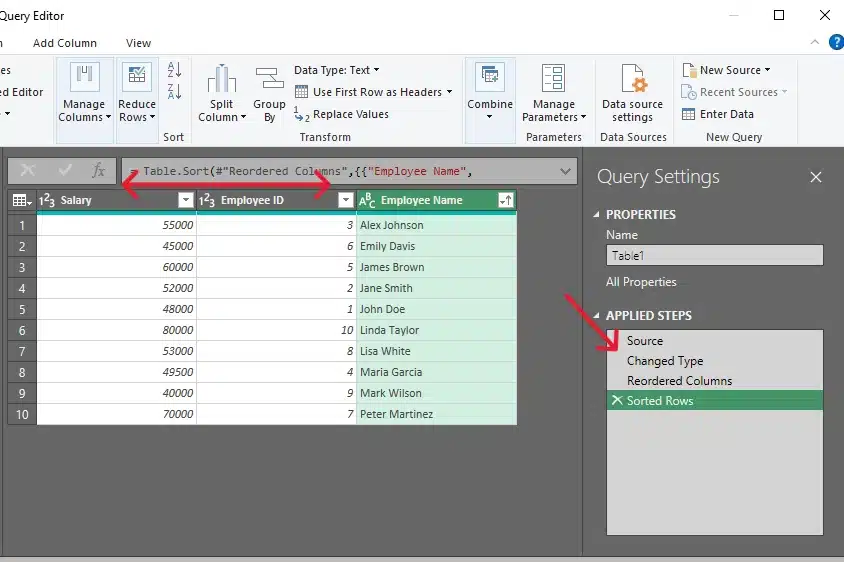
In the Power Query Editor, you can change your data in many ways—like rearranging columns or only showing certain rows.
This tool has lots of options to help you transform your data just how you need it, with a special section for making these changes and a sidebar to help you keep track of them.
Grouping and Summarizing Data
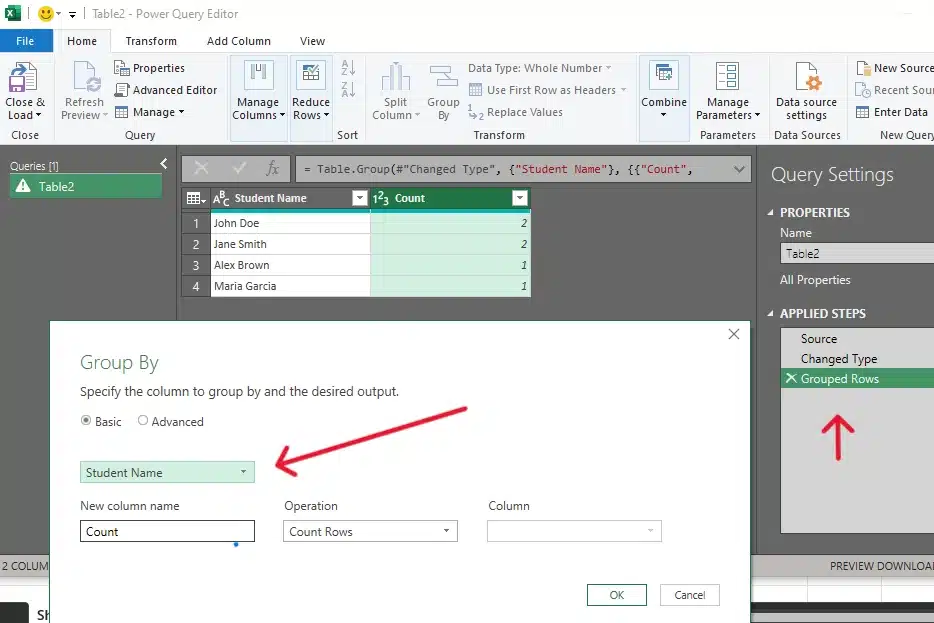
Another useful function of queries is their ability to group and summarize data. In the Query Editor, you can group your data by specific categories (such as student names or course subjects) and then calculate summary statistics like counts, averages, or totals for each group.
This helps you quickly identify patterns and make informed decisions based on your analysis.
Merging Datasets
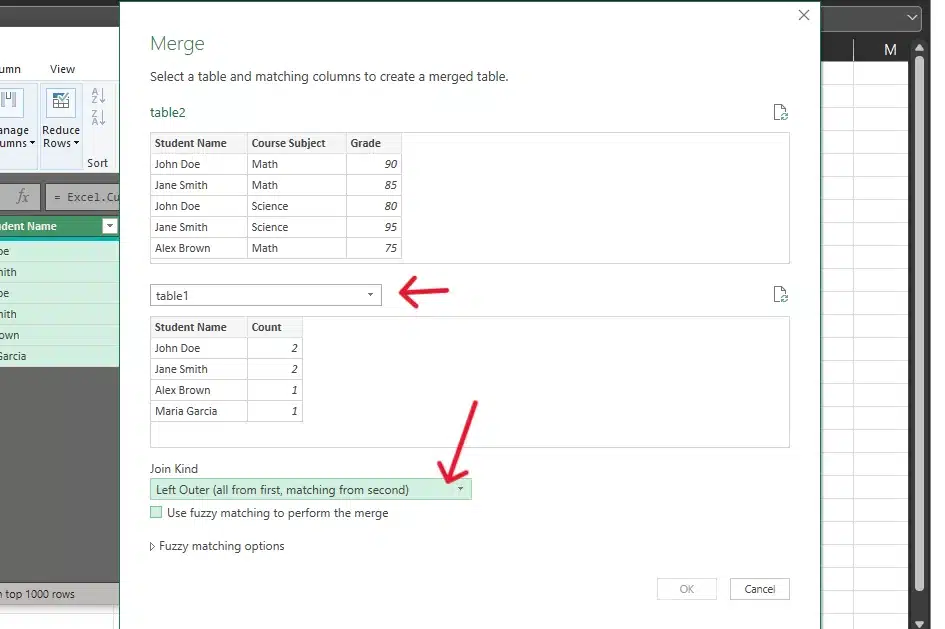
If you have multiple tables or datasets that you need to combine, queries make it easy to merge them into one cohesive dataset. In the Query Editor, simply add another table or query to your current one and use the “Merge” option to combine them.
You can then further refine and transform the combined data as needed.
In Power Query, the merging options are:
Inner Join: Combines rows that have matching values in both tables.
Left Join: Includes all rows from the left table and matched rows from the right table. Rows from the left table without matches in the right table have blanks for the right table columns.
Right Join: Includes all rows from the right table and matched rows from the left table. Rows from the right table without matches in the left table have blanks for the left table columns.
Full Outer Join: Includes all rows from both tables. Rows without matches in the other table have blanks for the missing side’s columns.
Anti Join: Includes rows from one table that do not have matching rows in the other table.
Now that we’ve covered some basics of creating and using queries in Excel, let’s explore connecting to various data sources with Excel’s versatile tools.
Data Source Connection

The beauty of queries lies in their ability to pull data from various sources.
Here are some common types of data sources:
Internal Excel Workbook: You can create a query based on data within the same workbook, such as another worksheet or table. This is useful when you have related datasets that need to be combined or analyzed together.
External Databases: Queries can connect to external databases like Microsoft Access, SQL Server, or Oracle. This allows you to access large amounts of structured data stored in databases without having to import the entire dataset into Excel.
Web Pages: Using queries, you can extract data from HTML tables found on public or intranet websites. This is particularly helpful for monitoring market trends, tracking competitors, or gathering industry-specific information.
Text Files: Queries can also retrieve data from plain text files (e.g., .txt, .csv) stored locally or online. This is ideal for working with simple lists or tabular data that doesn’t require a full-fledged database management system.
Other Spreadsheets: If you have multiple Excel workbooks containing related data, you can create a query that pulls information from one or more of these files.
Queries are super helpful because they let you connect to so many different types of data sources, making it a breeze to analyze and understand even the most complicated information.
Next, let’s examine how to keep your data up-to-date by refreshing queries.
How to Refresh Queries

In Excel, refreshing a query means updating the data it pulls from its source. This is particularly useful if your dataset changes regularly, such as daily sales figures or weekly employee performance reports.
To refresh a query in Excel, follow these steps:
Click anywhere in the query results (the filtered list of students and their grades in our previous example).
On the Data tab in the ribbon menu, click the arrow next to ‘Refresh All’ and then select ‘Refresh’. Alternatively, you could right-click any cell within the query results and choose ‘Refresh’ from the context menu.
As for query management, Excel provides tools to help manage these data connections and queries. You can edit, delete, or view properties of a query by right-clicking any cell within the query results and selecting the appropriate option from the context menu.
Moving forward, let’s see how to optimize our queries for the best performance.
How to Optimize Query Performance

Optimizing query performance is indeed crucial, especially when dealing with large datasets.
To optimize query performance:
Filter Data at the Source: Pre-filtering data in the database can lead to quicker query times by reducing the volume of data Excel processes.
Limit Columns and Rows: Import only what’s necessary to streamline your query’s execution—less data means faster results.
Use Indexes and Keys: Implement indexes and keys in your database to expedite the search and retrieval process for your queries.
Understand Query Folding: Utilize query folding to perform operations directly in the database, minimizing the data load to Excel and enhancing efficiency.
Utilize Advanced Features: Take advantage of Excel’s advanced features, like PivotTables and Power Query, to manage and analyze your data with greater agility and less overhead.
utilizing indexes: By specifying an index in your query criteria, you can significantly reduce processing time and enhance the overall efficiency of your analysis.
By implementing these strategies, users can ensure that their queries run smoothly and deliver accurate results on time.
Next up, let’s tackle some typical query challenges.
Troubleshooting Common Query Issues

While queries offer an incredibly versatile tool for managing and analyzing data in Excel, users may occasionally run into problems.
Alright, let’s check out how to tackle some of these issues.
Some of the problems you might face include:
Error messages are caused by incorrect syntax, which is similar to using the wrong words in a sentence within a formula or function.
Invalid references are comparable to attempting to access a locked resource without the proper permissions or credentials.
Missing data, much like forgetting to bring essential information when working with a dataset.
Circular references, where one query refers back to itself or another dependent query, leading to endless loops and negatively impacting performance.
By thinking about the many challenges you might face when working with data, you’ll be better equipped to handle even the toughest data management tasks.
Now, let’s wrap up our discussion on Excel queries by recapping the key takeaways and final considerations.
Final Thoughts

And there you have it! Queries are a powerful feature of Microsoft Excel, helping you work with massive data like a pro. They empower you to filter, analyze, and sum up huge chunks of information with ease.
To truly harness the power of queries, make sure you understand the different types, learn how to create and manage them, and get cozy with integrating them into formulas and functions.
Before you know it, you’ll be able to unlock hidden insights and optimize your data game!
As you venture further into the exciting world of Excel queries, don’t forget to stay organized, regularly refresh your queries, and diagnose any problems that come along.
This way, your data analysis will remain accurate and reliable, giving you the confidence to make smart decisions.
So go ahead, become an Excel query champion, and conquer the world of data management with style!
Check out some more awesome content on the Enterprise DNA YouTube channel.
FAQ: Understanding Queries in Excel
How can I import data into Excel using a query?
To import data, you can use the built-in data connections in Excel to pull data from sources like text files, Excel files, or databases. With the Power Query technology, you can connect to external data, transform it, and then load it into your Excel workbook for analysis.
What is a data model in Excel, and how does it relate to queries?
A data model in Excel is a collection of tables and their relationships, allowing for more complex analysis and reporting. Queries play a critical role in building a data model by defining how data is imported and manipulated.
Can I use Microsoft Query to manipulate data in Excel?
Yes, Microsoft Query is a tool within Excel that allows you to create, edit, and manage queries to manipulate data from various sources, including SQL Server Analysis Services.
How do queries work with SQL Server Analysis Services in Excel?
Excel can connect to SQL Server Analysis Services using data connections. By setting up a data connection, you can write queries to extract and manipulate data from Analysis Services for further analysis or reporting.
How can I ensure my queries handle required data transformations?
To handle required data transformations, you can use the Power Query Editor to specify steps such as filtering rows, splitting columns, changing column headers, or converting data types before loading the data into an Excel worksheet.
Can I use queries to pull data from a text file into an Excel table?
Yes, you can use Excel queries to import and pull data from text files, CSV files, or XML files directly into an Excel table, where you can perform further analysis.
How does Power Query enhance data transformation within a business intelligence tool?
Power Query serves as a sophisticated business intelligence tool with a robust graphical interface that streamlines the process of transforming data groups. With its intuitive query function, users can manipulate and prepare data for in-depth analysis efficiently.
Can I preview my data before and after applying transformations in Power Query?
Yes, Power Query offers a dynamic data preview feature at multiple stages of the transformation process. As soon as you load queries, a dialog box appears, presenting a snapshot of your loaded data. This allows you to verify and review changes in real time.
How do I import data from a CSV file using Power Query?
Importing data from a CSV file into Power Query is straightforward and efficient. Initiate a new query using the Power Query interface, and select the option to import from a CSV file.
Once selected, a graphical interface will guide you through the import process.
What are query dependencies, and why are they important in Power Query?
Query dependencies in Power Query represent the relationship between different queries within a project. Understanding query dependencies ensures that all the queries are executed in the correct order.
How does the advanced editor contribute to data transformation in Power Query?
The advanced editor in Power Query is an invaluable tool for data professionals who must go beyond the standard transformation capabilities. It allows for the direct editing of the M code, which is the language behind Power Query’s query function.


