
In the world of data visualization and analytics, two industry-leading data visualization tools stand out: Microsoft Power BI (“PBI”) and Tableau. These tools are cutting-edge when it comes to visualizations and data analytics.
Power BI and Tableau are powerful data visualization and business intelligence tools that help organizations analyze and present their data effectively. Both tools offer powerful capabilities for data analysis and reporting, but they have different strengths and features that cater to various user requirements.
In this article, we’ll compare Power BI vs Tableau to help you choose the right business intelligence tool for your data visualization needs.

Power BI vs Tableau
Power BI, developed by Microsoft, and Tableau, now a part of Salesforce, are both designed for handling large data sets and data analysis and offer various storage and connection types.
They also have advanced visualizations to satisfy the most complex business questions or data scenarios.

Though both Power BI and Tableau share some similarities, it’s important to be aware of the differences between them.
While Tableau is known for its user-friendly interface and drag-and-drop functionality, Power BI offers a broader range of usage for non-technical audiences.
Business Intelligence Tool Market
As you delve further into this comparison of Power BI and Tableau, you’ll learn more about the strengths and weaknesses of each tool in terms of data handling capabilities, ease of use, deployment options, and more.
By the end of this article, you’ll be well-informed and better equipped to make a confident decision on whether Power BI or Tableau is the right fit for your organization.

Accordingly, please see the following Gartner Magic Quadrant from the renowned research consulting firm that has analyzed and characterized the top BI players with Power BI and Tableau as the clear leaders.
Gartner Magic Quadrant for BI Platforms
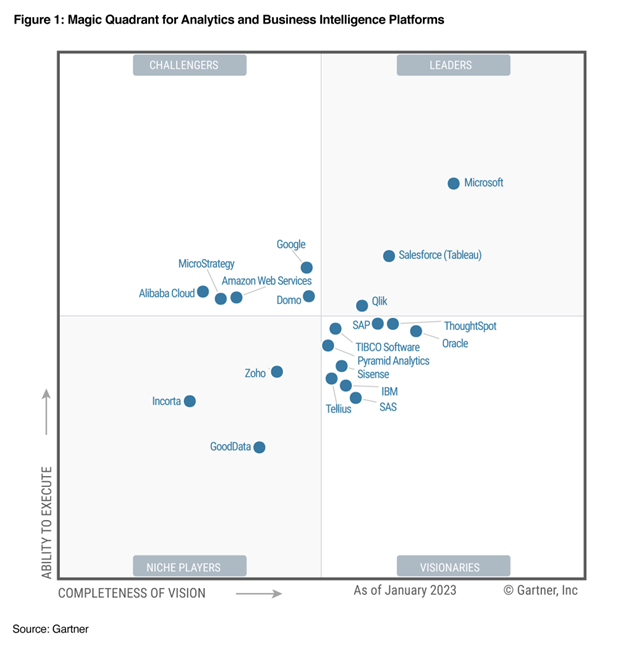
As you can see Power BI and Tableau are both the main leaders aside from an emergent Qlik. This has been the case since Power BI emerged in its current form circa 2017.
Both Power BI and Tableau offer a range of features and capabilities, but understanding the key differences between them is crucial in selecting the right solution for your organization.
In this article, we’ll compare Power BI vs Tableau across various aspects, including ease of use, data connectivity, visualization, collaboration, and pricing.
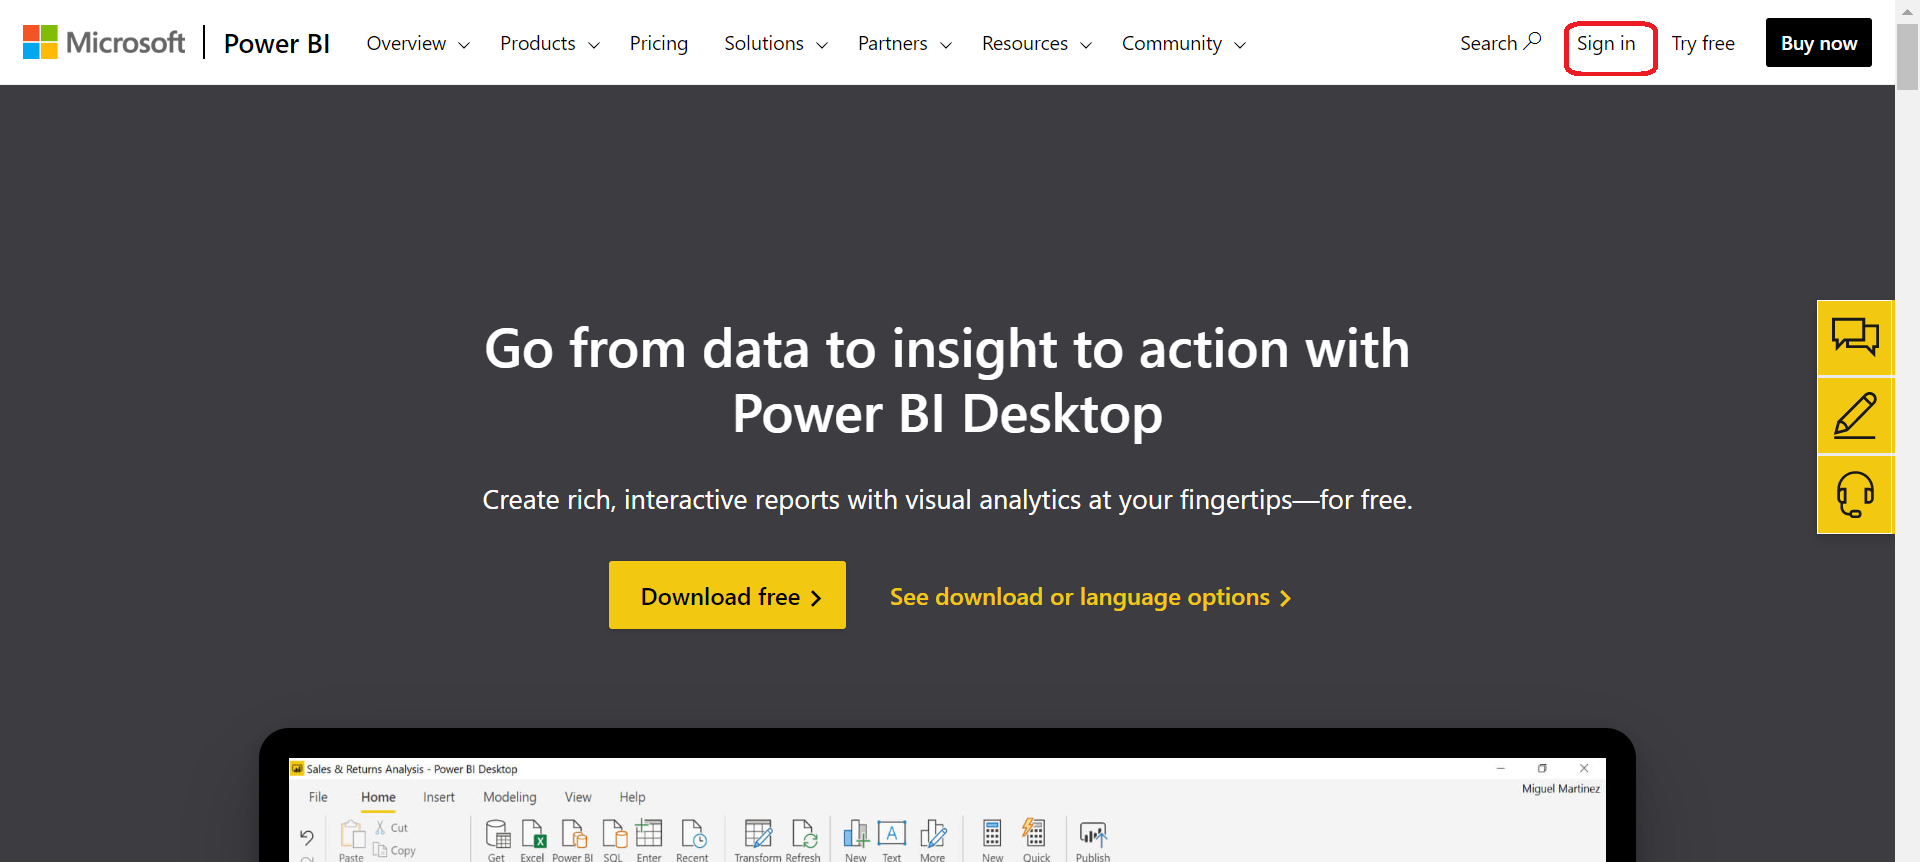
Power BI Overview
Microsoft Power BI is a powerful business intelligence (BI) and analytics platform that enables you to visualize and analyze your data, making Power BI more accessible and understandable.
Behind the scenes, Power BI relies on a data engine called xVelocity (formerly Vertipaq) that sorts and indexes the data for specific analytical purposes. In testing, it’s faster than Tableau’s Hyper data engine.
In this section, you’ll learn about some of the key features and pricing of Power BI.
Key Features of Power BI
- Data Preparation and Integration: Power BI has strong integration with Microsoft products, such as Excel and SQL Server, making it convenient for users who regularly work with these applications along with the Power BI data visualization tool.
- Data Modeling: With Power BI, you can create complex data models using Data Analysis Expression (DAX), a formula language specifically designed for data manipulation and analysis.
- Visualizations: Power BI offers a wide range of visualization options, including bar charts, pie charts, and maps, allowing you to create striking and informative visuals that are easily customizable.
- Collaboration and Sharing: With Power BI’s collaboration features, you and your team can collaborate on reports and dashboards, and easily share them across the organization.
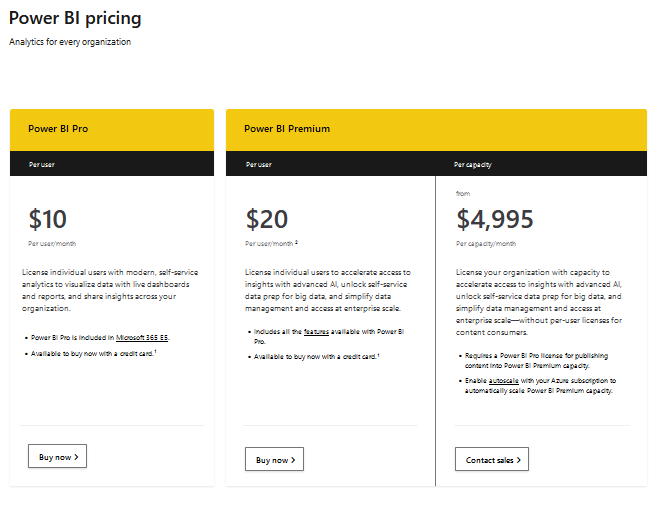
Power BI Pricing
Power BI offers different pricing options to cater to the needs of various Power BI users and organizations:
- Power BI Desktop: This version of Power BI is perfect for individual users looking to explore data visualization and analysis. Power BI Desktop includes core data visualization and analysis features, which are helpful when performing data science, but has some limitations on data size and collaboration functionality.
- Power BI Pro: Priced at $9.99 per user per month, Power BI Pro offers advanced features such as collaboration, app sharing, and broader data source access compared to the free version.
- Power BI Premium: For large organizations requiring dedicated cloud capacity or on-premises options, Power BI Premium starts at $5,000 per month and is available at $20,000 per month for a dedicated cloud capacity or $20,000 per core for an on-premises capacity.
- Power BI Report Server: Along with Power BI Premium, Power BI Report Server is available for on-premise data analytics needs.
- Power BI Mobile: Furthermore, Power BI has a wonderful app to be able to view and access Power BI content online. It is a great support for data analysts.
These Power BI prices are subject to change, and it’s always a good idea to visit the official Power BI pricing page for up-to-date information for Power BI users.
Tableau Overview
Underneath the program, Tableau relies on a data engine called Hyper that also sorts and indexes data specifically for analytical purposes. However, in testing, it is a bit slower than Power BI’s xVelocity data engine.
As you explore Tableau, you’ll find it offers interactive, user-friendly dashboards with customizable options to help address a wide range of business needs.
Key Features of Tableau
Tableau offers a range of key features that make it a popular choice for data visualization and analytics. Here are some of the notable features of Tableau:
- Visual Data Exploration: Tableau allows you to create and explore visually appealing charts and graphs, enabling you to identify trends, patterns, and relationships in your data. This is particularly helpful when conducting data science.
- Drag-and-Drop Interface: Its intuitive drag-and-drop interface makes it easy for you to quickly build and customize visualizations and dashboards tailored to your unique requirements.
- Integration: Tableau seamlessly integrates with numerous data sources, including cloud-based storage, relational databases, and popular spreadsheets.
- Collaboration: Share your interactive dashboards with your team members and stakeholders, promoting better teamwork and collaboration.
Tableau Pricing
Tableau offers various pricing plans designed to meet the needs of every user, from individuals to large enterprises. Some of the available options include:

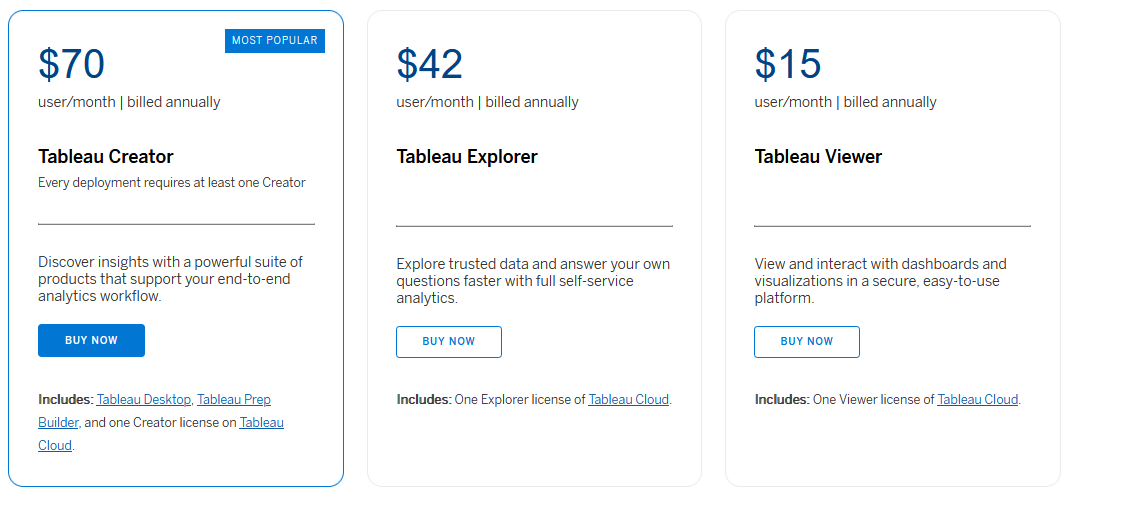
- Tableau Desktop Creator: Priced at $70 per user per month, this plan is suitable for individuals and small teams looking for a single platform for data exploration, checking out data sources and visualization.
- Tableau Explorer: Catered to larger teams, this plan costs $35 per user per month, providing access to a Tableau Server or Tableau Online environment for dashboard interaction, data exploration, and collaboration.
- Tableau Viewer: For team members who only need to view and interact with published dashboards, the Tableau Viewer plan is available at $12 per user per month.
- Tableau Server: For an enterprise-grade system, you can go with custom pricing to host a Tableau server for team sharing and data management.
Keep in mind that tailored solutions are also available for specific sectors, such as academia and nonprofit organizations, which may have adjusted pricing options catered to their unique needs.
Also, remember that these prices are subject to change, and it’s always a good idea to visit the official Tableau pricing page for up-to-date information.
Power BI and Tableau: Which One is Easier to Use?
Both Power BI and Tableau aim to provide user-friendly interfaces and make data visualization and analytics accessible to a wide range of users.
However, there are some differences in terms of ease of use between the two tools:
1. Power BI
When it comes to ease of use, Power BI has a simpler interface and is better suited for the general public. As a user, you’ll find it easier to navigate Power BI, especially if you have experience with Microsoft’s suite of tools, like Excel.
The drag-and-drop functionality of Power BI allows you to create reports and dashboards with minimal effort. There are also readily available Power BI templates, which you can use to get started.
2. Tableau
Tableau is designed for data analysts and might take you a little more time to master. However, it also offers a user-friendly interface and provides drag-and-drop functionality to create visualizations.
Tableau thrives in its ability to create complex visuals and offers a wide range of data visualizations that may require some practice to get used to.
Here are some key aspects to consider while comparing both tools:
- Drag-and-drop functionality: Both Power BI and Tableau offer convenient drag-and-drop functionality for creating visuals and reports.
- Templates: Power BI has built-in templates, while Tableau offers free templates through Tableau Public and paid extensions in Tableau Desktop.
- Training materials: Both Power BI and Tableau have extensive resources and tutorials available to help you build your skills. Tableau’s website has a comprehensive learning platform, and Microsoft also offers Power BI documentation, Power BI tutorials, and webinars.
- Integration: Power BI seamlessly integrates with other Microsoft products and services, providing a cohesive experience if you’re already using the Microsoft ecosystem. Tableau also integrates with popular data sources and platforms, but its integration with non-Tableau-specific tools might require additional work.
Therefore, the ease of use for Power BI vs Tableau depends on your preferences and familiarity with Microsoft tools and more complex data visualizations. Power BI’s interface is more user-friendly for beginners, while Tableau’s advanced features cater to data analysts.
Power BI and Tableau Tool Comparison
Power BI and Tableau are two of the leading tools in business intelligence, both offering unique features and capabilities. This comparison will focus on the tools available within their respective ribbons, essentially the primary navigation menus or toolbars in both applications.
1. Data Connectivity Tools
Power BI
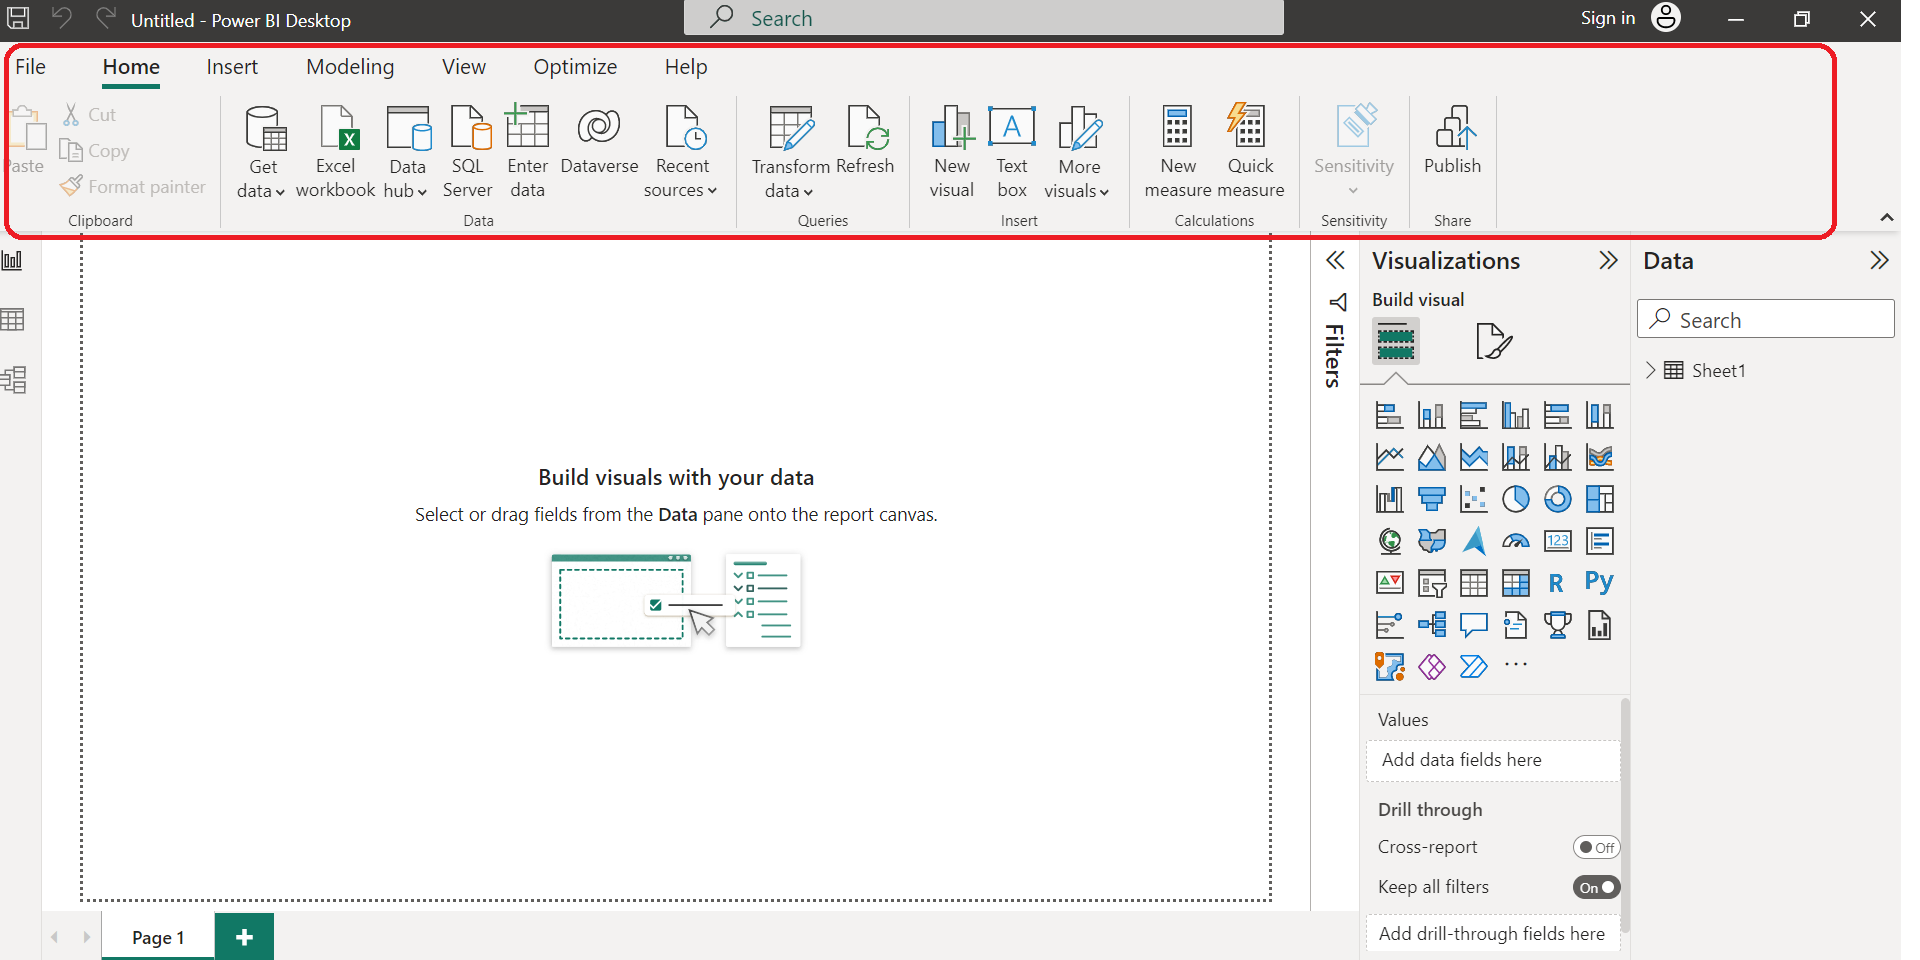
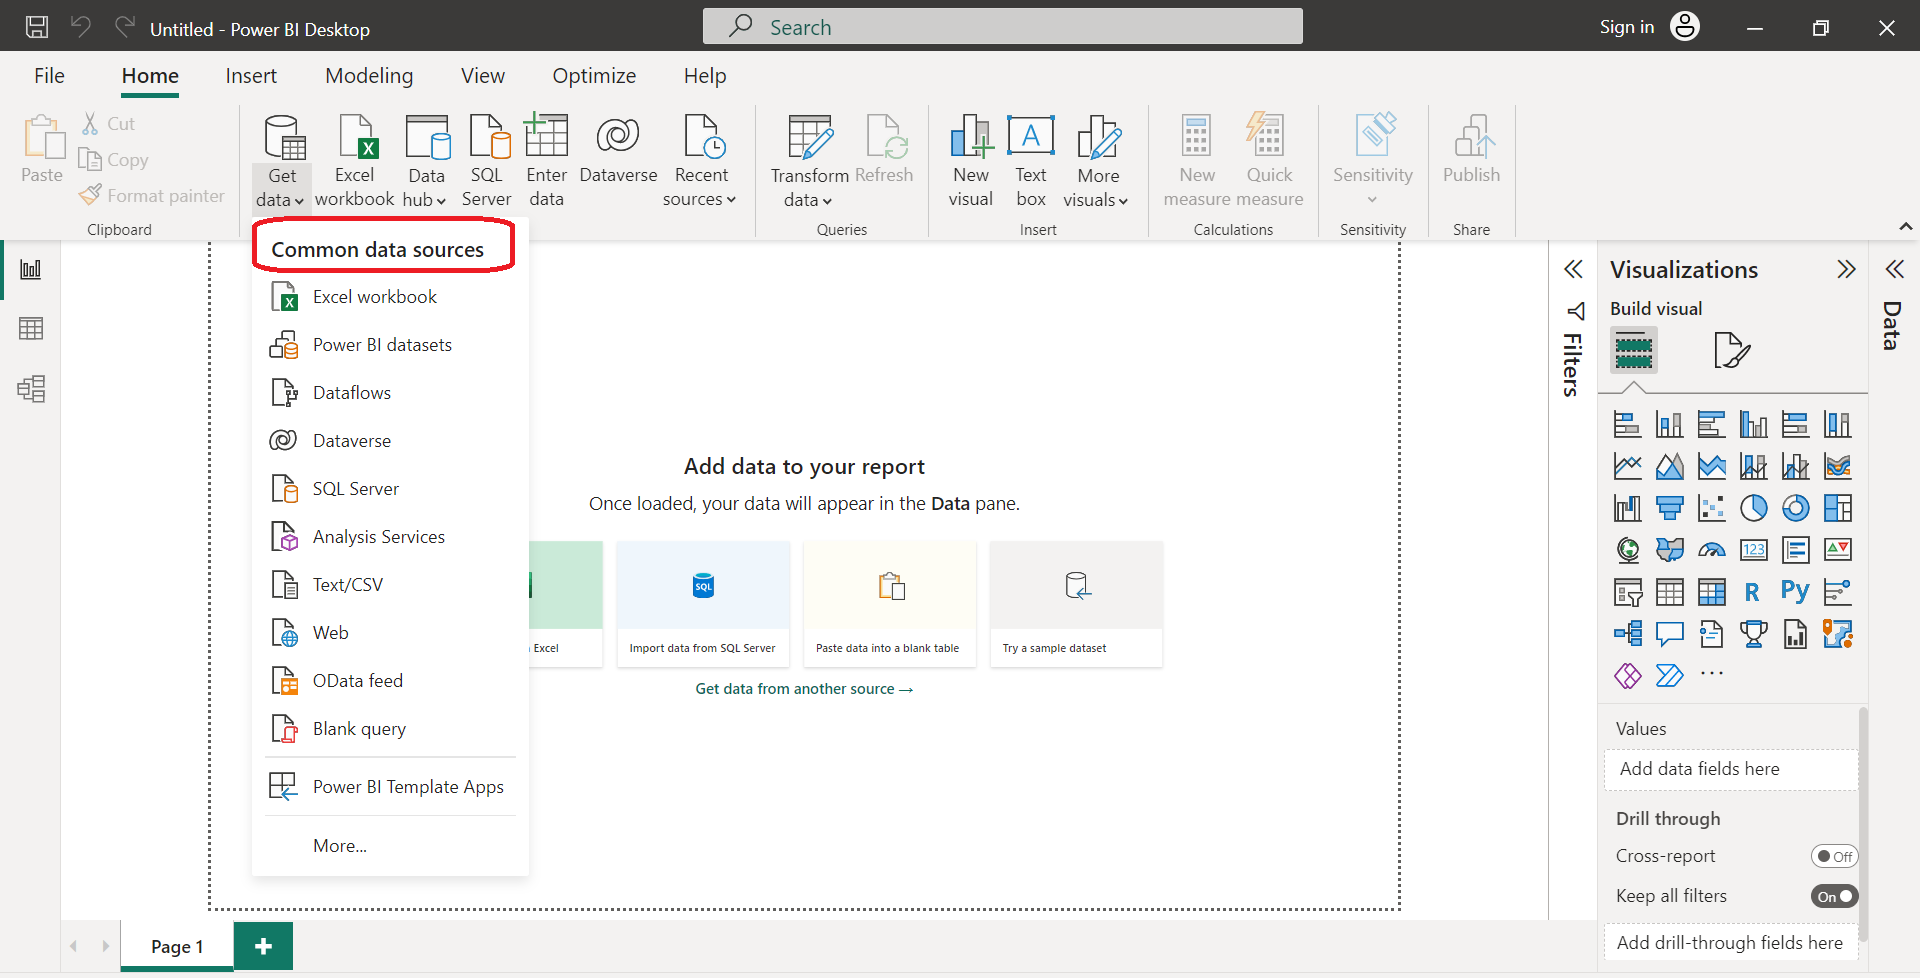
Power BI’s ribbon includes an array of data connectivity tools under the ‘Home’ and ‘Transform Data’ tabs. These tools allow users to connect to a wide range of data sources, including Excel, SQL Server, web-based data, and more.
Once connected, the ‘Transform Data’ tools enable users to manipulate the dataset, preparing it for further analysis.
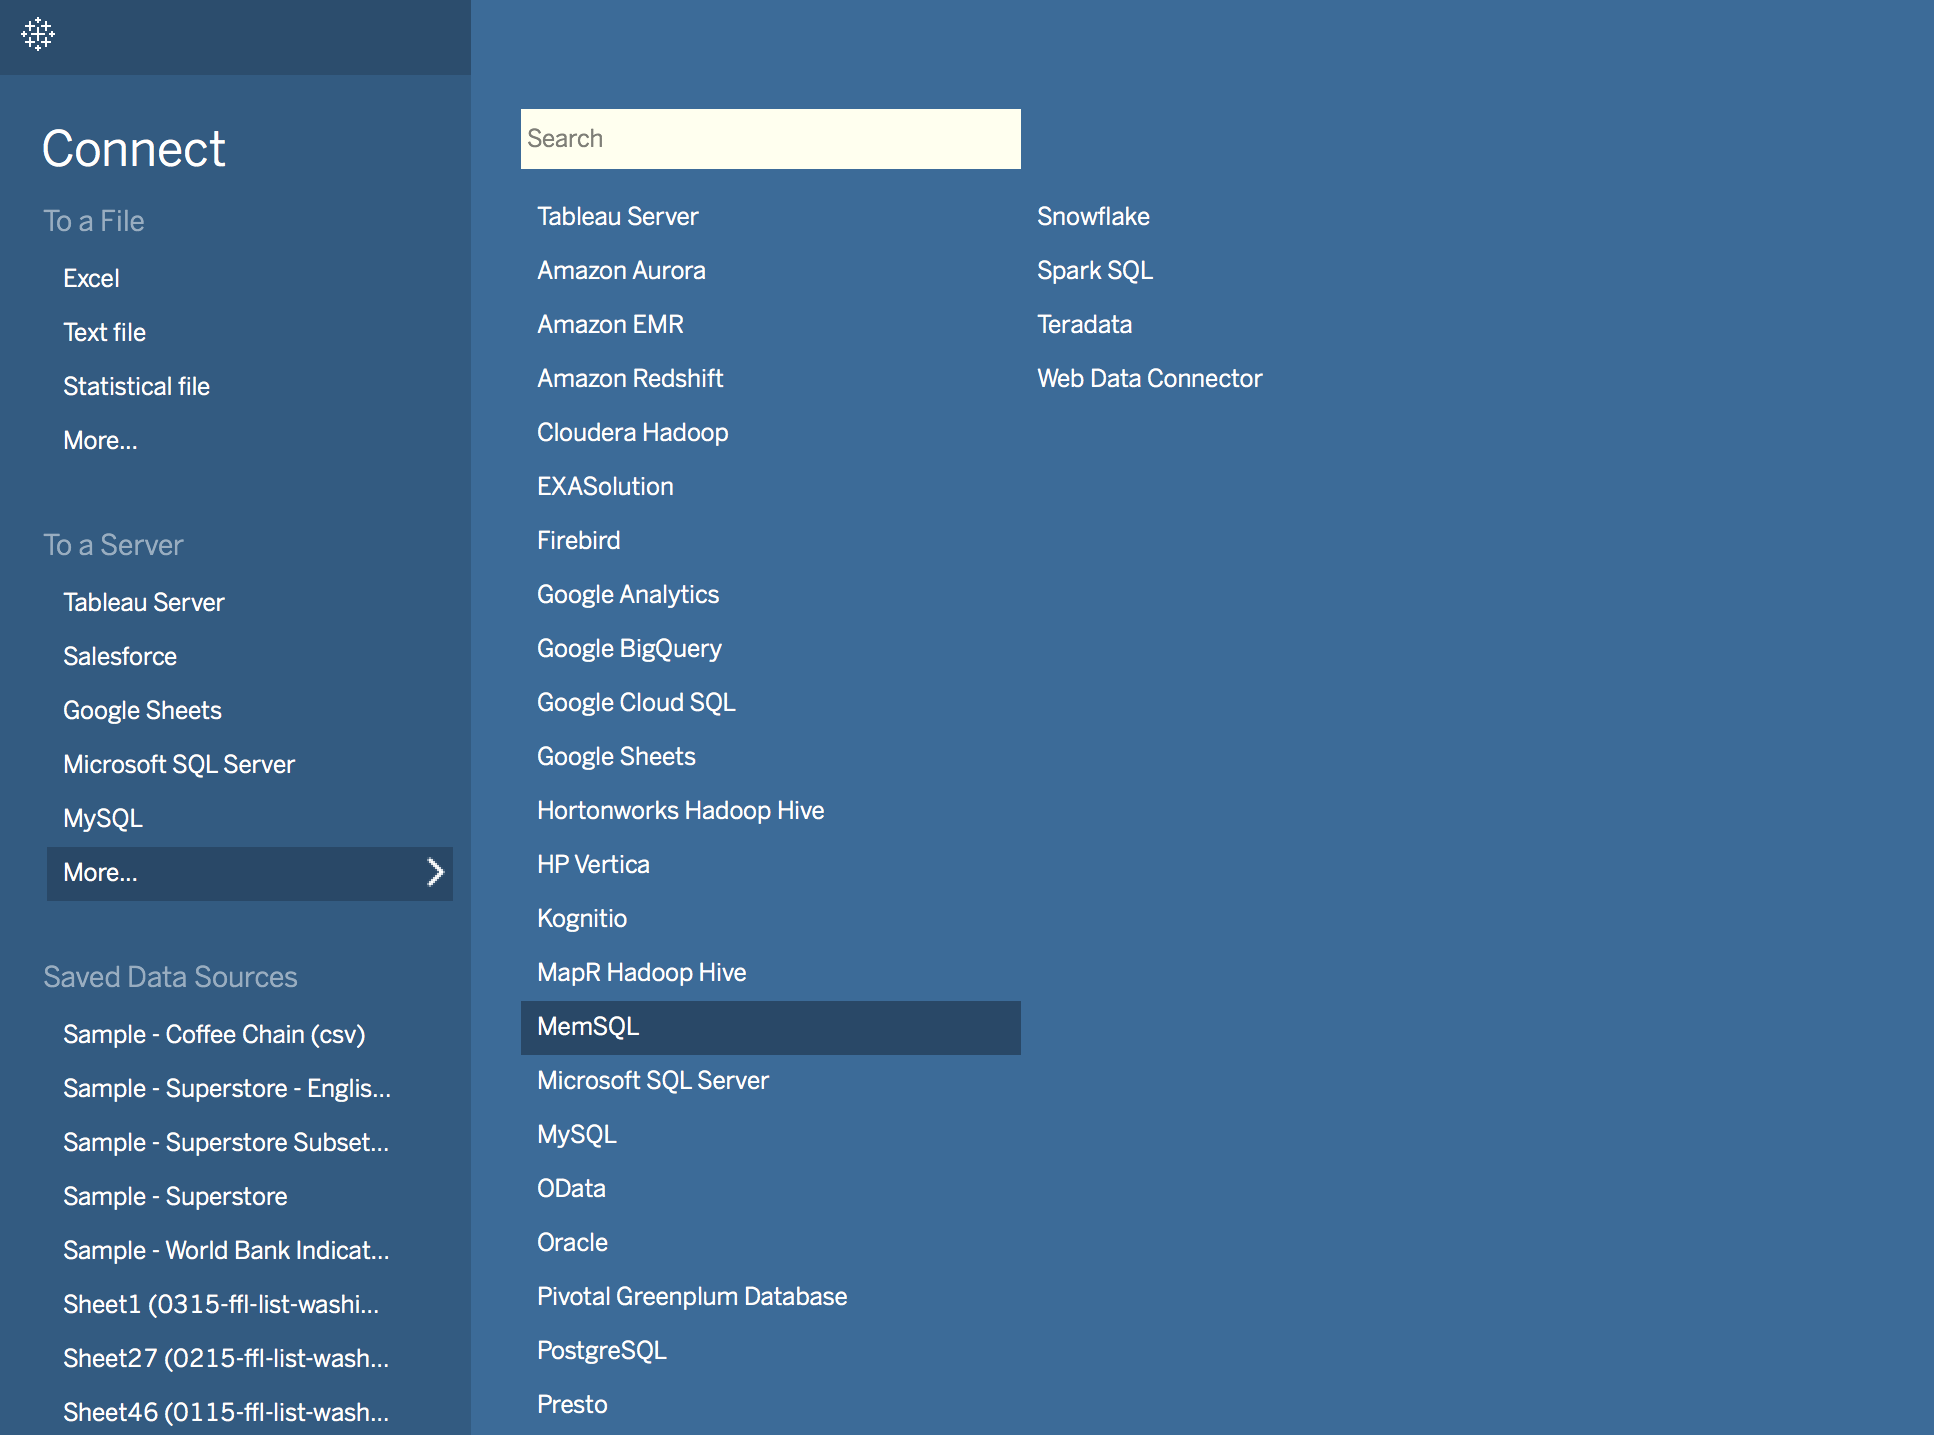
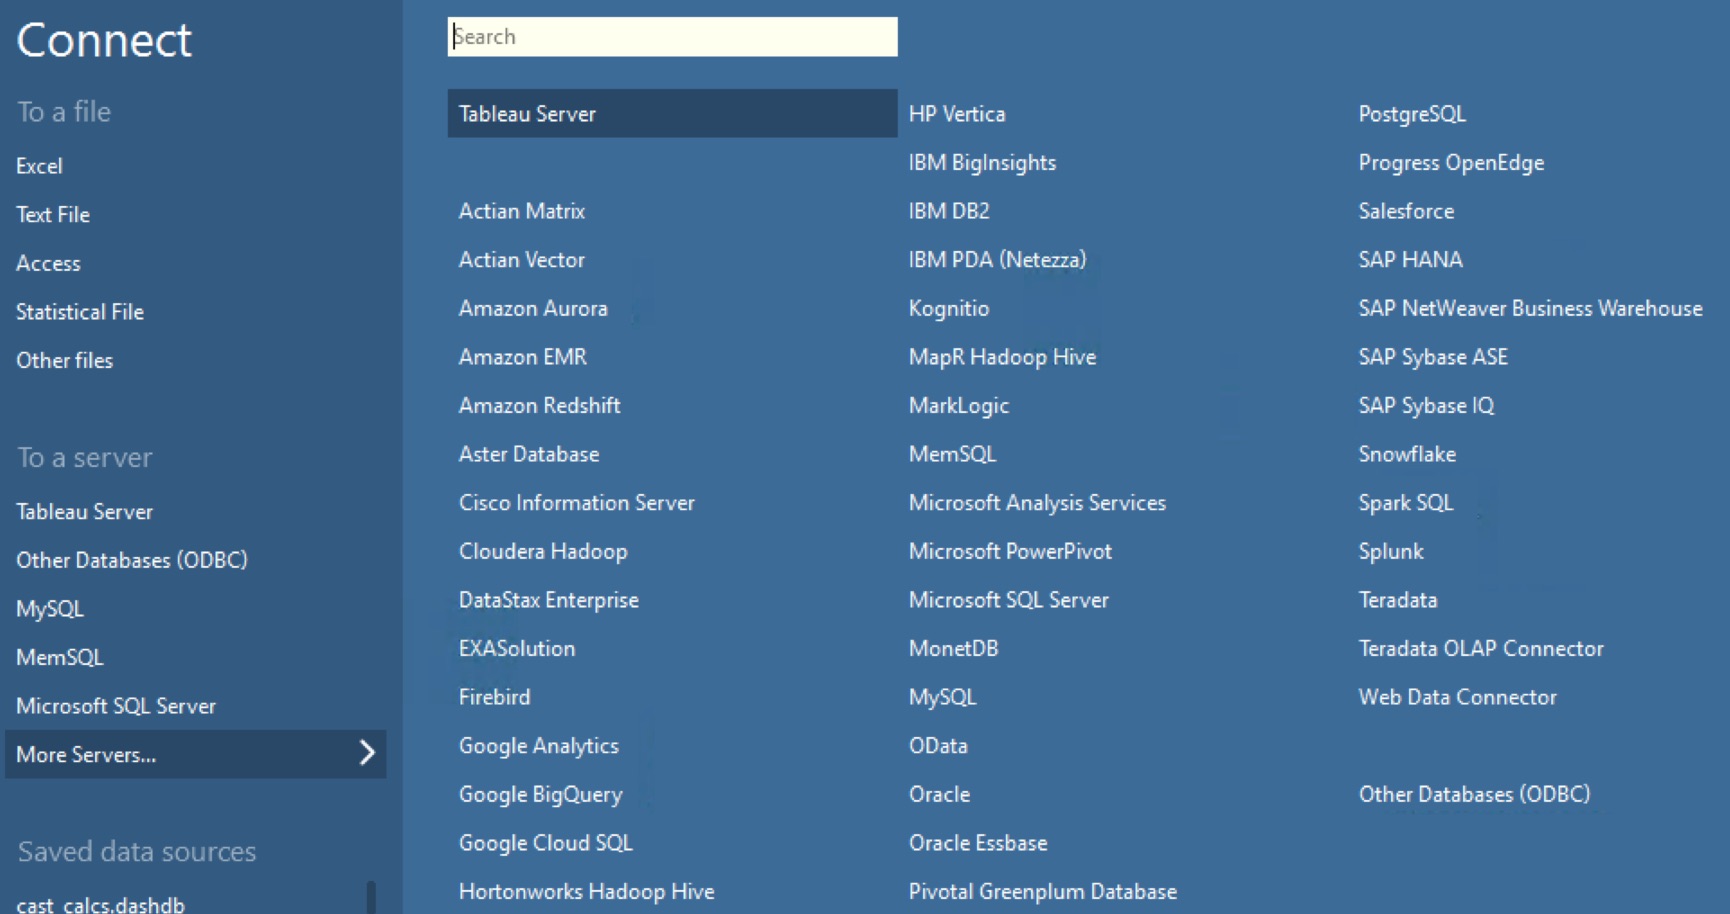
Tableau
Tableau’s ribbon hosts a ‘Data’ tab providing the ‘Connect’ option to link to a diverse array of data sources. The data pane in Tableau enables a comprehensive view of the connected data and offers several options for manipulating the dataset.
2. Calculation Tools
Power BI
Power BI provides robust calculation tools under the ‘Modeling’ tab. Users can define new measures using DAX (Data Analysis Expressions), a formula language designed for data modeling.
Tableau
In Tableau, the ribbon features an option to create calculated fields. Tableau’s calculation language is highly versatile, allowing users to create complex calculations, logical expressions, and user-defined functions.
3. Collaboration Tools
Power BI
Power BI’s ribbon includes a ‘File’ tab, where users can find options to publish reports to the Power BI service, facilitating collaboration. Users can also export and share reports through various formats like PDF or PowerPoint.
Tableau
Tableau offers collaboration tools under its ‘Server’ tab, which allows users to publish workbooks, data sources, and dashboards directly to Tableau Server or Tableau Online. Tableau’s ‘File’ tab also offers export options to share workbooks.
Both Power BI and Tableau are powerful business intelligence tools. The choice between the two often depends on specific needs and contexts.
Power BI is more user-friendly and cost-effective, making it ideal for smaller businesses or those within the Microsoft ecosystem.

On the other hand, Tableau offers more advanced data handling, visualization, and analysis capabilities, which may be more suited to larger businesses or those requiring more in-depth data analysis.
Data Visualization and Reporting in Power BI and Tableau
When it comes to data visualization, both Power BI and Tableau offer powerful features and capabilities.

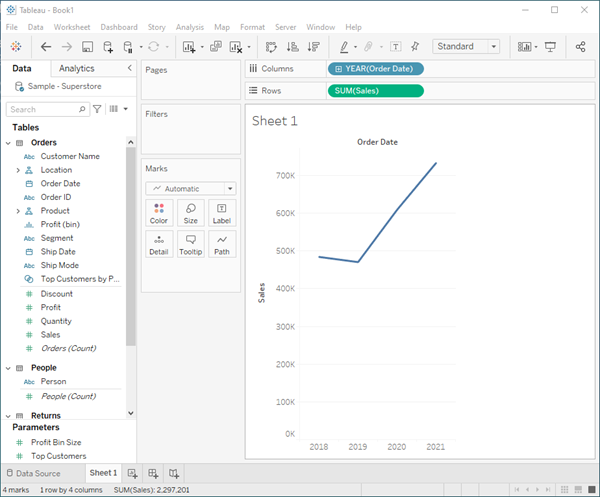
1. Tableau
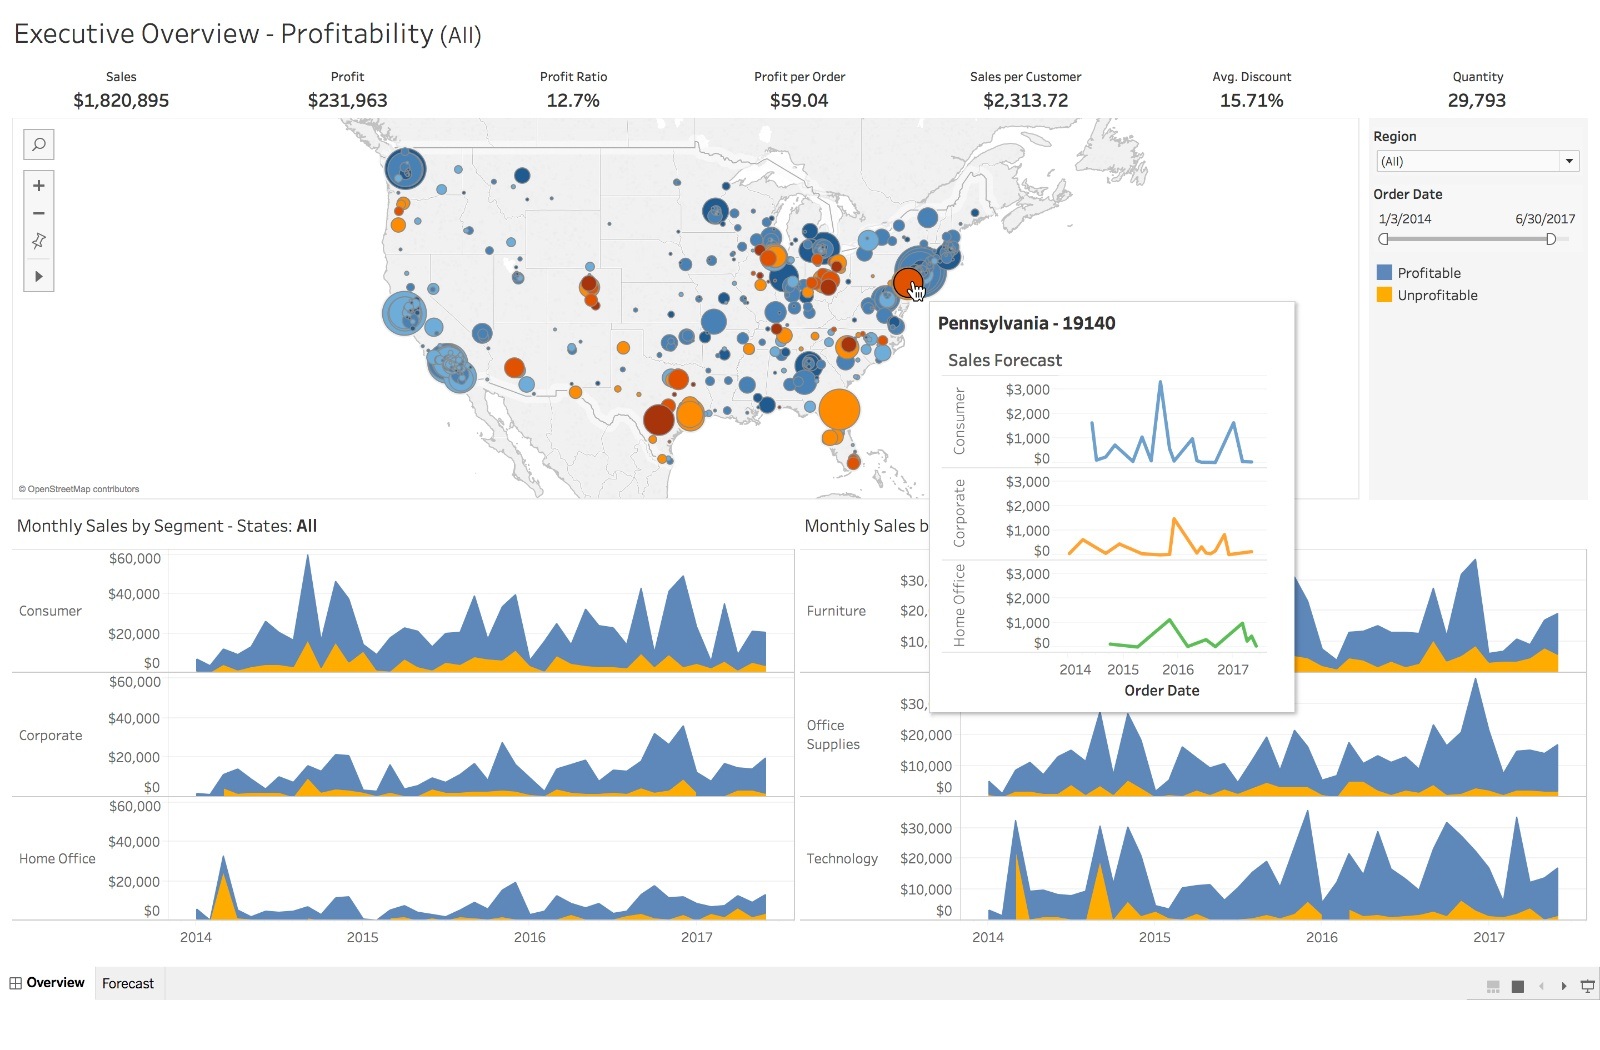
In Tableau, you benefit from its strong data visualization prowess, which allows you to create highly customizable and visually appealing reports.
Tableau is known for handling large volumes of data efficiently, which can be crucial when your organization relies on complex and extensive data sets.
Some features of Tableau’s data visualization include:
- Interactive dashboards
- A wide variety of chart types
- Advanced visual analytics tools
- Geospatial analysis
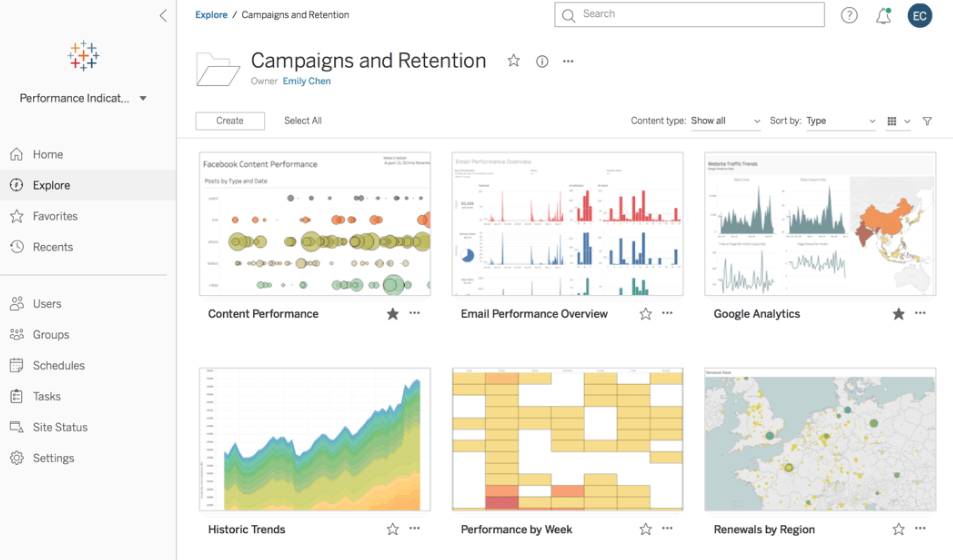
Example Tableau Dashboard
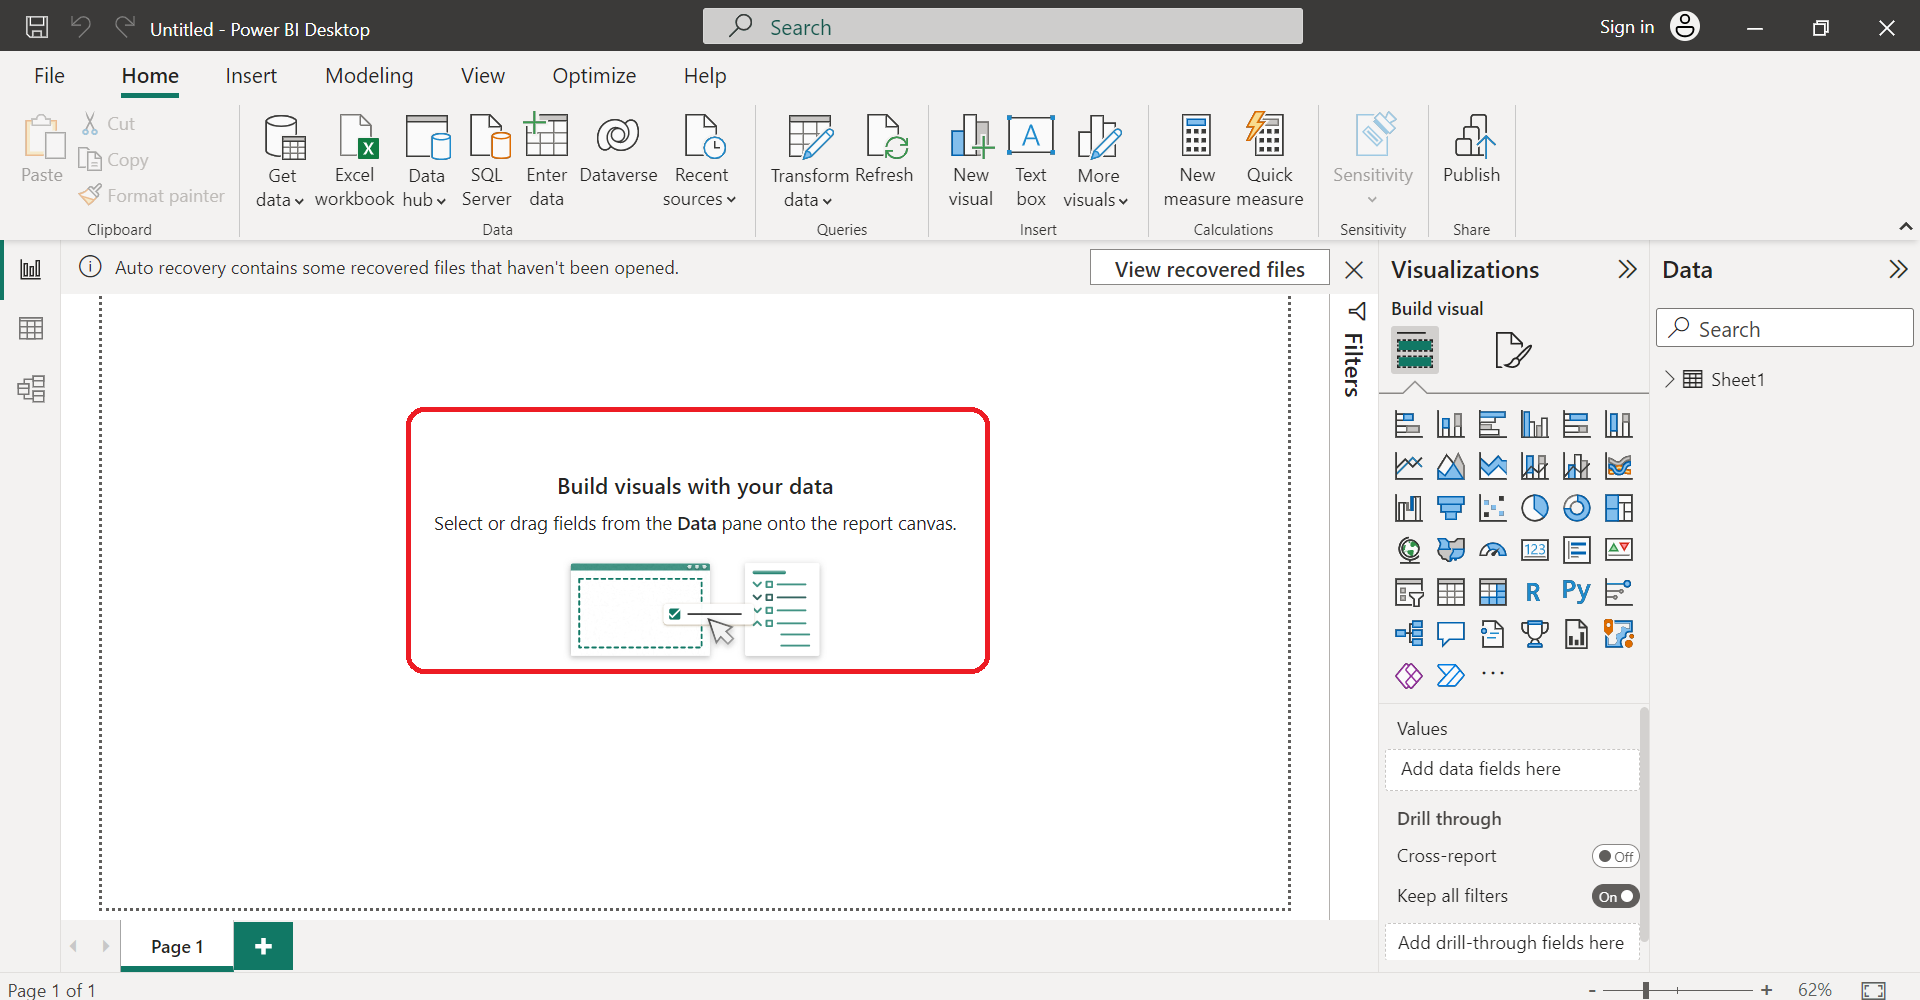
2. Power BI
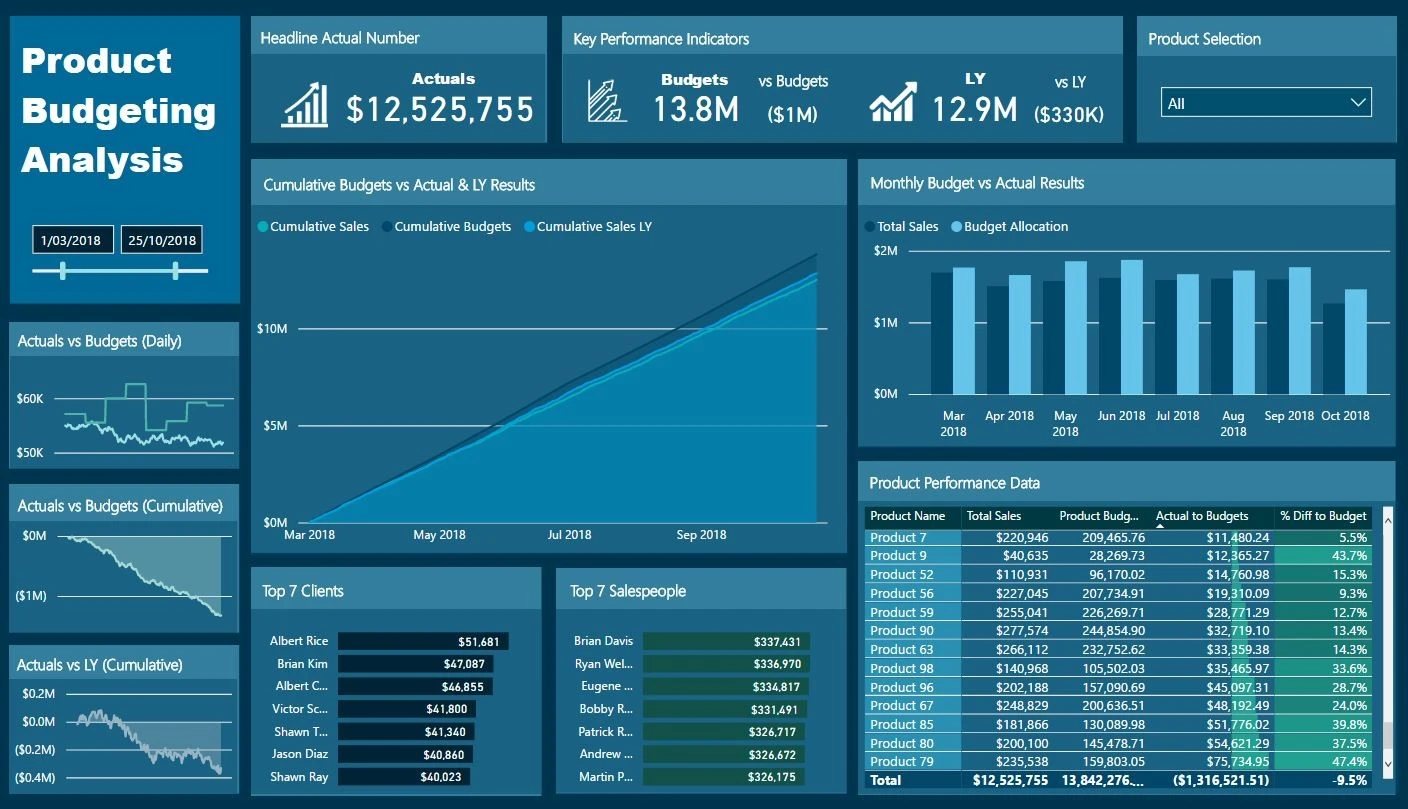
On the other hand, Power BI provides an easier learning curve with its intuitive interface and drag-and-drop functionality. This makes it an excellent choice if you need to quickly create insightful reports without extensive expertise.
Power BI also works well with limited data volumes and integrates seamlessly with Microsoft’s other applications and services.
Some features of Power BI’s data visualization include:
- Quick, customizable visualizations
- Numerous data points for visualization
- Extensive library of visuals and custom visuals
- Integration with AI and machine learning
Example Power BI Dashboard
In terms of reporting, both Tableau and Power BI allow you to create interactive and shareable reports. Tableau emphasizes more flexible report creation with options for custom formatting and advanced calculations. This enables you to create highly tailored reports that suit your specific needs.
Power BI, on the other hand, focuses on a more streamlined approach to report creation. With built-in templates and themes, you can easily standardize your reports and maintain a consistent look and feel across your organization. Additionally, Power BI offers robust collaboration tools that make sharing and editing reports a breeze.
Ultimately, the choice between Power BI vs Tableau for data visualization and reporting will depend on your specific requirements, budget, and familiarity with these tools. Both offer unique strengths that cater to different user preferences and business needs.
Integration and Data Sources
When it comes to integration and data sources, Power BI vs Tableau both are designed to handle a diverse array of data sources and connections. As you consider which tool is right for your needs, keep these points in mind:
1. Power BI
Power BI is more tightly integrated with Microsoft products, like Excel and SQL Server. This makes it easier for you to work with data already in Office 365 or stored in Azure, and you can save time by using familiar tools.
However, Power BI also supports a wide range of other sources like CSV, JSON, and third-party connectors for platforms like Google BigQuery, Amazon Redshift, and Salesforce. Ultimately, Power BI has over 275+ connectors.
2. Tableau
Tableau, on the other hand, is known for its ability to connect to a broader range of data sources, including cloud-based databases and web services. This can be advantageous if you’re working with diverse data from multiple platforms.
Similar to Power BI, Tableau connects to file types like MS Excel, CSV, JSON, and offers additional data connectors for platforms like Google BigQuery, Amazon Redshift, and Salesforce. In the end, there are 100+ main connectors for Tableau.
In terms of data handling capacity, both tools can handle large amounts of data. Tableau’s cloud storage capacity is up to 100 GB, while Power BI Premium can support data models up to 400 GB (compressed memory). This should provide you with enough flexibility to manage your datasets effectively.
Regarding expression languages, Tableau uses MDX (Multidimensional Data Expressions) for handling measures and dimensions, while Power BI uses DAX (Data Analysis Expressions) for calculating and measuring columns.
Both are designed to query data, but each language has unique strengths and potential limitations depending on your specific use case. DAX can be intuitive as it has the benefit of being like a cross between MS Excel formulas and SQL query languages.
To summarize:
- Power BI’s integration strength lies in its compatibility with Microsoft products.
- Tableau has a broad range of data source connections.
- Both tools can handle large amounts of data.
- Tableau uses MDX while Power BI uses DAX for their respective expression languages.
As you compare Power BI and Tableau, consider your specific requirements, and take the time to analyze how each tool aligns with your needs for integration and data sources.
Key Power BI Connectors

Key Tableau Connectors
Data Security and Governance
When considering Power BI and Tableau for your business intelligence needs, one critical aspect to evaluate is data security and governance.
Both tools offer different approaches and features in this area, so it’s essential to understand these differences to make an informed decision for your organization.
1. Power BI Desktop and Service
In Power BI, you’ll find a comprehensive set of security features designed to keep your data safe. Some notable aspects of Power BI desktop and service security include:
- Single Sign-On (SSO): Power BI supports SSO, streamlining access to the platform for your organization’s users.
- Row-Level Security (RLS): You can define data access permissions on a per-row basis, ensuring users only access the data they’re authorized to see.
- Data Encryption: Power BI encrypts data at rest and in transit, providing an additional layer of protection.
2. Tableau Desktop and Server
Tableau also prioritizes data security, offering features such as:
- Single Sign-On (SSO): Tableau supports SSO, making it easy for your users to access the platform using their existing credentials.
- Row-Level Security (RLS): As with Power BI, Tableau allows you to implement RLS, ensuring data access is limited to authorized users.
- Data Encryption: Tableau ensures your data is protected with encryption both at rest and while in transit.
In terms of governance, Power BI and Tableau both provide a range of features to help you manage and control data access, sharing, and collaboration:
- User, Group, and Permission Management: Both tools have a robust system for managing users, groups, and permissions, allowing you to control who has access to specific dashboards, reports, and data sources.
- Version Control: Power BI and Tableau offer version control capabilities, helping your team collaborate without losing track of changes made to your data visualizations.
Both Power BI and Tableau have similar capabilities to handle data security and governance features. It’s important to consider your organization’s technology ecosystem in order to choose the tool that best aligns with your organization’s requirements and policies.
Evaluate the specific features mentioned above and consider the unique needs of your organization when making your decision.
Community and Support
Power BI and Tableau both have strong communities and support networks in place to help you get the most out of their respective platforms.
1. Power BI
When it comes to Power BI, Microsoft provides numerous resources for users to learn, connect, and share their experiences with the tool. You can access:

- Power BI Community: This extensive forum allows you to ask questions, share your knowledge, and learn from other Power BI users.
- Power BI Guided Learning: Microsoft offers documentation and tutorials that cover everything from the basics to advanced features in Power BI.
2. Tableau
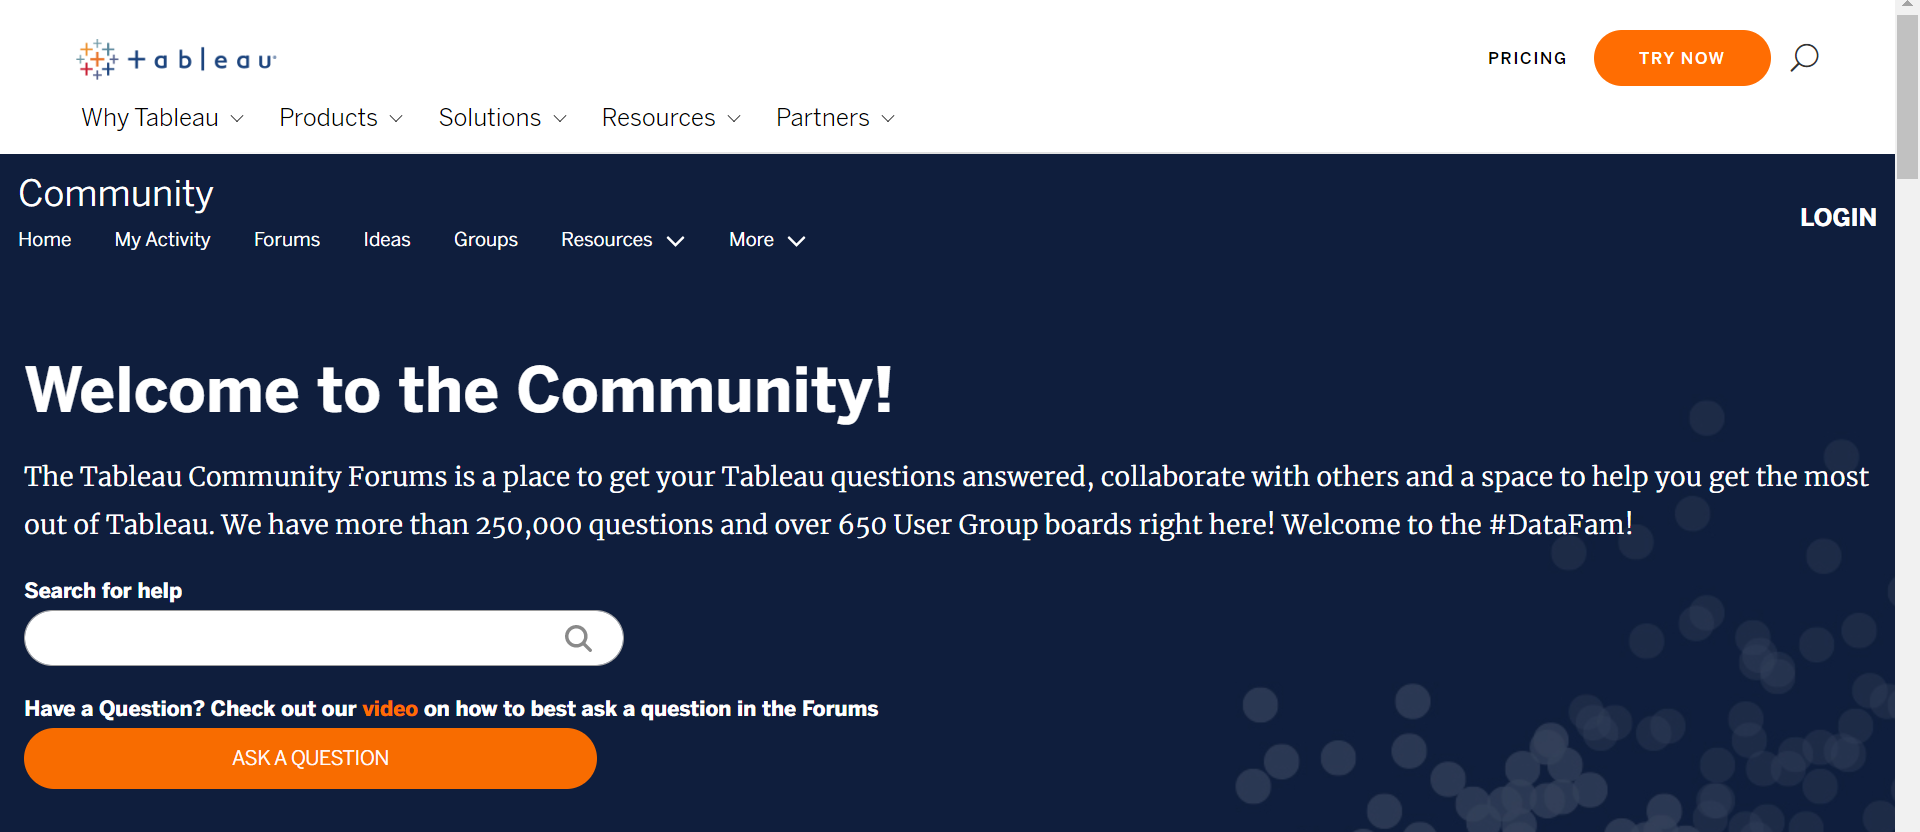
Tableau’s community and support network are similarly robust. You can take advantage of the following resources:
- Tableau Community: Like Power BI’s forum, this is a platform to ask questions, find answers, and engage with other Tableau users.
- Tableau Public Gallery: This gallery showcases impressive data visualizations created by users, allowing you to learn from real-world examples and draw inspiration for your own projects.
- Tableau Training and Tutorials: Tableau offers a wealth of video tutorials and training resources for users at various skill levels.
To further enhance your learning experience, consider participating in workshops, local meetups, and conferences. Both Power BI and Tableau host annual conferences where users gather to share best practices and network with industry professionals.
Remember to explore third-party resources, such as YouTube channels (example tutorial), blogs, and online courses, to deepen your understanding and strengthen your skills in Power BI or Tableau.
Final Thoughts on Power BI vs Tableau
In the end, your choice between Power BI and Tableau will depend on factors such as budget, data size, user experience, related toolings such as Microsoft products, and the complexity of the analyses. Let’s summarize the key differences between the two tools:
- Pricing: Power BI generally has more affordable pricing, with a free version available for individual use and a $9.99 per month Pro plan. Tableau’s equivalent package starts at $70 per month.
- Data handling: Tableau is known to perform better with significantly large data sets due to its flexibility, whereas Power BI is usually more suitable for less complex data systems or data that doesn’t need real-time analysis.
- Ease of use: Power BI is better suited for non-technical users as it offers a simpler interface and integration with other Microsoft products. Tableau, on the other hand, offers more advanced features catering to technical users who require deeper analysis.

Considerations:
When deciding between the two systems, Power BI and Tableau, consider the following:
- Your budget constraints and financial considerations
- The size and nature of your data needs, including unstructured and abnormal data
- The expertise of your team and collaborators
- The level of customization and complexity of the analysis required to execute your goals
Ultimately, the right tool for your organization will depend on your unique requirements. Remember that both provide free trials or limited versions, so it’s always a good idea to test the tools and evaluate their fit for your specific needs before making any long-term commitments.
In the end, comparing both Power BI vs Tableau are powerful tools that can help you unlock insights from your data and present them in visually appealing ways, so you can make data-driven decisions with confidence.
Final Summary:
The following is a final summary comparison of the two business intelligence tools:
| Category | Tableau | Power BI |
| Desktop Application Cost | $70 per month | $0 |
| Server/Web Service Cost | Est. $10k | $10 per user (monthly) |
| Enterprise Edition Starting Cost | Est. $10k one-time + $500 per user (annual) | $5000 per month + $20 per user |
| Data Connection Capabilities (10pt scale) | 8/10 – Some Limitations | 9/10 – Strong |
| Enterprise Platform | – On Premise – Cloud/Hybrid | – On-Premise (limited) – Cloud/Hybrid |
| Defining Components | – Widely adopted – Big Data Integration – Enterprise platform | – Microsoft product – Lower-cost profile – Dynamic platform |
| Gartner Quadrant | Leader | Leader |
| Bottom-Line | Well Known | Hard to Beat |
Still unsure? To learn more about Power BI, check out the playlist below:


