
Microsoft Power BI or Power BI as we know it, is one of the world’s most popular business intelligence tools that allow users to analyze data and share insights.
It is a collection of software services (SaaS), apps, and connectors that work together to turn your data into visually immersive and interactive insights.
With Power BI, you can connect to various data sources, including Excel spreadsheets, cloud-based and on-premises hybrid data warehouses, and more.

Power BI takes business intelligence to a new level and is designed to be used by business professionals with varying levels of data knowledge.
Its dashboard is straightforward, and intuitive and is capable of reporting and visualizing data in a wide range of different styles, including graphs, maps, charts, and more.
Whether you’re a small business owner or a large enterprise, Power BI can help you make data-driven decisions. It provides a comprehensive view of your data, making it easier for you to identify trends, patterns, and insights. With Power BI, you can collaborate with your team, share reports and interactive dashboards, and access your data from anywhere, at any time.
In this article, we will explore the top features and functionality of Power BI, and how it can benefit you and your business.
Let’s get to it.
Key Features and Benefits of Power BI
Power BI allows users to connect to and visualize data, and seamlessly infuse the visuals into the apps they use every day. It is the easiest way to pull insights from your data using natural language.
The best part? You don’t have to be a data scientist to use it; it is designed to be easy to use, even for people with basic levels of data knowledge. The reality is, if you have basic Excel skills, you will be able to learn and use Power BI to create impressive interactive visualizations.
In fact, starting with this free Power BI course will give you the basic skills to get you started on your data journey.

Now, let’s check out some of the key features and benefits of Power BI
Features
Power BI offers a wide range of features that allow users to create powerful visualizations and reports.
Key features include:
- Connectivity to a variety of data sources
- Data modeling and transformation
- Customizable visualizations and dashboards
- Collaboration and sharing capabilities
- AI-powered insights and recommendations
Benefits
Power BI offers a number of benefits to businesses that use it.
Key benefits include:
- Improved data visibility and insights
- Increased efficiency and productivity
- Better decision-making capabilities
- Improved real-time collaboration and communication
- Reduced costs and improved ROI
Overall, Power BI is a powerful tool that can help businesses gain insights into their data and make data-driven decisions.
With the addition of Artificial Intelligence, you will find your data preparation efforts will be supercharged in the BI platform.
Now you have an overview, let’s dive in a little deeper.
So, How Does Power BI Actually Work? – In 4 Steps
1. Data Sources
Power BI works by connecting to various data sources so you can, well, extract data from them. We’ve broken compatible data sources into 5 main groups, including:
1. File-bases sources:
Excel (XLSX, XLSM, XLS, CSV)
- Text (TXT)
- XML
- JSON
- Database sources:
- SQL Server
- Oracle
- MySQL
- PostgreSQL
- IBM Db2
- SAP HANA
- Teradata
- Amazon Redshift
- Snowflake
- Azure SQL Database
- Cloud-based sources:
- Microsoft Azure (Blob Storage, Table Storage, Data Lake, Cosmos DB)
- Amazon Web Services (S3, RDS)
- Google Cloud Platform (BigQuery)
- SharePoint Online (Lists, Excel files)
- Dynamics 365
- Salesforce
- Google Analytics
- Adobe Analytics
- Other sources:
- OData feeds
- REST APIs
- Web pages (by using the Web connector to scrape data)
- R and Python scripts
- Android Apps
- On-premises data sources (using Power BI Gateway):
- SQL Server Analysis Services (SSAS)
- SAP Business Warehouse
- SharePoint on-premises (Lists, Excel files)
- Exchange on-premises
Please note that support is added for new data sources all the time, and you also have the option to use custom or create your own connectors using Power Query M or the Power BI REST API.
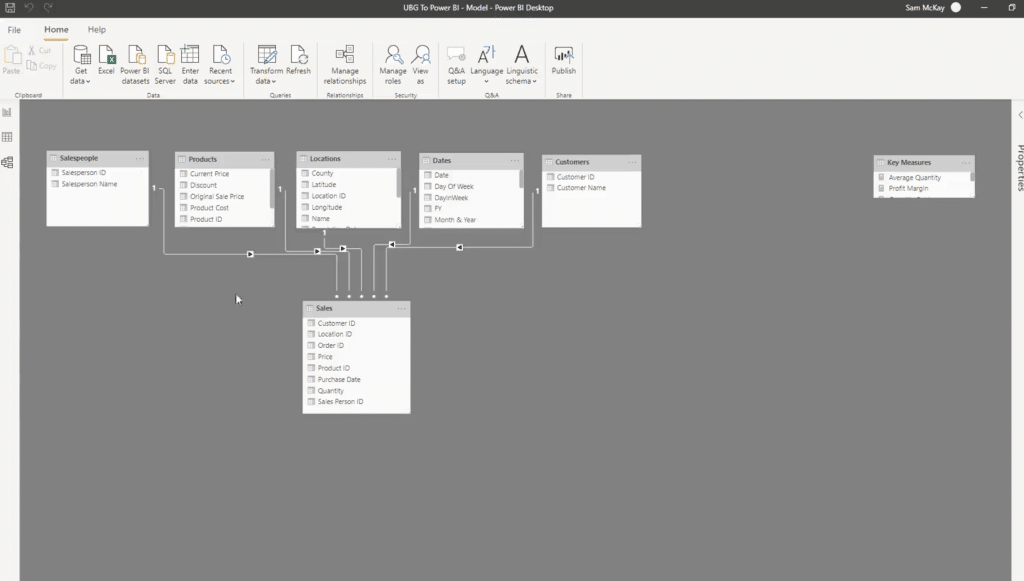
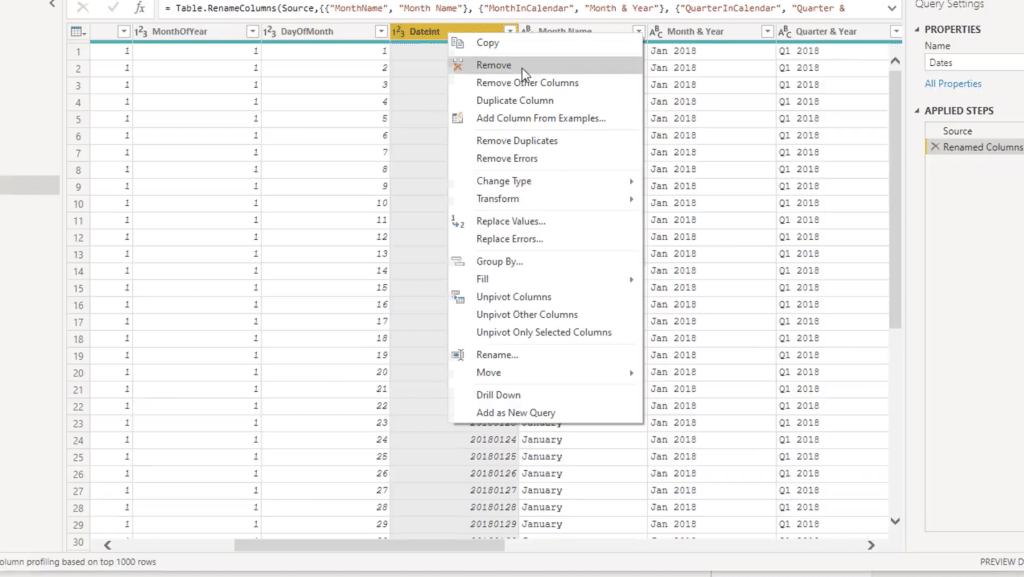
2. Data Modeling
Once the data is extracted, Power BI allows you to model the data and create relationships between different data sets. This is done using the Power Query Editor, which provides a user-friendly interface for transforming and shaping data.
You can also use DAX ( Data Analysis Expressions) formulas to create calculated columns and measures.
DAX is a very powerful language and lets you build complex calculations to go deeper in your data analysis.
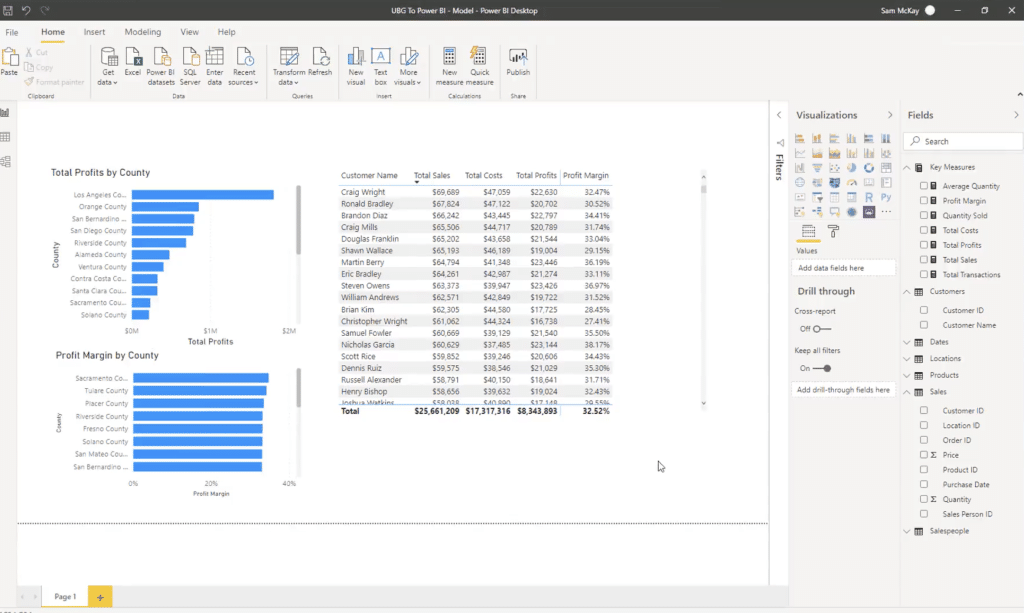
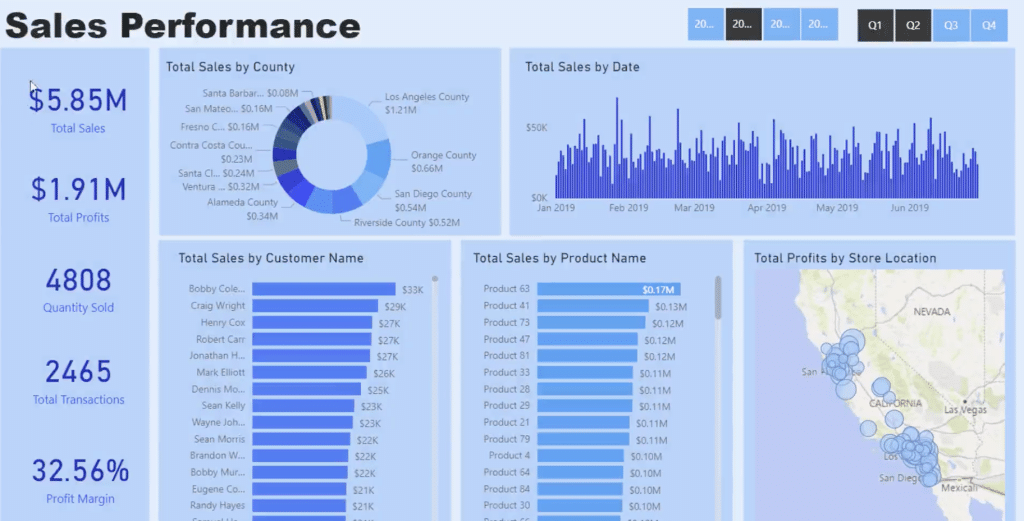
3. Data Visualization With Power BI Dashboards
After modeling the data, you can create visualizations using Power BI’s drag-and-drop interface.
Microsft Power BI provides a wide range of visualizations, including charts, graphs, maps, and tables, which can be customized to fit your specific needs.
You can also add filters and slicers to allow users to interact with the data in a specific way.
Let’s explore all of the data visualization tools available on Power BI dashboards:
- Charts
- Column chart (stacked, clustered, 100% stacked)
- Bar chart (stacked, clustered, 100% stacked)
- Line chart
- Area chart (stacked, line, 100% stacked)
- Pie chart
- Donut chart
- Treemap
- Waterfall chart
- Funnel chart
- Ribbon chart
- Radar chart
- Maps
- Map (with bubbles, heatmaps, or custom shapes)
- Filled map (choropleth)
- ArcGIS maps
- Shape maps
- Tables and matrices
- Table
- Matrix
- Paginated report table
- Cards and gauges
- Card
- Multi-row card
- KPI (Key Performance Indicator)
- Gauge
- Slicers and filters
- Slicer
- Date slicer
- Relative date slicer
- Filter pane
- Advanced visuals
- Scatter chart
- Bubble chart
- R script visual
- Python script visual
- Play axis (for animations)
- Decomposition tree
- Smart narratives
- Custom visuals
- Numerous custom visuals are available in the Power BI Visuals Marketplace, including Gantt chart, Sankey chart, Word cloud, Histogram, and more.
Now you have created your visuals, it is time to get sharing.
4. Data Sharing
Finally, Power BI allows you to transform your data analytics and share your visualizations with others in a variety of ways, whether on windows or ios.

Firstly, you can publish your reports to the Power BI service, which allows others to view your reports online and is the primary way Power BI users share their dashboards.
Furthermore, you can also export your reports to various formats, including PDF and Excel, or embed them in other applications using Power BI’s APIs.
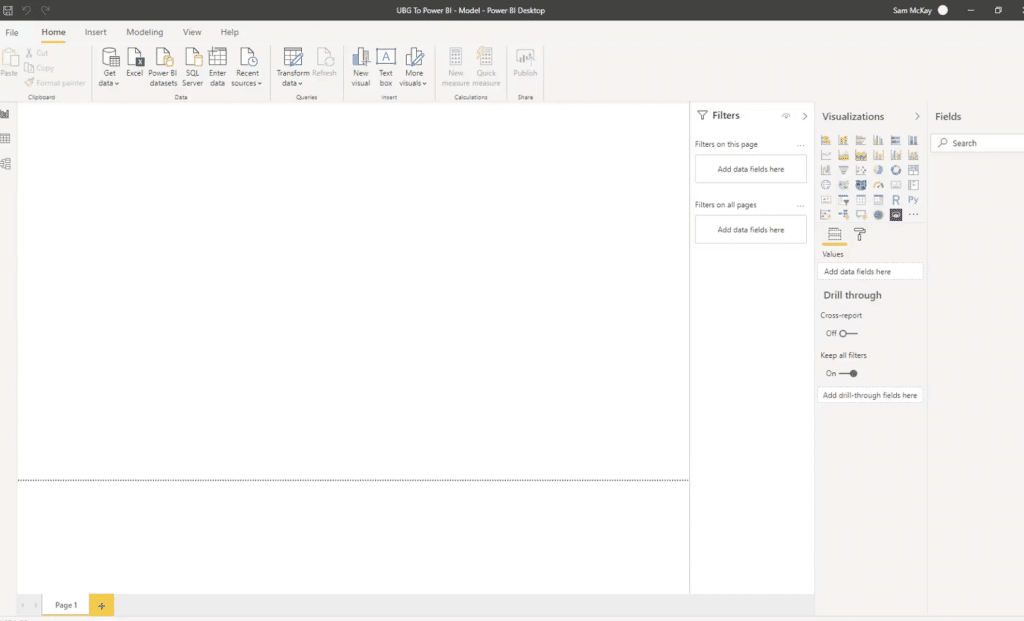
Getting Started, Time to Use Power BI Desktop
Installation and Setup of
To get started with Power BI, you need to install the Power BI Desktop application on your computer.
The installation process is straightforward and can be completed in a few steps. First, visit the Microsoft Store page and download the Power BI Desktop application. Follow the prompts to complete the installation process.
Once the installation is complete, open the Power BI Desktop application and sign in using your Microsoft account.
Next steps? Try our free course on Power BI to get a good grasp of the basic concepts, and you will be a Power BI pro in no time!
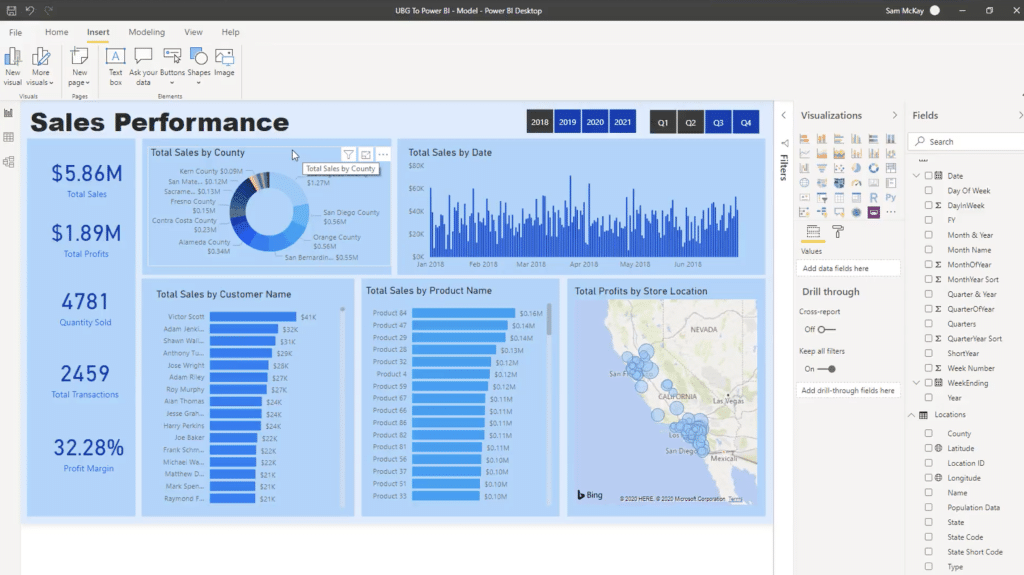
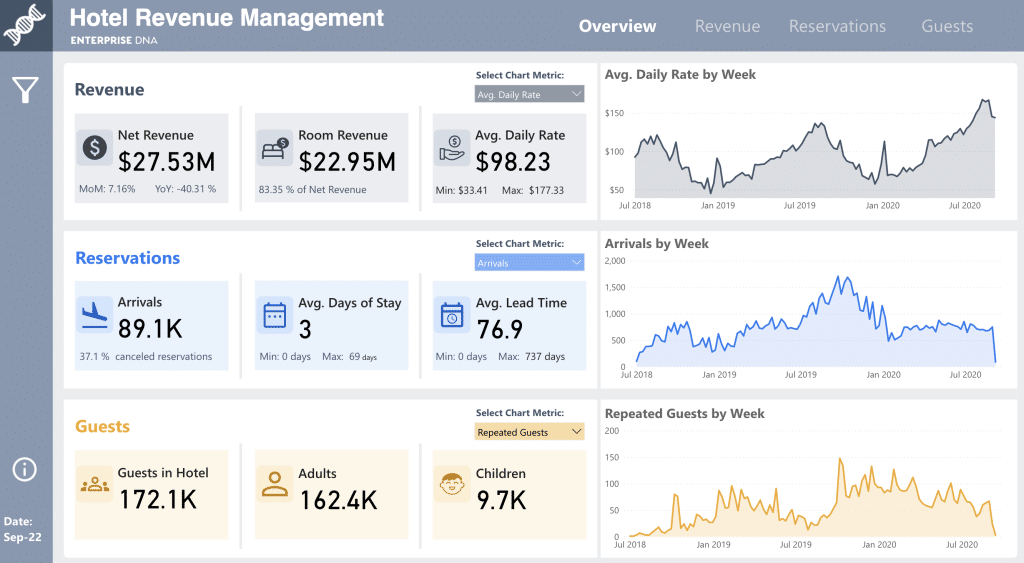
Creating Reports and Dashboards
Microsft Power BI has revolutionized business analytics by allowing you to create customized reports and dashboards that can be used to visualize, analyze and share metrics and data.
To create a report, you need to import data from various sources such as Excel spreadsheets, CSV files, and databases.
Once you have imported the data, you can use the drag-and-drop interface to create visualizations such as charts, tables, and maps.
Dashboards are collections of visualizations that can be used to monitor key performance indicators (KPIs) and track progress toward business goals.
To create a dashboard, you need to add visualizations to a canvas and arrange them in a way that makes sense to the user. It really is that simple.
Publishing and Sharing a Power BI Report
Once you have created a report or dashboard, you can publish it to the Power BI service and share it with others.
To publish a report, select the Publish button in the Power BI Desktop application and follow the prompts to upload the report to the Power BI service.
To share a report, you can either share a link to the report or embed it in a website or application.
Power BI also allows you to set up security and access controls to ensure that only authorized users can view the report
Now you understand the basics, let’s dive a little deeper with some terms I am sure you have heard or will hear, especially when dealing with business data.
Check out the below video we made showing you the amazing reporting applications of Power BI!
[youtube https://www.youtube.com/watch?v=ioPEDjf69Ao&w=784&h=441]
Advanced Features of Microsoft Power BI Dashboards
Data Analysis Expressions (DAX)
Data Analysis Expressions (DAX) is a formula language used in Power BI that allows users to create custom calculations and measures.
DAX includes a range of functions and operators that enable users to manipulate data and perform complex calculations.
DAX formulas can be used to analyze data from multiple tables and create dynamic visualizations.
Some of the key features of DAX include:

- Aggregation and filtering of data
- Calculation of rolling averages, year-to-date totals, and other complex calculations
- Integration with Excel formulas and functions
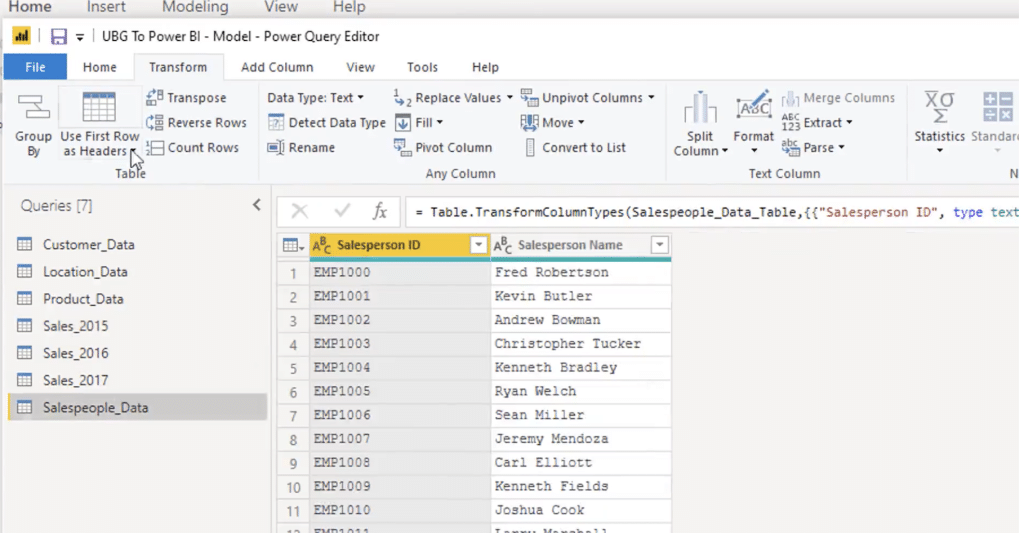
Power Query
Power Query is a data transformation and cleansing tool that allows users to extract data from multiple sources, transform it, and load it into Power BI for analysis.
Power Query includes a range of data transformation functions and connectors that enable users to clean and shape data for analysis.
Some of the key features of Power Query include:
- Integration with a wide range of data sources, including SQL Server, Oracle, and Excel
- Data cleansing and transformation using a range of functions and operators
- Automatic detection and correction of data errors
Power BI Mobile App
The Power BI mobile app allows users to access and analyze Power BI reports and big data dashboards on the go.
The app includes a range of features that enable users to view and interact with data on their mobile devices.
Some of the key features of the Power BI mobile app include:
- Offline access to reports and dashboards
- Integration with mobile device features such as GPS and camera
- Ability to share reports and dashboards with others
Power BI Embedded
Power BI Embedded is a cloud-based service that allows users to embed Power BI reports and dashboards into their own applications.
This enables users to integrate data analysis and visualization capabilities directly into their own software products and workspace.
Some of the key features of Power BI Embedded include:
- Integration with a wide range of programming languages and frameworks
- Customizable visualizations and branding options
- Scalable and flexible pricing options

What Are The Different Versions of Power BI?
There are 4 versions of Power BI, we will give you an overview below:
- Power BI Free – Free version for individual users, is a great place to start, but misses advanced collaboration options.
- Power BI Pro – This is a subscription-based service and offers a comprehensive list of features and functionality. You can access the full power of Power BI with this subscription. Prices ( at the time of writing) are $9.99 per user, per month (billed annually) or $20 per user, per month, billed monthly.
- Power BI Premium – Designed for companies with a need for dedicated data needs, dedicated cloud capacity, and high performance. Pricing starts at $20,000usd per month, billed annually.
- Power BI Embedded – This is a kind of pay-as-you-go pricing model with multiple tiers
Best bet? Start with the free version and see if it is what you need.
The Final Word, Should You Try Microsoft Power BI?
Absolutely! If you want to turn data into clean, clear, and actionable insights, Power BI is the number 1 place to start. So, get authoring your own dashboards and start learning for free about Power BI in our Beginners Course here.
Thinking of Tableau? On the fence between Power BI and Tableau? See what Gartner has to say about Power BI in the rating overview here.
Common FAQ’s
Is Power BI The Same as Excel?
No, they are different. Sure, they are related, but they are different tools, designed for different purposes. They both deal with data analysis but offer different levels of complexity. Excel is a spreadsheet application that has been around for years, and Power BI is a modern data visualization tool.
Simply put, Excel is best suited for small to medium-sized data sets and simpler tasks.
Is Power BI The Same as SQL?
Also a No. SQL or Structured Query Language is not the same, but they are similar in a way that they both deal with data analysis and management.
SQL is a language used to manipulate data with a focus on data management, not visualization.
What is Power Pivot?
Power pivot is an Excel add-on that enables you to easily analyze and manipulate large volumes of data. It basically increases Excel’s capabilities and functionality and allows you to pull in data from various sources.
What is Power View?
Power View is an excel feature that was integrated back in 2013; it is now basically redundant as all of its features were incorporated into Power BI.


