Microsoft Excel is one of the most widely used tools for storing, organizing, and analyzing data. Power BI is a powerful platform for creating interactive visualizations and dashboards based on data from a variety of sources. In this tutorial, you’ll learn how to integrate Power BI and Excel to create a dynamic Profit and Loss (P&L) statement.
Power BI Excel Integration: Overview
Open the Power BI Service. In the left-hand side, you can see a tab for Excel and PowerPoint.
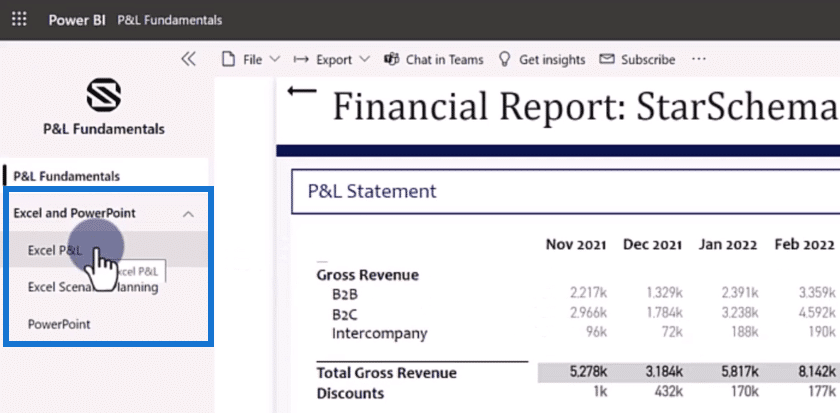
This option allows you to embed your Power BI report in both Excel and PowerPoint, enabling you to share your data and insights with your colleagues more easily. It also gives more flexibility in how the data is presented.
In this example, when you click the Excel P&L option, you’ll see an Excel sheet embedded within Power BI.
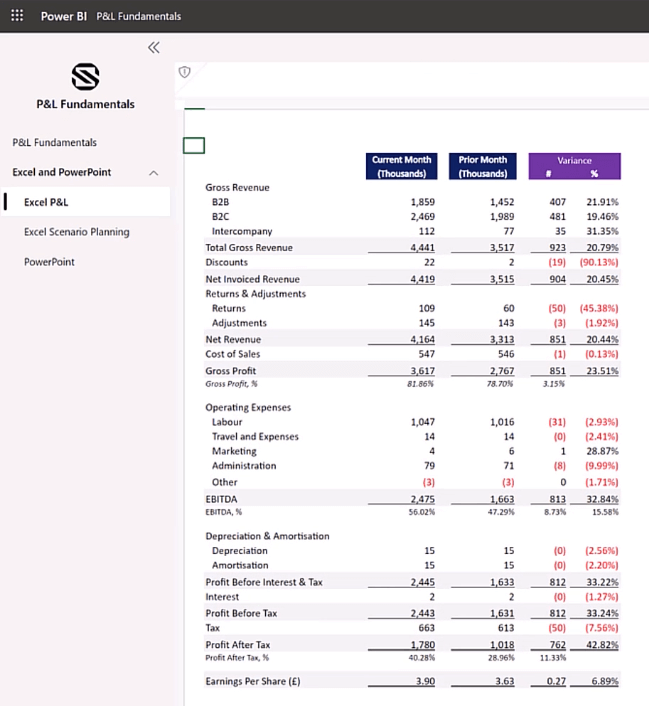
Each cell in this table contains individual formulas that refer to the Power BI API. They work just like any other formula in Excel. And since these two programs are both owned by Microsoft, their interaction is reliable and stable.
This feature is also perfect for scenario planning.
If you use DAX codes, you’ll need to create duplicate dimensions and build complicated DAX code arguments. However, with the use of Excel integration, you can simply enable filters and select a financial period to gain insights from the report.
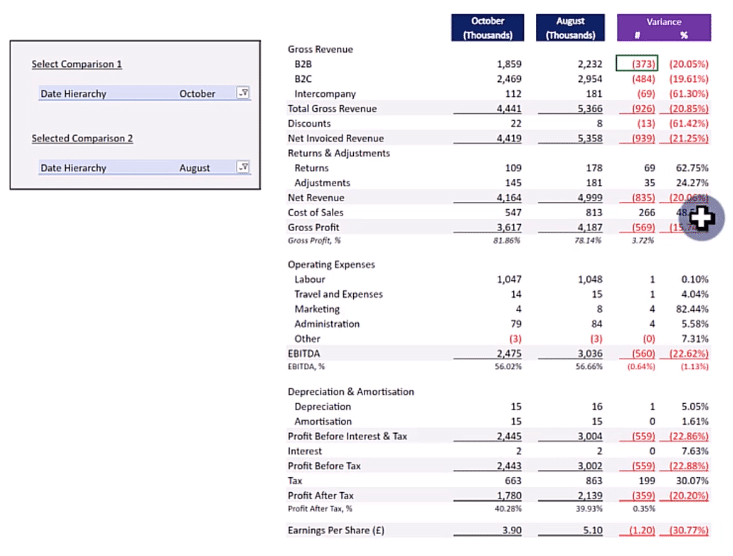
For example, if you filter the report to only show October and August, you can then compare the figures and variance between these two months.
Power BI Excel Integration Steps
To perform an Excel integration within Power BI, open your report in the Power BI Service and select Export > Analyze in Excel.
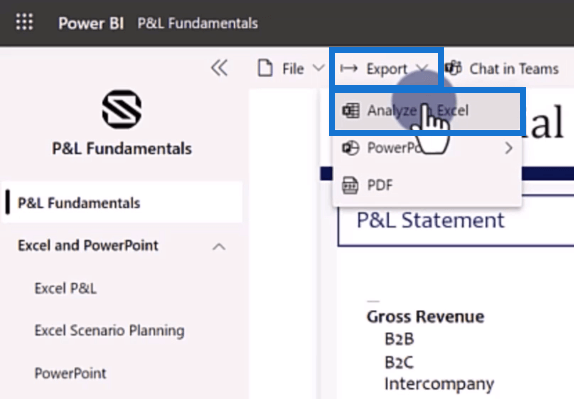
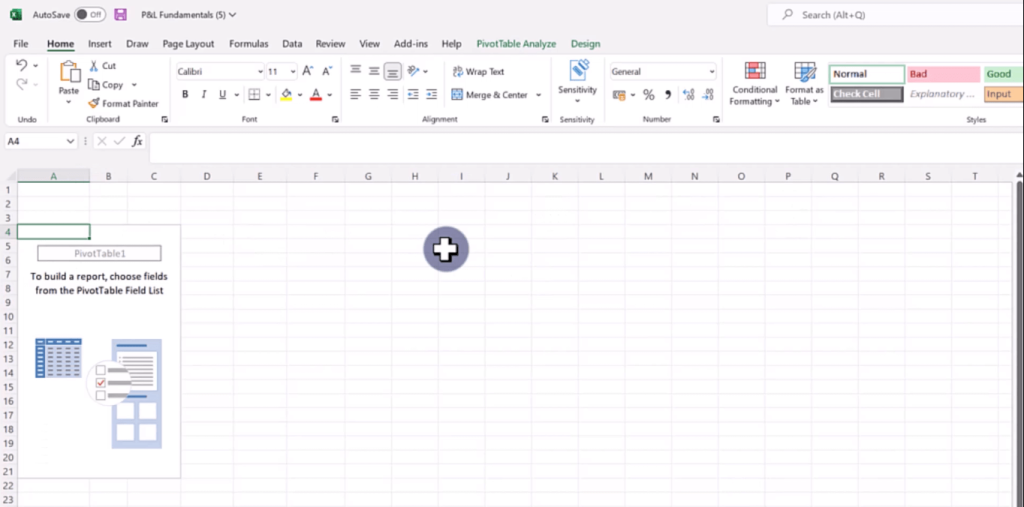
Once done, an Excel program will open containing a pivot table that’s connected to your report.
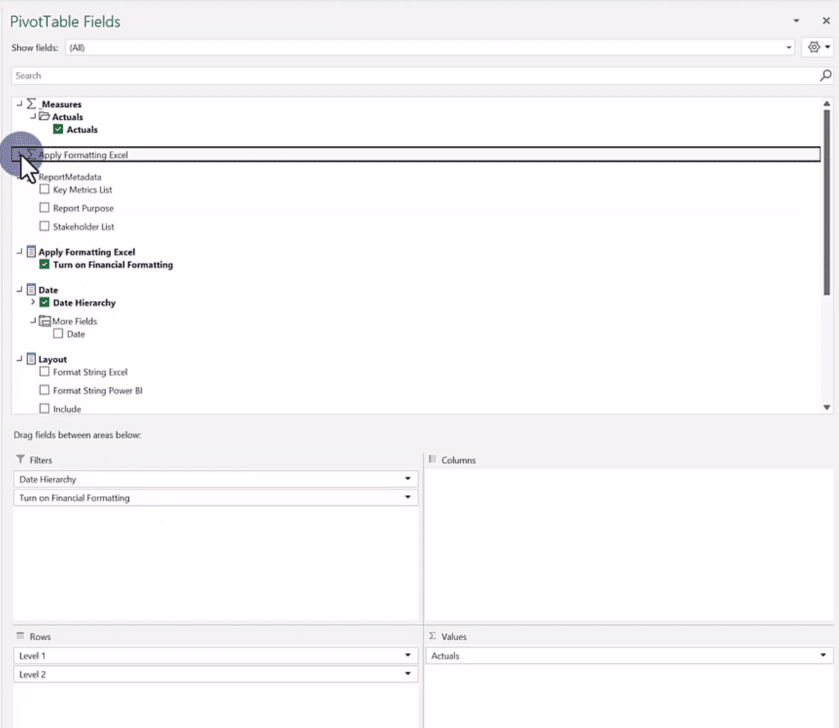
To build your P&L statement, you need to drag and drop the fields to their corresponding areas.
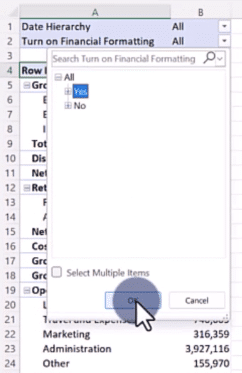
Then, in the pivot table, turn on the Financial Formatting option.
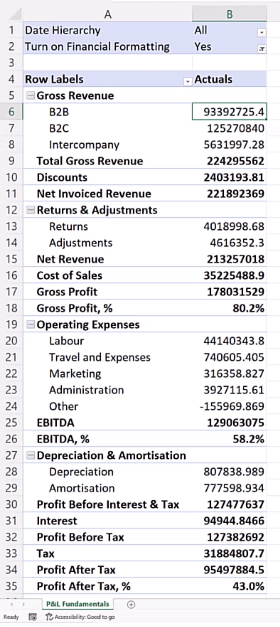
Once done, notice that the percentage values in Power BI are also reflected in the Excel file.
Within this worksheet, you can also view the detail row expressions by double-clicking on a cell. This opens another worksheet containing information on the cell’s first 1000 rows.
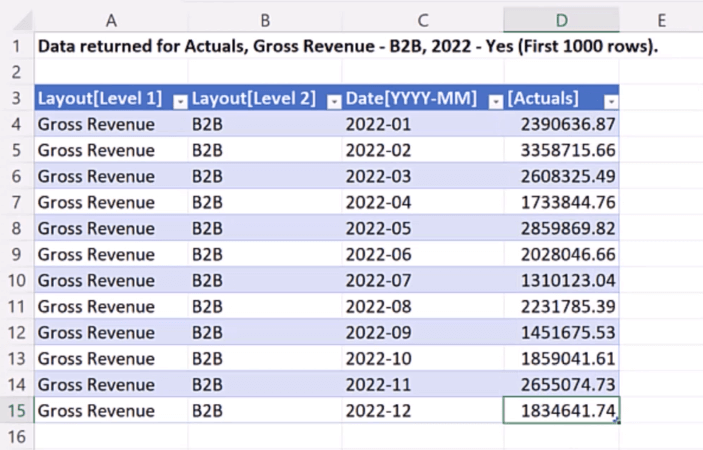
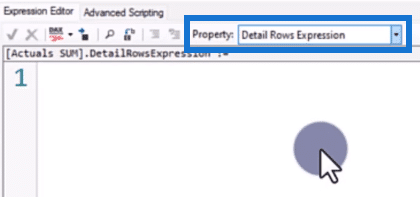
This is made possible by creating a DAX statement in the Tabular Editor for the detail row expression.
OLAP Tools In Excel
By using Excel integration in your reports, you’re able to use the OLAP Tools option in the PivotTable Analyze tab.
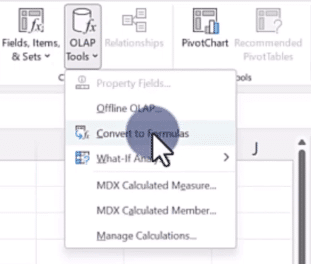
OLAP Tools allows you to convert your pivot table into formula form.
When you select this option, notice that the table has been transformed into a regular Excel table. Each cell now contains a formula instead of a detailed row expression. This allows you to format each cell however you like.
You can change the number format, add commas, or change the background and text colors.
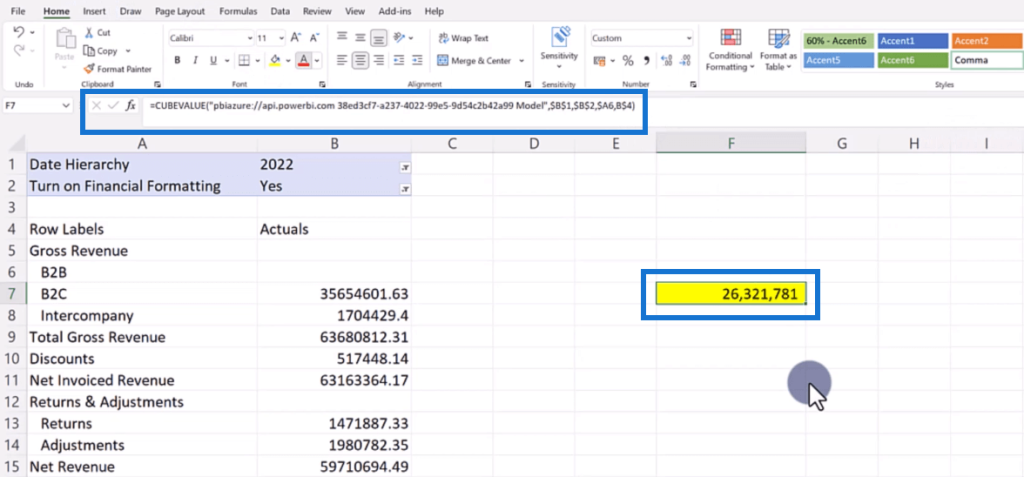
In the formula bar, you’ll see that the file is connected to the Power BI API.
The Power BI API is a set of programming interfaces that allow developers to access and manipulate data and functionality in Power BI.
It allows you to programmatically retrieve data from your Power BI dashboards, reports, and datasets, and perform operations such as creating, updating, and deleting dashboards, reports, and datasets.

In this case, when the data in the Power BI updates, the integrated Excel file will get updated as well.
***** Related Links *****
How To Create Profit And Loss (P&L) Statements In Power BI
Power BI Financial Reporting: Allocating Results To Templates At Every Single Row
Appending Several Sheets In Excel To Power BI
Conclusion
Integrating Excel and Power BI can be a powerful way to create and analyze P&L statements. By using the integration technique discussed in this tutorial, you can leverage the strengths of both platforms to easily create and make changes to your financial report that can be easily updated as your data changes.
Whether you’re a business analyst, data scientist, or simply someone who works with financial data on a regular basis, the integration between Excel and Power BI can be a valuable asset for analyzing and visualizing the financial data in your organization.
All the best,
Chris Barber


