
This tutorial will discuss about how to import and open an Excel file with multiple sheets to one Power BI table.
This data Excel file will be used for this tutorial.
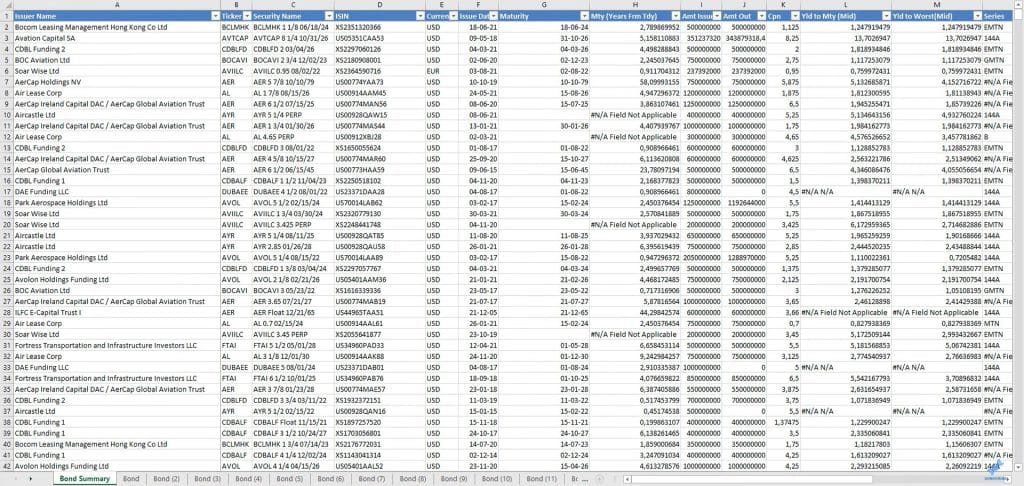
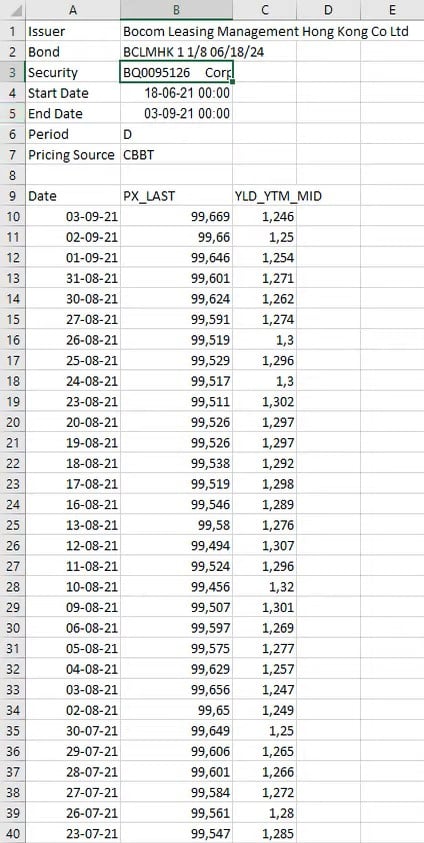
The file contains 60 sheets of data with the same layout.

The objective of this tutorial is to load all the Excel sheets to Power BI and retrieve the Bond information as one table. You need to get the Security ticker and add that in a separate column. Then, append all of them together in a single table that’s leveraging the UI to generate the code that you need.
Importing The Excel Sheets To Power BI
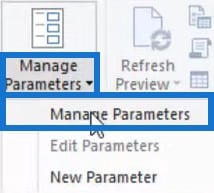
The first thing to do is open the Power Query Editor and create a parameter to store the file location using the Manage Parameters option.
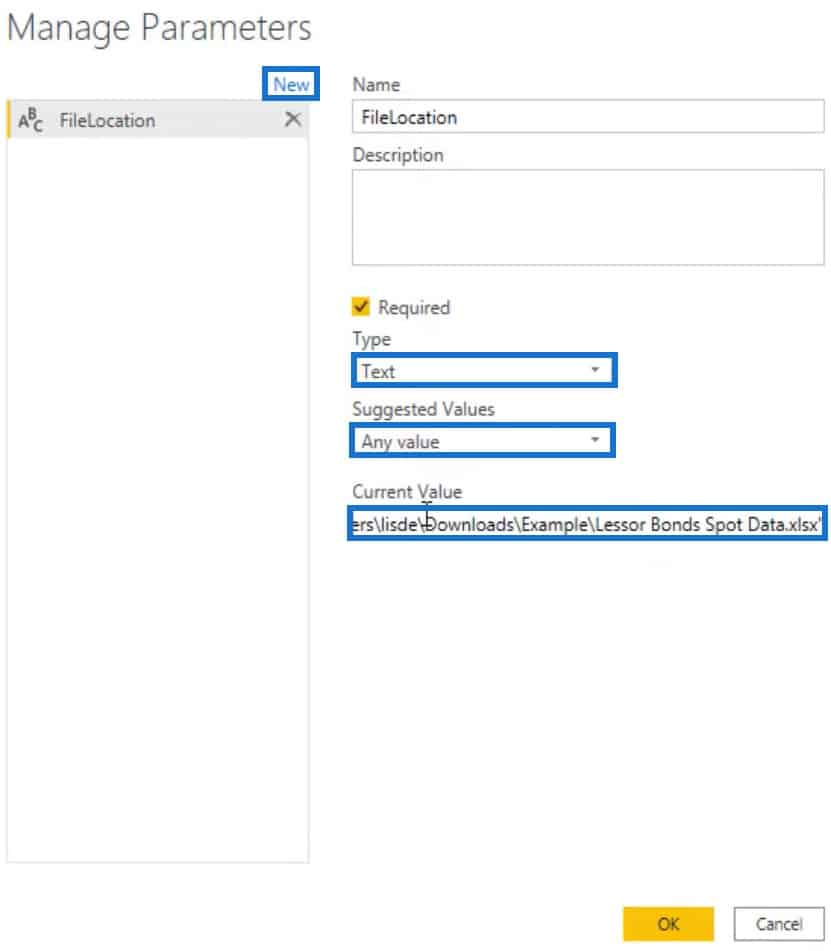
Inside the Manage Parameters box, click New and input FileLocation as the parameter name. Next, set the Data Type to Text and Suggested Values to Any Value. Copy the file path of the Excel file and paste it in the Current Value fields.
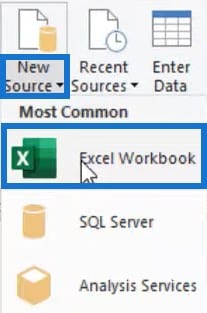
After pressing OK, click New Source and select Excel Workbook.
Next, select and open the Excel File. Once done, the Navigator screen will open and list all the sheets within the Excel file.
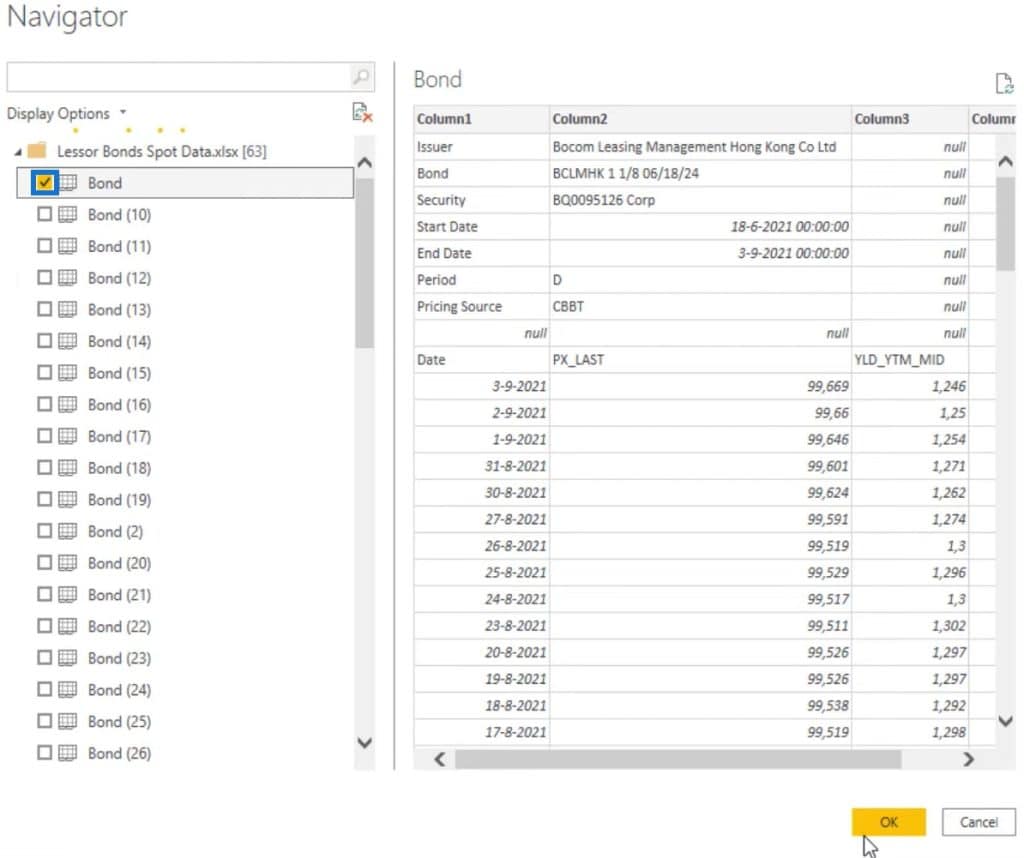
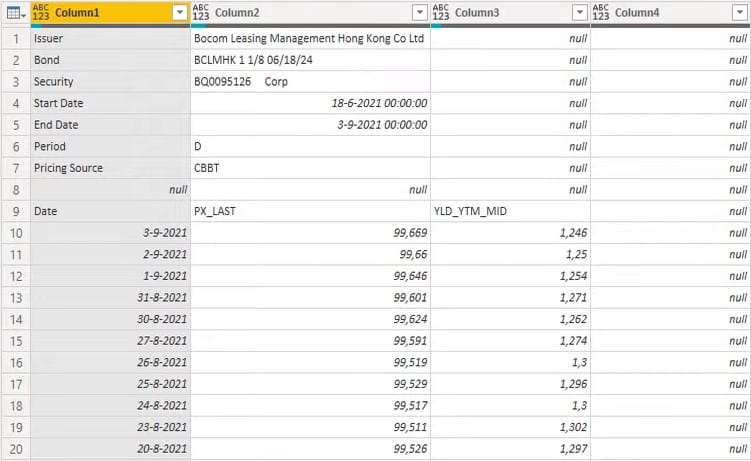
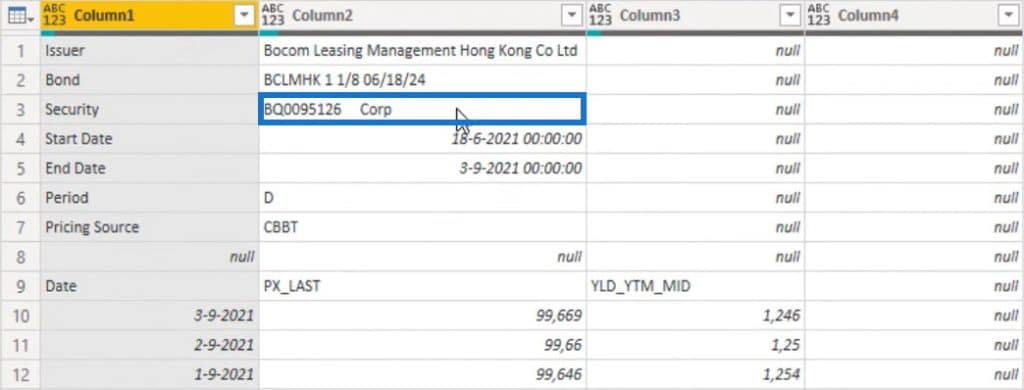
Select the first sheet and press OK. After that, you’ll then see the table inside Power Query Editor.

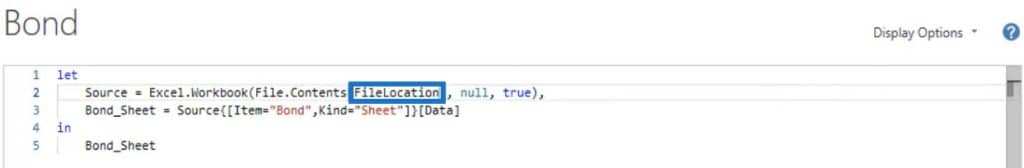
The next thing to do is change the hard-coded file path into the file parameter. Open the Advanced Editor window and change the file path in the Source code to FileLocation.
It’s best to have your data in Excel tables because the boundaries or the data range are defined before you bring them into Power Query. Since the file contains sheets and no tables, it runs the risk of bringing in empty columns and empty rows so you need to sort that out.
Bringing Out The Security Ticker From Excel To Power BI
Knowing that the layout of the sheets is fixed helps in building a solution, especially if you want to maximize and use the user interface to generate the code. For example, one requirement is to add a column that contains the Security ticker. If you look at the data, you can see the ticker.
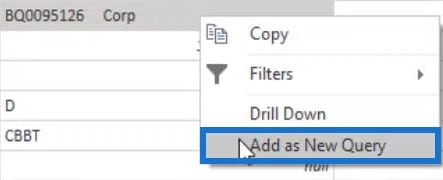
The user interface can help you extract the value of the ticker. Right-click on the cell and select Add As New Query.
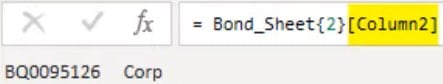
In the formula bar, you’ll see that the table name is followed by a zero-based row number between curly brackets. The curly brackets are called positional index operators. You’ll also see the field name enclosed by square brackets which are called field access operators.
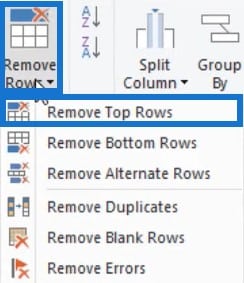
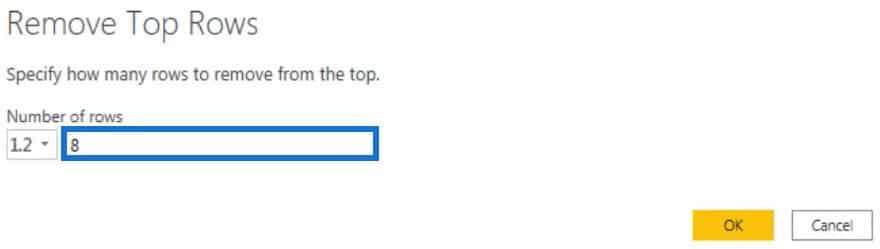
With those codes, you can now extract the value. Go back to the Bond table and get the Bond data. First, remove the top 8 eight rows. Click Remove Rows and select Remove Top Rows.
Next, input 8 in the Number Of Rows field and press OK.
Then, click Use First Row As Headers to set the headers.

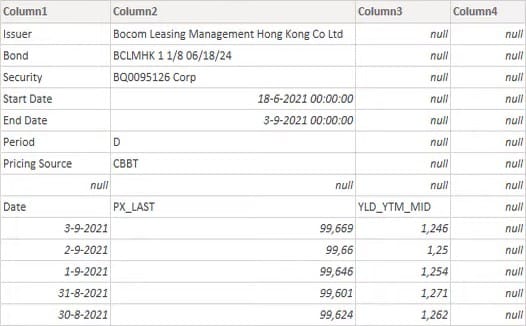
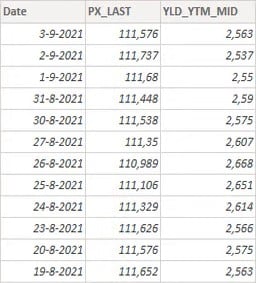
Once done, the Bond table will now look like this.
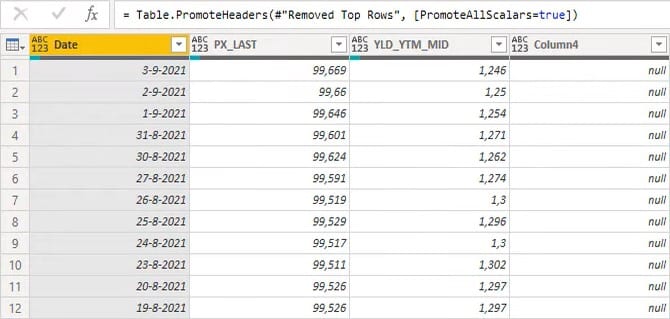
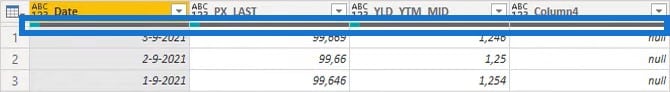
Directly below the header, you’ll see a thin line that represents the column quality. From there, you can see that there are quite a number of blanks in the columns. This means that the file brought in a lot of empty rows.
Removing Empty Rows
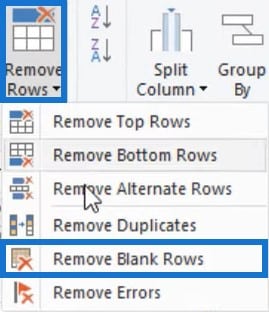
To remove the empty rows, click Remove Rows and select Remove Blank Rows.
That transformation generates this syntax:

Record.FieldValues is getting all the values from the current row in the table as a list. List.RemoveMatchingItems removes all of the values in the first list that has a match in the second list. The second list only contains an empty text string or a null. These are the values that will be excluded from the first list.
If all the empty text strings and null have been removed from the list with the record field values, the list should be empty and the List.IsEmpty will evaluate to True. Then, Table.SelectRows will retain the Trues.
You should not end up with a table with only blank rows. That’s why the keyword not is added before the List.IsEmpty. That then returns a table containing non-blank rows.

Aside from blank rows, you also need to remove blank columns. But before that, take a look at what Power Query generates when you remove a column. Select the fourth column and click Remove columns.
After performing the transformation, you’ll see this syntax in the formula bar.

It calls the Table.RemoveColumns function then references and passes the previous step in the Applied Steps pane as first argument. The transformation further passes a list containing the column name of the columns that you want to remove.
Duplicating A Query
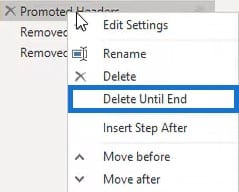
Now, duplicate the query and select the Promote Headers step in the Applied Steps pane. Next, right-click on that step and select Delete Until End.
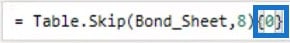
Remember that you can use the positional index operator to pass a zero-based row number in a set of curly brackets. So keep only the first row by inputting 0 inside two curly brackets in the formula bar.
Once done, the Bond table will look like this.
From there, reuse a part of the logic that was created by the Removed Blank Rows step to turn the record into a list and to remove the null. Go back to the Bond query and select the Remove Blank Rows step. Next, copy this M code.

Go back to the duplicated query and paste the code in the formula bar. Then, arrange some strings to make the formula look like this.

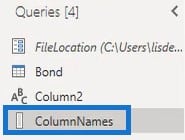
You have now created a list with column names that you want to keep. Rename the query Column Names.
Then, go back to the Bond query. Since you’ve created a query that contains all of the columns you want to keep, you need to list all columns that you want to exclude in the Table.RemoveColumns function.

Change {Column4} with the same syntax that was copied from the Removed Blank Rows steps. Change also {“”, null} to ColumnNames.

Then, you need to pass a list with the actual column names from the Bond table. Change the Record.FieldValues(_) to Table.ColumnNames(). Input #”Removed Blank Rows” inside the parentheses to pass a table reference argument.

Assigning Data Types To Columns
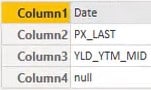
The next thing to do is assign appropriate data types to the columns. For the Date column, click the icon beside the header and select Date.

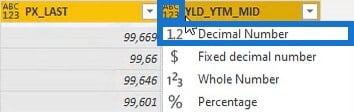
For the PX_LAST and YLD_YTM_MID columns, select the Decimal Number data type.
With these three queries, you’ve created all of the building blocks that you can use to design a solution that addresses all of the sheets in the Excel file. For that, you need to duplicate the Bond query and delete all the steps except the Source step in the Applied Steps pane.
Adding Security Ticker Column From Excel To Power BI
In the Source step, you can see all of the data inside the Excel file. Instead of creating a separate query for each sheet, you can use the Bond query and transform the nested tables in the Data column.
First, add the Security ticker. If you click the white space inside the cell of any table, you’ll see a preview of the contents of that table.
You need to create a logic using an IF statement to get the Security ticker. Go to the Column2 query and copy the address of the Security ticker from the formula bar.
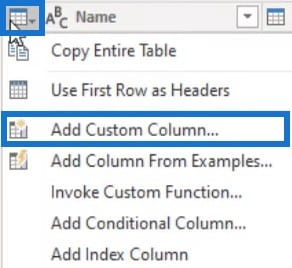
Next, go back to the Bond query and add a custom column.
Name the column Security Ticker and write the following M code.

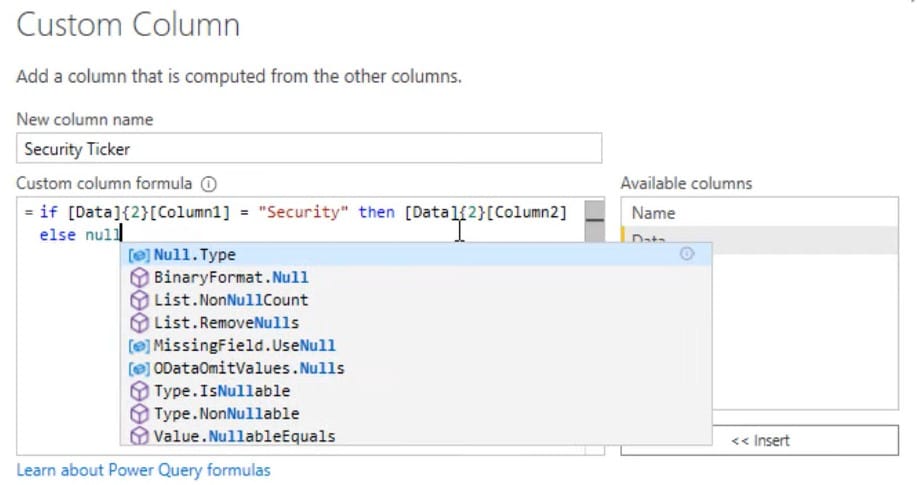
The formula has an IF statement saying that if the word Security is found in Column1, it will provide the value of the cell from Column2 which is adjacent to it. Otherwise, a null will be provided.
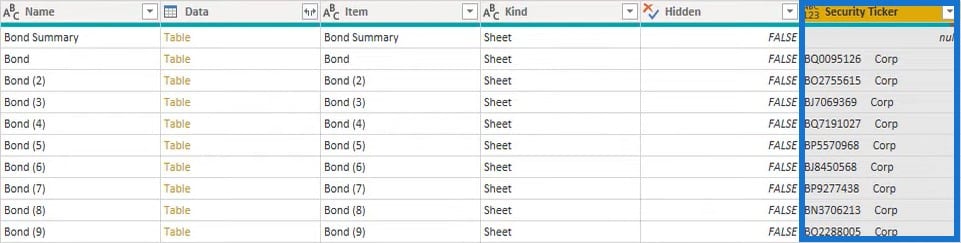
After pressing OK, a new column with the Security tickers will be added to the table.
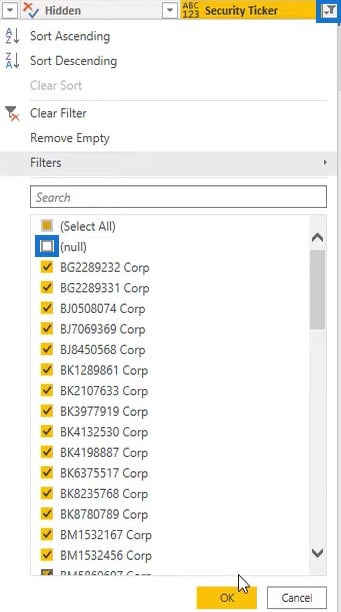
Click the drop-down button of the Security Ticker column and deselect null to remove all nulls in the column.
After that, you will be left with all of the Bonds’ information from all of the sheets. All you need to do is repeat the performed transformations done in the Bond(2) query and apply them to the nested tables in the Data column.
Creating A Custom Column For Bond Query
Go to the Bond(2) query, open the Advanced Editor window, and copy the following code:
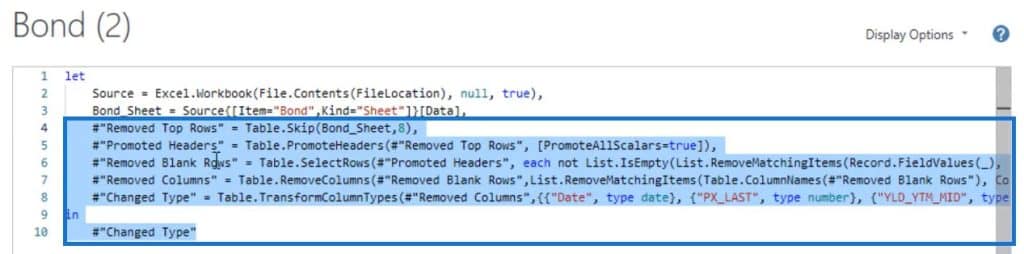
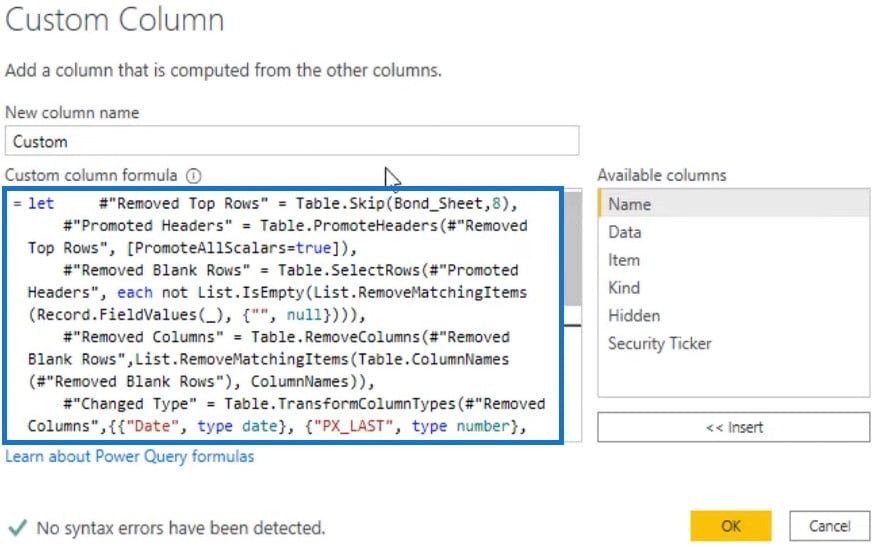
Next, go back to the Bond query and create another custom column. Since you need to apply multiple transformations across multiple steps, you have to use a let statement. So, input let and paste the code from the Advanced Editor.
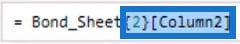
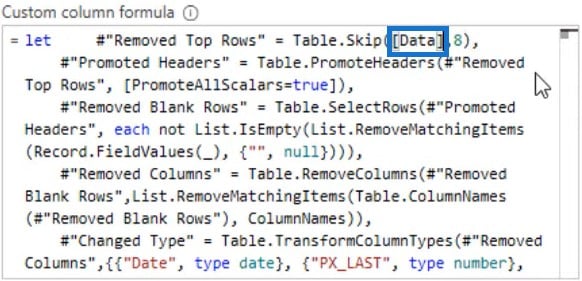
Then, change the Bond_Sheet to Data to transform the table in the Data column.
After pressing OK, a new column will be added in the table.
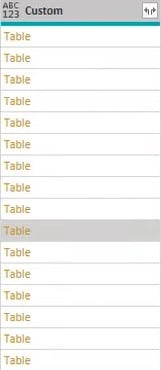
If you click the white space inside any cell of that column, you’ll see the data from the Bond(2) query.
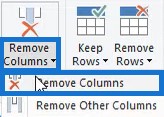
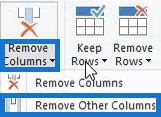
All you need is in the last two columns of the Bond query. So, select both the Security Ticker and Custom columns and click Remove Other Columns from the Remove Columns ribbon.
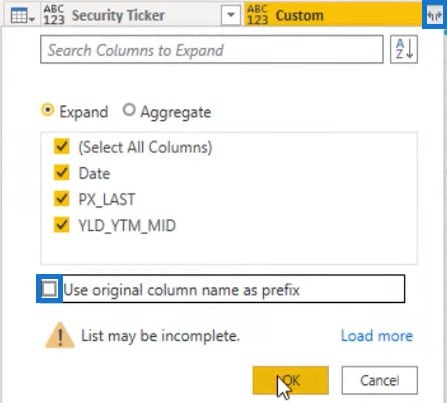
Expand the Custom column and uncheck the Use The Original Name As Prefix box.
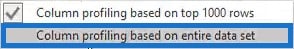
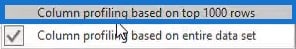
Once done, validate the table. Below the table, select the Column Profiling Based On Entire Data Set option.
After that transformation, an error will occur in the Data column.
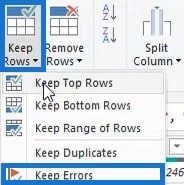
So examine the error by clicking the Data column and selecting Keep Errors in the Keep Rows ribbon.

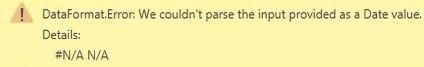
If you click the Error value inside the Data column, you can read the error message below:
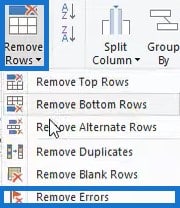
To solve the issues, first remove the Kept Errors step. Click the Data column and select Remove Errors from the Remove Rows ribbon.
Then, set the column profiling option back to the top 1000 rows. And that’s it!
Conclusion
This user interface-driven solution can help you append multiple sheets from an Excel file to Power BI. Instead of creating 60 separate queries and performing all transformations repeatedly, this solution can create a single query that performs all of the transformations. Utilize and maximize this solution to build a great data report.
Melissa
***** Related Links *****
Power Query Tutorial: How To Split Multi-Lined Excel Cells In Power BI
Power BI And Excel: Difference In DAX Formulas
Using Power Query Advanced Editor To Extract Values Before A Specific Text
***** Related Course Modules *****
Power Query Series
Ultimate Beginners Guide To Power BI
DAX Formula Patterns
***** Related Support Forum Posts *****
Ability To Cut Data Power BI Vs Excel
Power BI With Excel Merge Cells
Power BI Desktop Crashing On Load From Excel
For more excel to Power BI queries to review see here….


