
Ready to calculate a z-score in Excel? Awesome. Because we are going to show how to do it quickly and easily so you can show off to your mates!
In Excel, calculating z-scores is a simple process that involves using the STANDARDIZE function or manually applying the z-score formula.
Understanding z-scores is crucial for identifying the significance of data points and the probability of their occurrence.

This article will cover the basics of z-scores and how to calculate them in Microsoft Excel.
Let’s get into it!
What is a Z-Score?

A Z-score is a standard measurement used in statistics to understand data distribution. It measures the number of standard deviations a particular data point is from the mean.
The formula for calculating a z-score is:
\[Z = \frac{(X – \mu)}{\sigma}\]Where:
- Z is the Z-score
- X is the data point
- ? (mu) is the mean
- ? (sigma) is the standard deviation
Using Z-scores, you can compare and analyze data from different datasets using the same standardized scale, making it easier to identify outliers and unusual patterns.

Now that we know what a z-score is, let’s explore how to create a z-score table in Excel for practical applications.
How to Create a Z-Score Table in Excel in 3 Simple Steps

A Z-Score table is a valuable tool for calculating and interpreting z-scores. Let’s take a look at how to create a z-score table in Excel.
To create a z-score table in Excel, you can use the standard NORM.S.DIST function. This function returns the standard normal cumulative distribution function for a given z-score. The syntax of the function is:
=NORM.S.DIST(z,TRUE)Where z is the z-score, and TRUE indicates that you want to get the cumulative distribution function.
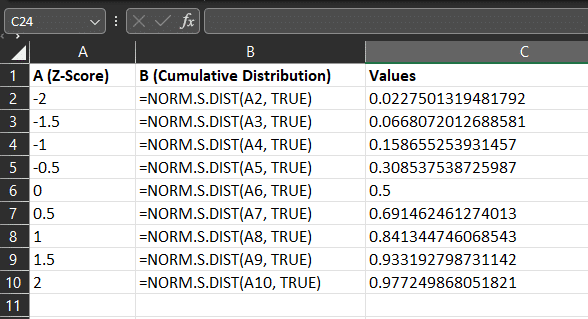
To create a z-score table in Excel, follow these steps:
- Open a new worksheet and enter the z-scores you want to calculate in column A.
- In column B, enter the formula =NORM.S.DIST(A1,TRUE) and copy it to the remaining cells in column B.
- Format the z-score table as desired by selecting the cells and adjusting the font, borders, and number format.
Now your Excel worksheet will have a z-score table that you can use to calculate and interpret z-scores. Aslo, you can easily update the table by entering new z-scores in column A and copying the formula in column B.
Having learned how to create a z-score table, let’s move on to the different methods of calculating z-scores directly in Excel.
How to Calculate Z-Scores in Excel – 2 Simple Ways

There are two ways to calculate Z-scores in Excel.
- Using the STANDARDIZE function
- Manually compute the Z-score formula
Using the STANDARDIZE Function
The STANDARDIZE function in Excel is used to calculate Z-scores easily and efficiently.
One efficient way to calculate z-scores in Excel is by using the STANDARDIZE function. Let’s see how it works.
How to Use The Standardize Function
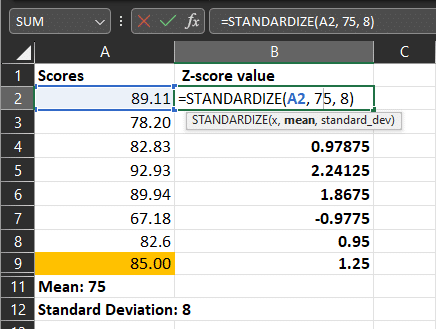
To use the STANDARDIZE function, follow these simple steps.
- Open your Excel file and select the cell where you want the Z-score to appear.
- Type =STANDARDIZE(
- Select the cell containing the score you want to calculate the Z-score for.
- Type a comma (,) and then select the cell containing the data set’s mean.
- Type a comma (,) and then select the cell containing the data set’s standard deviation.
- Press Enter to get the Z-score value.
For example, if you have a data point of 85 with a mean of 75 and a standard deviation of 8, you would input =STANDARDIZE(85, 75, 8).
Besides the STANDARDIZE function, you can also manually calculate z-scores in Excel. Let’s examine this method.
Manual Calculation in Excel with Arithmetic Operators

Another way to calculate Z-scores in Excel is to use a formula that directly applies the Z-score calculation using the Excel arithmetic operators.
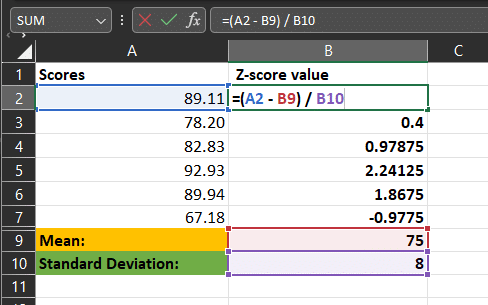
- In an empty cell, type =
- Click on the cell containing the score you want to calculate the Z-score for (e.g., cell A2).
- Type **** (minus sign) and click on the cell containing the mean (e.g., cell B9).
- Type / (forward slash) and click on the cell containing the standard deviation (e.g., cell B10).
- Press Enter to get the Z-score value.
This method can be a bit more cumbersome than using the STANDARDIZE function, but it can be useful if you want to create a custom function or if you need to perform additional calculations on the Z-score.

By using the STANDARDIZE function and the formula method, you can easily calculate Z-scores in Excel and leverage the power of statistical analysis in your data.
After calculating z-scores, the next crucial step is interpretation. Let’s explore how to interpret z-scores in Excel.
How to Interpret Z-Scores in Excel

When working with Z-scores in Excel, it’s crucial to understand how to interpret them accurately.
A Z-score tells you the number of standard deviations a particular data point is from the mean, and it helps you compare data from different datasets.
Z-Score Tables
One of the common ways to interpret Z-scores is by using Z-score tables, also known as the standard normal distribution table.
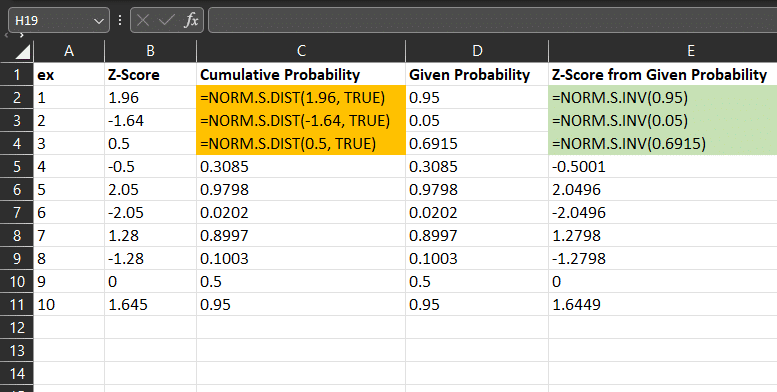
These tables provide the probability that a random variable will be less than or greater than a specific Z-score. In Excel, you can use the NORM.S.DIST and NORM.S.INV functions to work with Z-score tables.
- NORM.S.DIST: This function returns a given Z-score’s standard normal cumulative distribution function. The syntax is NORM.S.DIST(z, cumulative), where z is the Z-score and cumulative is a logical value indicating the distribution type (TRUE for cumulative and FALSE for probability density function).
- NORM.S.INV: This function returns the standard normal inverse cumulative distribution function for a given probability. The syntax is NORM.S.INV(probability), where probability is the probability of a standard normal random variable falling between two values.
How to Apply Z-Scores to Data

When working with Excel, you can apply Z-scores to your data to identify outliers, assess data distribution, and compare multiple datasets.
So we’ve already covered how to calculate a Z-score for a single value by using the STANDARDIZE function or manually entering the formula.
Another common approach is to calculate Z-scores for an entire dataset. This involves applying the Z-score formula to each data point in the dataset using Excel functions.
Below is the formula for calculating Z-scores for a range of data points:
\[= (B2 – AVERAGE($B$2:$B$6)) / STDEV.P($B$2:$B$6)\]=- B2: The cell containing the data point
- AVERAGE($B$2:$B$6): The mean of the data set
- STDEV.P($B$2:$B$6): The standard deviation of the data set
By understanding how to interpret Z-scores and apply them to your data in Excel, you can make more informed decisions and gain valuable insights from your data analysis.
Interpreting z-scores is just the beginning. Next, we’ll explore how to use these scores in hypothesis testing scenarios.
How to Use z-Scores in Hypothesis Testing

When working with z-scores in Excel, you may want to use them for hypothesis testing.
One-Sample z-Test
The one-sample z-test is used to determine if a sample mean is significantly different from a known population mean.
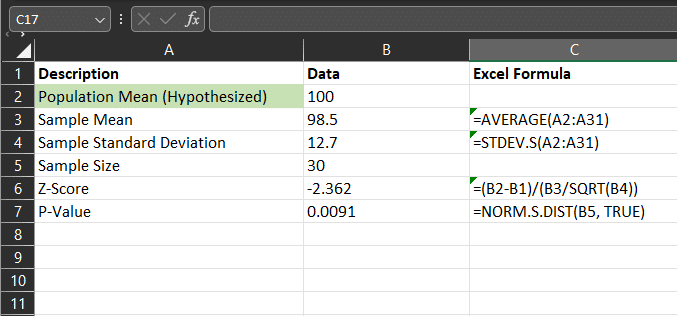
To perform this test in Excel, follow these steps:
- Import or input your data set into an Excel worksheet.
- Calculate the sample mean and standard deviation using Excel functions, such as AVERAGE and STDEV.S.
- Apply the z-score formula to your data.
- Use the NORM.S.DIST function to find the p-value associated with the z-score.
The formula for the NORM.S.DIST function is:
\[=NORM.S.DIST(z,TRUE)\]Where z is the calculated z-score and TRUE specifies that the function should return the cumulative distribution function.
The p-value will give you the probability of observing a sample mean as extreme or more extreme than what you have obtained under the null hypothesis.
Now, let’s take a look at two-sample z-tests.
Two-Sample z-Test
The two-sample z-test is used to compare the means of two independent samples.

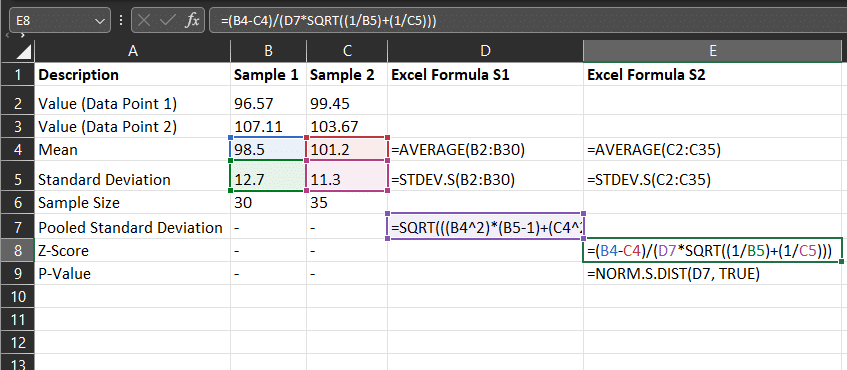
To perform this test in Excel, follow these steps:
- Import or input your data sets into an Excel worksheet.
- Calculate each sample’s means and standard deviations using Excel functions, such as AVERAGE and STDEV.S.
- Apply the z-score formula to your data.
- Use the NORM.S.DIST function to find the p-value associated with the z-score.
The formula for the NORM.S.DIST function is the same as in the one-sample z-test.
By using these Excel functions and formulae, you can easily conduct hypothesis testing using z-scores.
Beyond hypothesis testing, z-scores can also enhance visual data representation. Let’s learn how to incorporate them into Excel charts
Can Z-Scores be Used in Excel Charts? Let’s Find Out

Z-scores can be used in Excel charts to represent data points in a standardized manner. In this section, we will cover how to use z-scores in different Excel charts, such as:
- Scatter Plot
- Line Chart
- Bar Chart
- Boxplot
How to Create a Z-score Scatter Plot
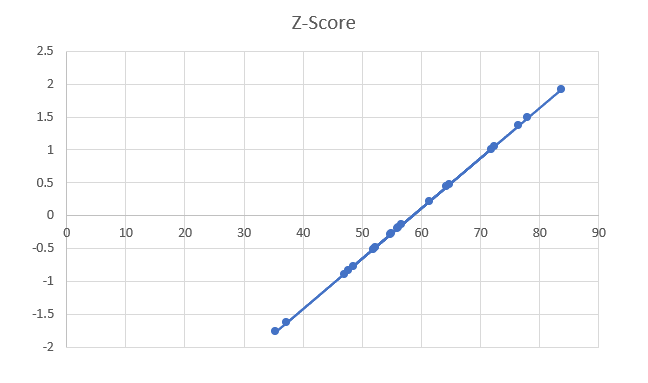
To create a scatter plot with z-scores, follow these steps:
- Select the data range for your x-values and the corresponding z-scores for your y-values.
- Click on the Insert tab and then click on Scatter in the Charts group.
- Choose a scatter plot with the appropriate subtypes, such as markers only or lines with markers.
- Customize the chart by adding titles and axes labels, changing the marker size or color, and adjusting the chart layout.
After mastering the scatter plot with z-scores, let’s learn how to create an equally informative line chart using z-scores.
How to Create a Z-score Line Chart
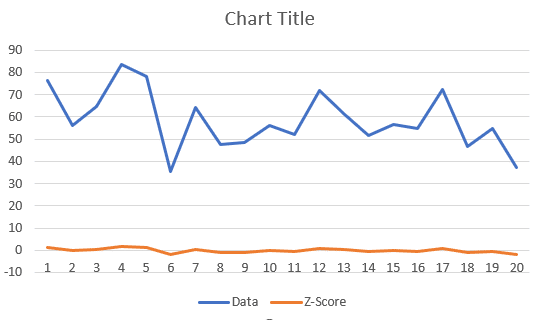
Follow these steps to create a line chart with z-scores:
- Select the data range for your x-values and the corresponding z-scores for your y-values.
- Click on the Insert tab and then click on Line in the Charts group.
- Choose a line chart with the appropriate subtypes, such as 2D or 3D.
- Customize the chart by adding titles and axes labels, changing the line style or color, and adjusting the chart layout.
Having explored line charts, let’s now shift our focus to constructing z-score bar charts, another effective way to visualize our data
How to Create a Z-score Bar Chart
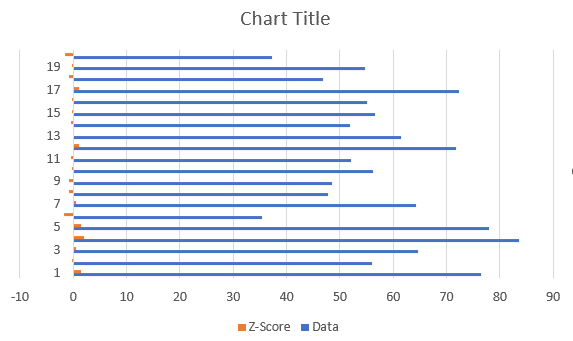
To create a bar chart with z-scores, follow these steps:
- Select the data range for your x-values and the corresponding z-scores for your y-values.
- Click on the Insert tab and then click on Bar chart in the Charts group.
- Choose a bar chart with the appropriate subtypes, such as 3D or stacked.
- Customize the chart by adding titles and axes labels, changing the bar color or pattern, and adjusting the chart layout.
Next, we will delve into creating z-score boxplots, a powerful tool for statistical representation in Excel.
How to Create a Z-score Boxplot
To create a boxplot with z-scores, follow these steps:
- Select the data range for your z-scores.
- Click on the Insert tab and then click on Box & Whisker in the Charts group.
- Customize the chart by adding titles and axes labels, changing the box and whisker style or color, and adjusting the chart layout.
You can effectively use z-scores in various Excel charts by following these steps.
With the knowledge of how to create various z-score charts in Excel, let’s reflect on the overall importance and application of z-scores in data analysis.
Final Thoughts

In this article, we’ve learned that a z-score is a statistical measure that indicates how many standard deviations a data point is from the mean of a data set.
Calculating z-scores in Excel is straightforward and can be done using the STANDARDIZE function or manually applying the z-score formula.
To interpret a z-score, you can compare it to a standard distribution table or use the NORM.S.DIST function in Excel.
Z-scores can be used in various statistical applications, such as hypothesis testing and analyzing data distributions.
Applying this technique to your data analysis can provide valuable insights and help you make more informed decisions. We hope that this guide has helped you understand how to calculate z-scores in Excel.
Wanna learn more about developing Data models in the Real World? Check out the EnterpriseDNA YouTube channel.
Frequently Asked Questions
Now that we’ve covered the essentials of z-scores in Excel, let’s address some common questions to further enhance our understanding of this statistical concept.
What is the significance of z-scores in statistics?
Z-scores are significant in statistics because they allow us to understand where individual data points are located within a given data set, relative to the mean and standard deviation.
This information helps identify outliers, assess data distribution, compare multiple datasets, and conduct hypothesis testing.
Can I calculate z-scores for a range of data points in Excel?
Yes, you can calculate z-scores for a range of data points in Excel.
You can use the formula =(B2 - AVERAGE($B$2:$B$6)) / STDEV.P($B$2:$B$6) where B2 represents the data point, AVERAGE($B$2:$B$6) represents the mean of the data set, and STDEV.P($B$2:$B$6) represents the standard deviation of the data set.
How do I interpret a z-score in Excel?
To interpret a z-score in Excel, compare it to a standard regular distribution table or use the NORM.S.DIST function.
A positive z-score indicates that the data point is above the mean, while a negative z-score indicates that the data point is below the mean.
The further away the z-score is from zero, the more unusual the data point is relative to the mean and standard deviation.
Can I use z-scores in Excel charts?
Yes, you can use z-scores in Excel charts. You can create scatter plots, line charts, bar charts, and boxplots using z-scores to represent data points in a standardized manner. This can help in visualizing and analyzing the distribution of data.


