
A standard deviation is used to understand and compare the variability within a dataset or to assess its reliability when analyzing data.
So, how do you calculate it?
To calculate standard deviation in Excel, use the =STDEV.S function for samples or the =STDEV.P function for populations. Simply select the range of cells containing the data for which you want to find the standard deviation. For example, if your data is in cells A1 to A10, you would enter =STDEV.P(A1:A10) for population standard deviation, or =STDEV.S(A1:A10) for sample standard deviation. Excel will then calculate and display the standard deviation based on the data in the specified cells.

Today, you’ll learn how to get a standard deviation in Excel. We will break down the process into steps with demonstrations to help you better understand the concepts.
Let’s start learning.

How to Calculate Standard Deviation
There are 3 functions in Excel that are frequently used for calculating standard deviation.
The sfunctions are:
STDEV.S
STDEV.P
STDEVPA

1. How to Calculate Standard Deviation Using STDEV.S
STDEV.S stands for sample standard deviation. Its older version is STDEV.
It measures the variability or spread in a sample subset of a larger population.

You can use this standard deviation function when you’re working with a sample and want to infer or predict something about the larger population from which the sample is taken.
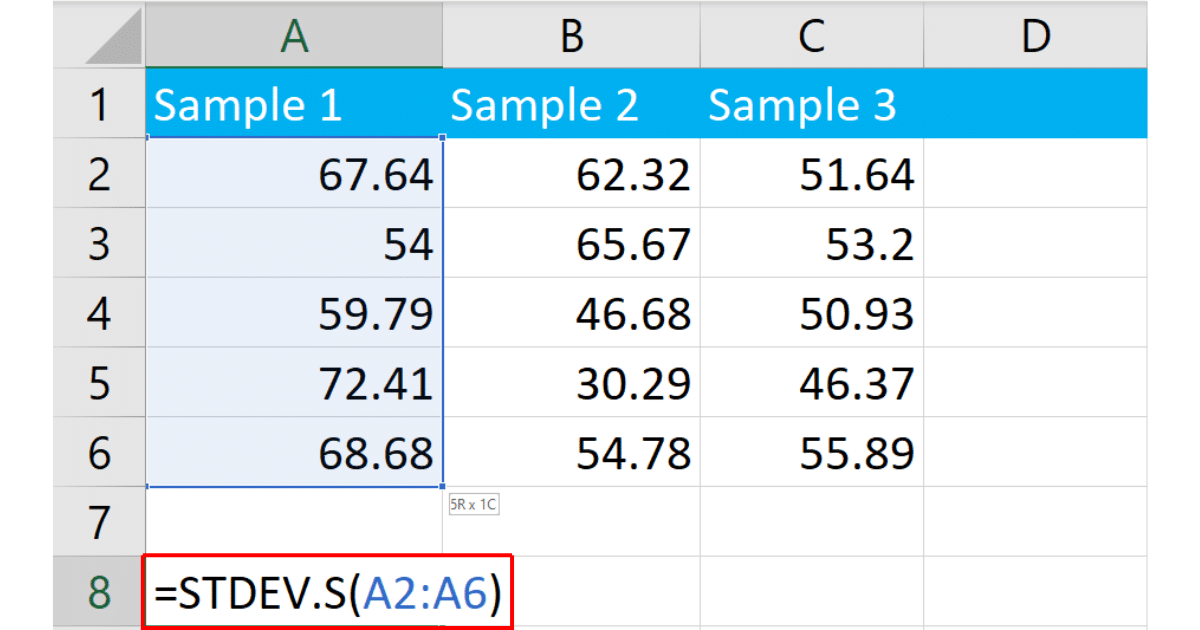
To calculate standard deviation, click on the cell where you want the standard deviation result to appear, and type the formula:
=STDEV.S(A2:A6)You can also use the older STDEV function:
=STDEV(A2:A6)A2:A6 represents the range of cells containing your data. You can change this according to your needs.
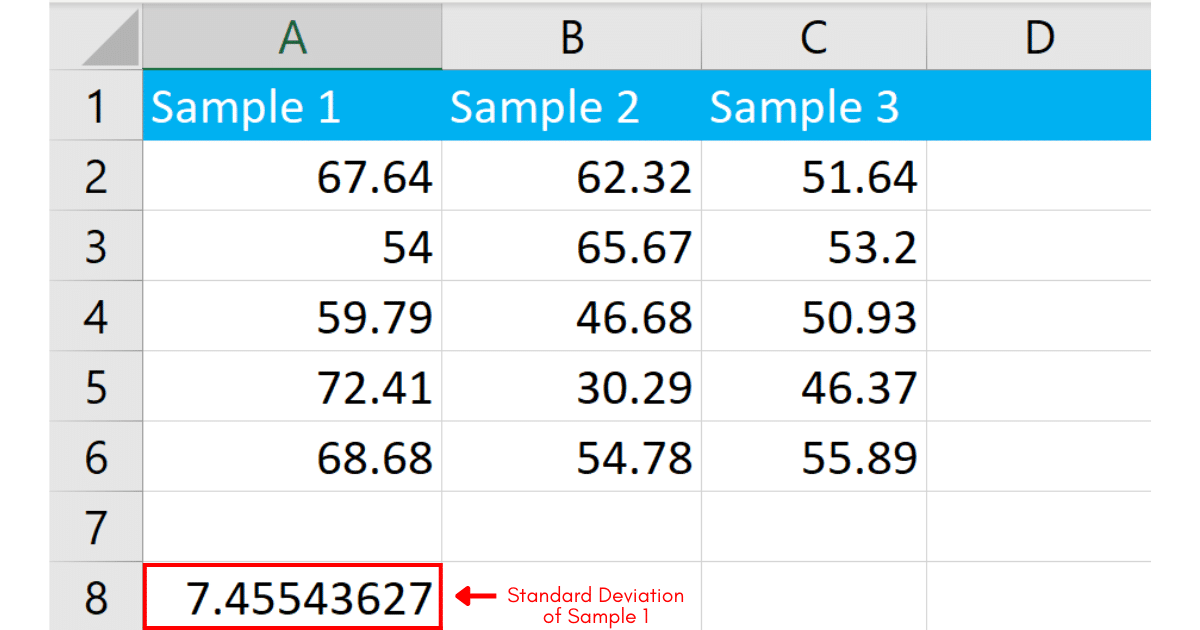
After entering the formula, press Enter. Excel will calculate and display the sample standard deviation for the data in the specified cells.
2. How to Calculate Standard Deviation Using STDEV.P
STDEV.P stands for population standard deviation. Its older version is STDEVP.
It measures how much variation or dispersion there is from the average (mean) in a set of data that represents the entire population.
You can use this function when your dataset includes the entire population, and you’re not trying to infer or predict but rather describe the population itself.
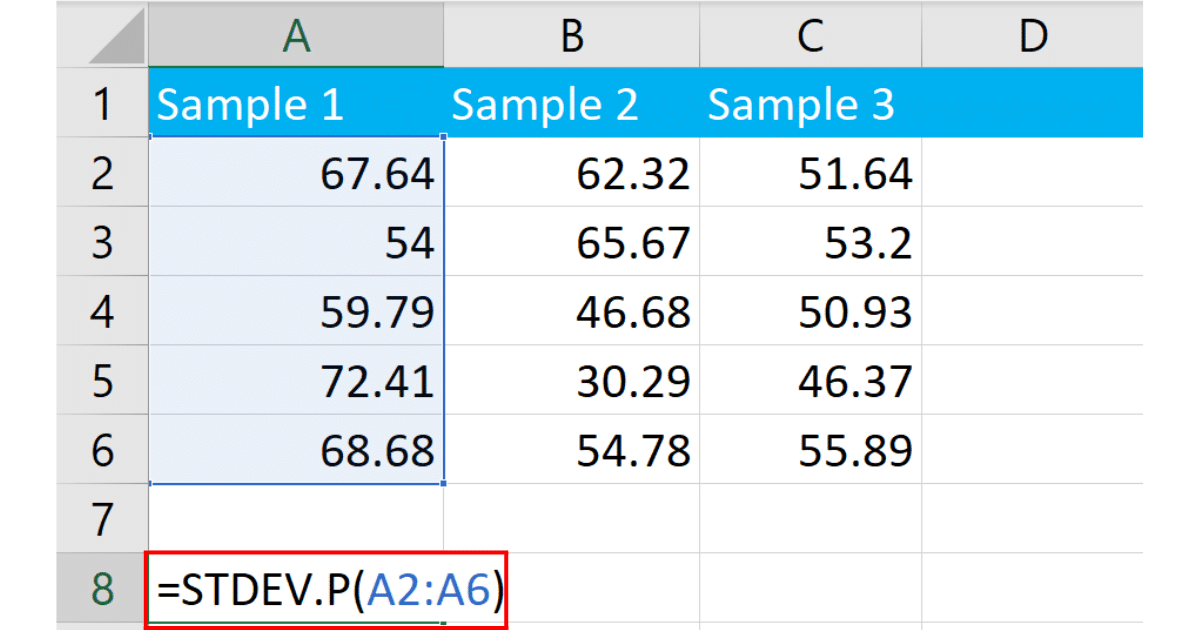
Click on a cell where you want to display the standard deviation result, and type in the formula:
=STDEV.P(A2:A6)You can also use the older formula:
=STDEVP(A2:A6)A2:A6 represents the range of cells containing your data with numerical values.
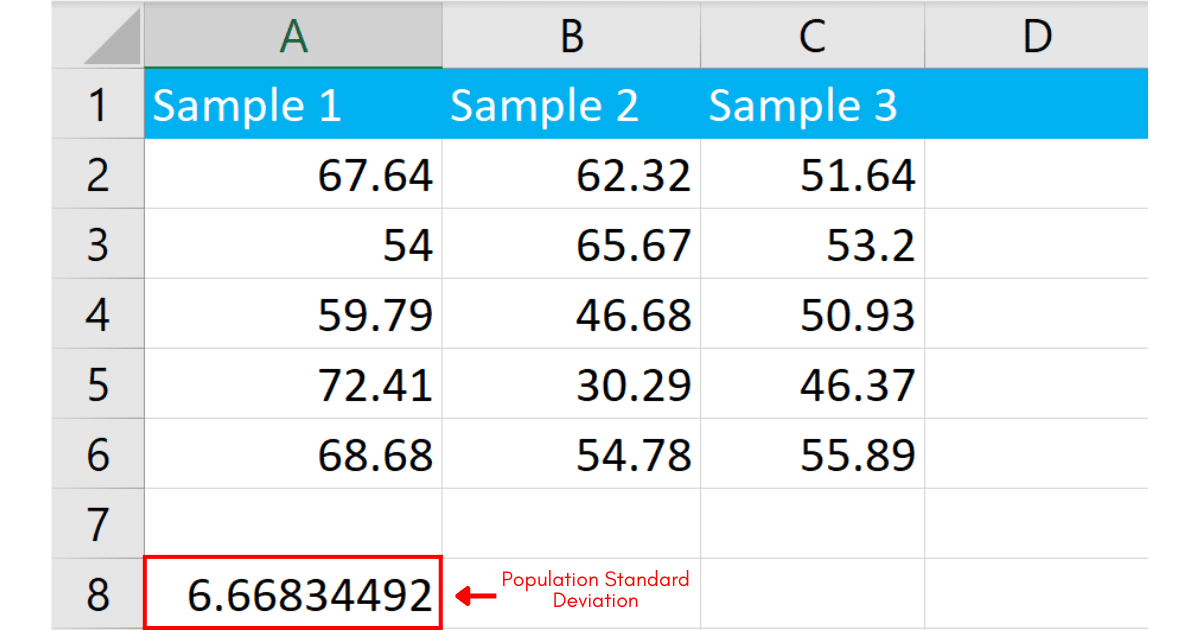
After entering the formula, press Enter. Excel will calculate and display the population standard deviation value for the data in the specified data point cell.
How to Calculate Standard Deviation Using STDEVPA
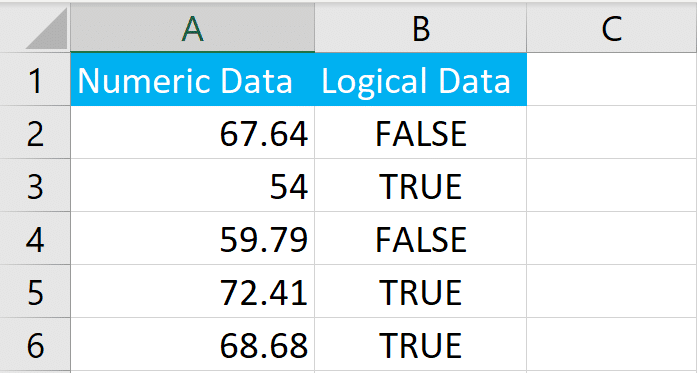
Calculating the standard deviation using the STDEVPA function in Excel is quite similar to using other standard deviation functions, but with a key difference: STDEVPA includes all values in the calculation, treating text and logical values (TRUE/FALSE) as part of the dataset.
Let’s say we have a sample data as follows:
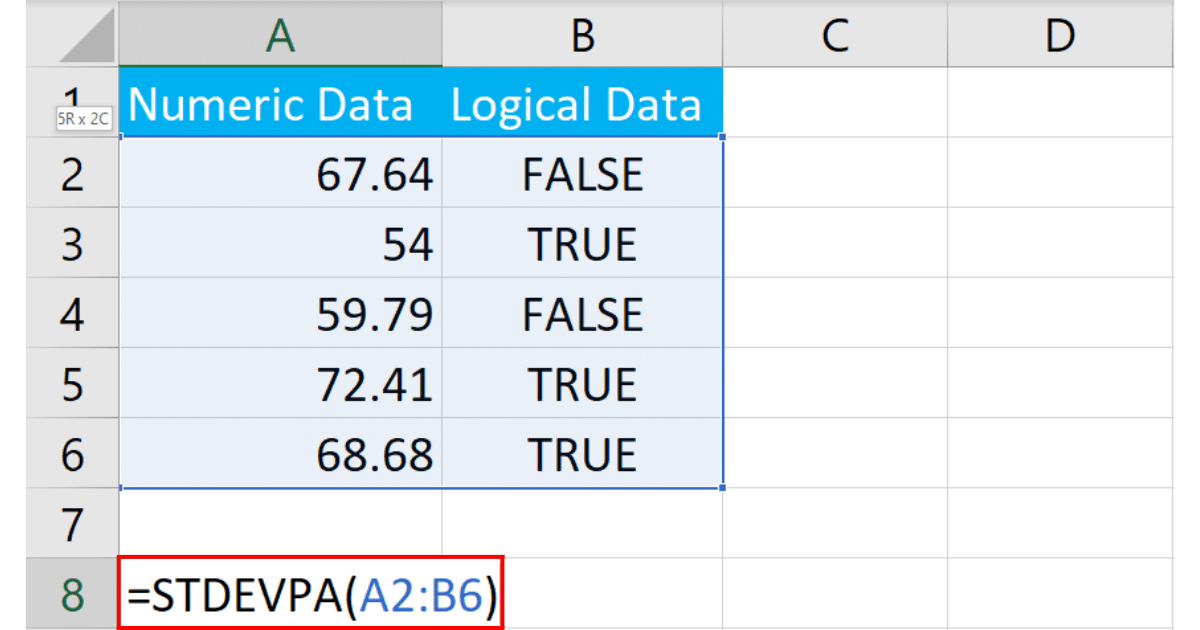
To use STDEVPA function, start by entering the formula. In our case the formula will be:

=STDEVPA(A2:B6)A2:B6 defines the range of the dataset.
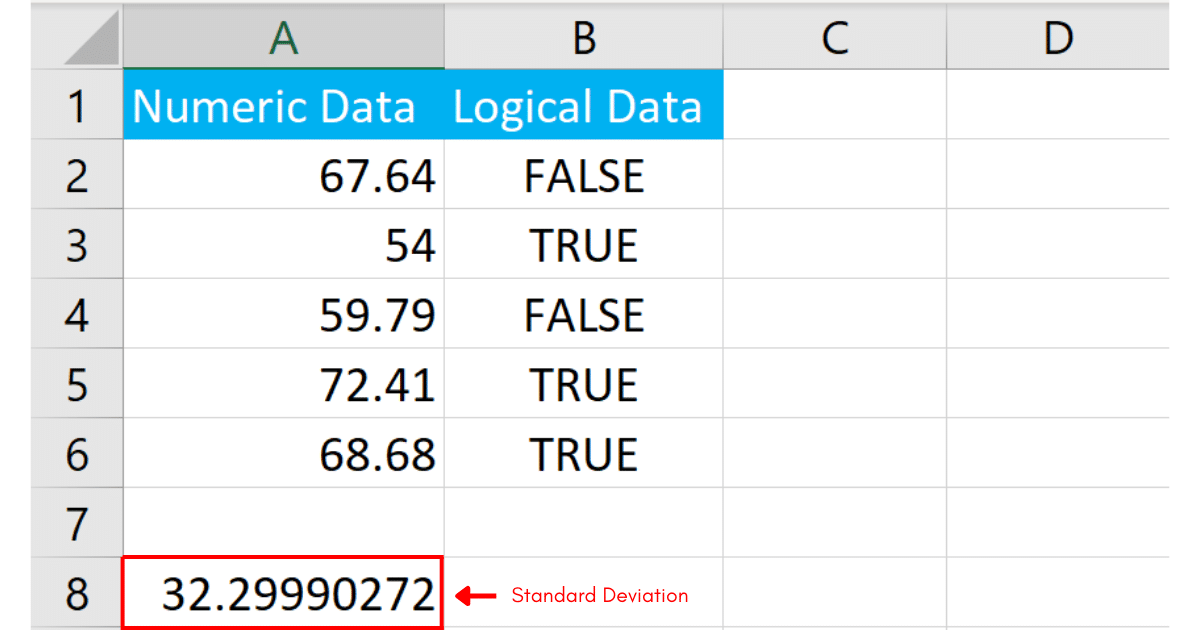
After entering the formula, press Enter. Excel will calculate the standard deviation for the data in your specified range, including any text or logical values in the calculation.
How to Interpret Standard Deviation
Now that you learned how to calculate standard deviation, its is important that you learn how to interpret it.
Standard deviation is a statistical measure that quantifies the degree of variation or dispersion in a dataset relative to its mean. It is a crucial tool for understanding the spread of data points, indicating whether they are closely clustered or widely dispersed.
For instance, in a classroom setting, let’s consider the test scores of two different classes, Class A and Class B.
Suppose Class A’s scores are 85, 88, 84, 87, and 86, while Class B’s scores are 70, 90, 60, 95, and 65. Both classes may have the same average score, but Class A would have a smaller standard deviation compared to Class B.
This smaller standard deviation indicates that Class A’s scores are more consistent and clustered closely around the mean, suggesting a uniform performance level.
On the other hand, Class B, with a higher standard deviation, reflects greater variability in student performance, indicating a more diverse range of scores.

Learn how to use frequency and proportion tables in Excel by watching the following video:
Final Thoughts
As you wrap up your journey in understanding how to calculate standard deviation in Microsoft Excel, it’s important to appreciate why this skill is so valuable.
Remember, standard deviation isn’t just a number; it’s a key to unlocking insights in data analysis, be it in business, education, or research.
By mastering this tool, you’re equipping yourself to make informed decisions, understand trends, and recognize patterns that are not immediately apparent.
Imagine being able to pinpoint inconsistencies in sales data, gauge the reliability of research results, or understand student performance variability. This is the power standard deviation hands to you.
Frequently Asked Questions
In this section, you will find some frequently asked questions you may have when calculating standard deviation in Excel.

What is the difference between the STDEV.S and STDEV.P functions in Excel?
The STDEV.S function is used to calculate the standard deviation of a sample, while the STDEV.P function is used for the standard deviation of a population.
The main difference is in the denominator of the formula used for the calculation. The STDEV.S function uses n – 1 in the formula, where n is the number of elements in the sample, to provide an unbiased estimate of the population standard deviation.
On the other hand, the STDEV.P function uses n in the formula and is appropriate when calculating the standard deviation for an entire population.
What is the STDEVP function in Excel?
The STDEVP function in Excel is another way to calculate the standard deviation for a population. It is an older function that has been replaced by the STDEV.P function.
The syntax for the STDEVP function is the same as STDEV.P, and both functions provide the same result.
How can I calculate standard deviation in Excel 2016?
To calculate the standard deviation in Excel 2016, you can use either the STDEV.S or STDEV.P function, depending on whether you want to calculate the standard deviation for a sample or a population.

For example, if your data is in cells A1 to A5, you can use the following formulas:
STDEV.S: =STDEV.S(A1:A5)
STDEV.P: =STDEV.P(A1:A5)
What are the common errors associated with the STDEV.P function?
Common errors associated with the STDEV.P function include:
#VALUE!: This error occurs when the data provided to the function is not numeric.
#DIV/0!: This error occurs when the data array has fewer than two values, which is insufficient to calculate the standard deviation.
#NUM!: This error occurs when the data array has a non-numeric value, or if the value of k (the population standard deviation divisor) is not an integer.
#N/A: This error occurs when the function is used in a shared workbook and the data is not available for one or more sheets.
Can I calculate standard deviation in Excel for Mac?
Yes, you can calculate standard deviation in Excel for Mac. The process is the same as in Excel for Windows.
You can use the STDEV.S or STDEV.P functions to calculate the standard deviation of a sample or population, respectively.


