
You know how Microsoft Excel is your buddy for handling loads of data, right?
Well, here’s the scoop: it’s not all unlimited.
There’s a limit to the number of rows it can handle, but keep in mind that it can handle more than a million rows!

So, it’s crucial to know your Excel’s row-handling superpower, depending on the version you’re using.
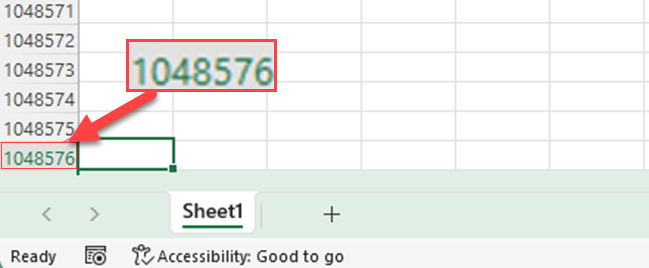
All Excel versions from 2007 onwards, including Microsoft 365, can handle up to 1,048,576 rows per worksheet. But, in the old Excel versions like Excel 2003 and before, they could only handle up to 65,536 rows.
Understanding these limits enables you to properly plan when dealing with large data sets and ensures efficiency while maintaining data integrity.
Time to dive deeper and explore!
Understanding Excel’s Row and Column Capacity
When working with Excel, it’s essential to know its capacity concerning rows and columns, as this affects the organization and analysis of your data.
Also, Excel is designed to handle a large number of rows and columns to accommodate extensive datasets.

In all Excel versions from 2007 onwards, including Microsoft 365, the maximum number of rows that Excel can handle is 1,048,576. This is a substantial increase from previous versions of Excel, making it possible to work with larger datasets.
This capacity refers to the number of cells you can create within a single worksheet.
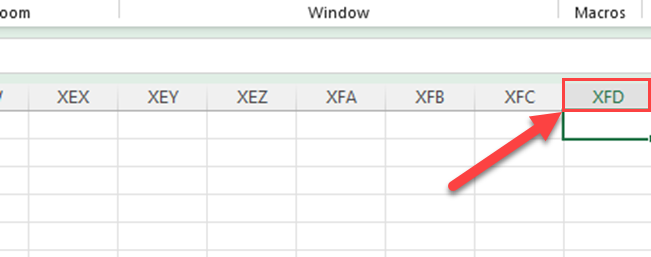
As for columns, the maximum number is 16,384. The last column is XFD.
Keep in mind that while Excel can handle a high number of rows and columns, certain factors, such as available memory or the complexity of your formulas, could impact how effectively you can use all of them.
To use Excel’s capacity efficiently, consider the following best practices:
- Avoid adding unnecessary data to your spreadsheet.
- Use filters to reduce the amount of data displayed.
- Optimize calculations using more efficient formulas or functions.
By understanding Excel’s row and column capacity and following best practices, you can effectively manage your data and ensure a smooth experience while working with large datasets and extensive spreadsheets.
Excel Versions and their Specifications
Microsoft 365, Excel 2019, Excel 2016, Excel 2013, Excel 2010, and Excel 2010

If you use Excel spreadsheet versions of 2007 onwards, you can work with a maximum of 1,048,576 rows by 16,384 columns on a worksheet.
Each column can have a width of up to 255 characters, while the row height can go up to 409 points. In this version, a cell can contain a total of 32,767 characters.
Excel 2003

In Excel 2003, the number of rows and columns supported was lower than in newer versions, with a capacity of 65,536 rows by 256 columns.
Column width restrictions remained at 255 characters, and row height could reach up to 409 points. As in later versions, you could store up to 32,767 characters in a single cell in Excel 2003.
Incorporation of Data Model and Power BI
Even though there are a million rows in Excel, sometimes it’s not sufficient for your analysis.
When you’re dealing with lots of data in Excel, you can make your analysis better by using the Data Model and Power BI.
Excel Data Model:
In newer versions of Excel, there’s a feature called the “Data Model.” This feature enables you to work with large datasets that go beyond the traditional row limit by creating relationships between tables and performing complex data analysis.

The Data Model is a step towards overcoming the row limits of Excel worksheets, but it’s not a complete solution for extremely large datasets.

Power BI’s Data Model:

Power BI, on the other hand, is a dedicated business intelligence tool that has a robust data modeling engine. It’s designed to handle large datasets efficiently, well beyond what Excel can manage.
Power BI’s Data Model can handle millions of rows of data and offers enhanced performance and scalability.
Interconnectivity:
The relationship comes into play when you want to work with large datasets that exceed Excel’s row limits. You can use Excel to set up your initial data model or calculations and then import this data into Power BI.
Power BI can seamlessly leverage the data model created in Excel. This allows you to maintain the relationships, calculations, and data modeling you’ve built in Excel while taking advantage of Power BI’s performance and scalability benefits.
In essence, Excel’s ability to handle rows is limited by its version and the presence of the Data Model.
On the other hand, Power BI, with its powerful Data Model, offers a better solution for working with extremely large datasets and can seamlessly work with data models created in Excel, providing more scalability and improved performance.
Working within 32-bit and 64-bit Environments

When you use Excel, it’s important to know if you’re using a 32-bit or 64-bit system. This affects how well Excel performs and its limitations. Both versions can handle lots of rows and columns, but the big difference is in how much memory they can use.
In a 32-bit system, Excel can typically use up to 2 GB of memory. However, with Excel 2016 and newer on a 64-bit Windows system, it can go up to 4 GB. This helps it work better with big data and complex calculations.
But with 64-bit Excel, there are no strict memory limits. It can use as much memory as your computer has, making it great for handling huge amounts of data.
No matter which version you use, the number of rows and columns Excel can handle doesn’t change. It’s all about the memory. Understanding your system and its limits will help you use Excel more efficiently, especially with large datasets.
Dealing with Excel’s Limitations
Pivot Tables
One way to deal with Excel’s row limitations is by using Pivot Tables. It can help you summarize and analyze large datasets efficiently, allowing you to extract meaningful information from your data.
If your dataset exceeds the Excel row limit, you might face challenges creating Pivot Tables directly. In situations where your data exceeds Excel’s row limits, you might need to segment or split your data into multiple worksheets or workbooks and create separate Tables.
To create a Pivot Table, follow these steps:
Step 1
Select the range of cells containing your data.
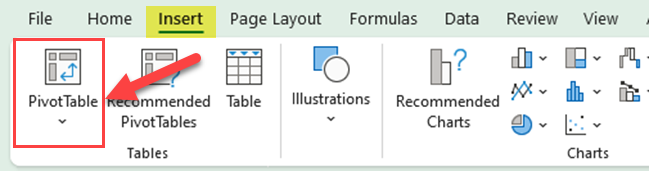
Step 2
Click on the Insert tab and choose PivotTable.
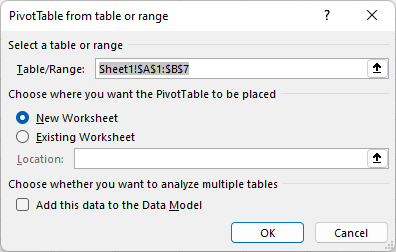
Step 3

In the “PivotTable from table or range” dialog box, verify the selected data range and choose the location for your PivotTable.
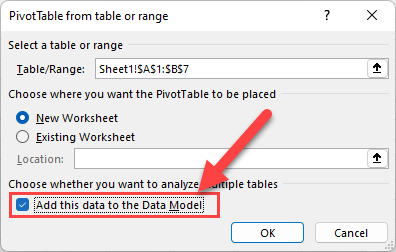
Step 4
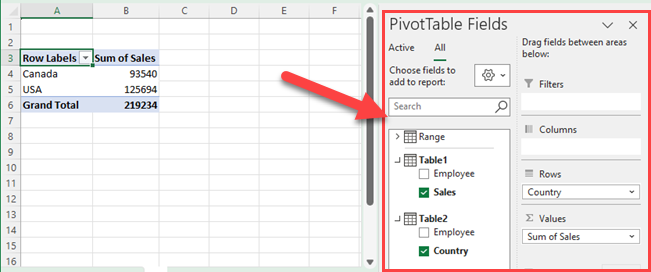
Check the “Add this data to the Data Model” box to analyze multiple tables.
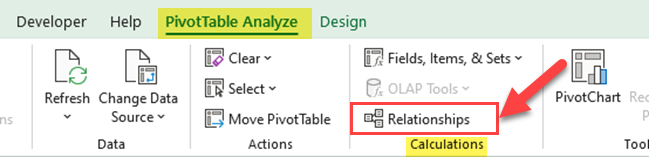
Step 5
Go to the Pivot Table Analyze tab and click Relationships in the “Calculations” group.
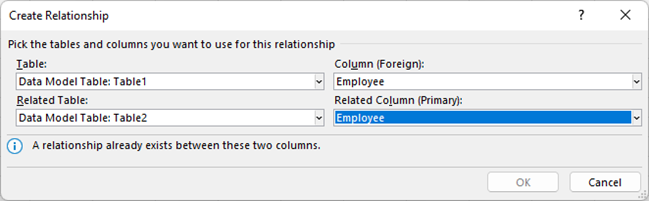
Step 6
Create relationships between Tables.
Step 7
Drag and drop fields from the PivotTable Fields list to define your rows, columns, values, and filters.
By using PivotTables, you can summarize and analyze data without displaying the entire dataset in all Excel rows in the entire Excel workbook.
Memory storage
Another aspect to consider when dealing with Excel’s limitations is memory storage. Excel uses your computer’s memory (RAM) to store and process data, and larger datasets can consume more memory resources.
To optimize memory usage, try the following:
- Remove unnecessary formulas: Replace complex formulas with their calculated values, or use simpler functions if possible.
- Condense your data: Remove duplicate or irrelevant rows, and use shorter text strings when possible.
- Minimize file size: Save your workbook in the .xlsx or .xlsb format, as these formats are more efficient with storage.
- External data management: For very large datasets, consider linking to external data sources instead of importing the entire dataset into Excel.
By managing memory storage efficiently, you can work with larger datasets in Excel while minimizing performance issues related to the software’s limitations.
Power Query
Power Query is another useful tool for working with, cleaning, and transforming large data sets in Excel. This feature lets you connect to and import data from various sources, then refine and clean the data in a user-friendly interface.
To use Power Query, go to the Data tab, click “Get Data,” and choose the appropriate data source.
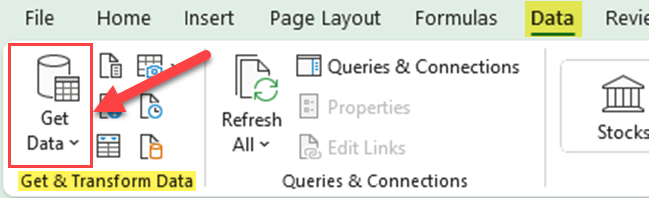
Excel will guide you through the process of loading, shaping, and combining your data.
Remember to always work within Excel’s row and column limits (1,048,576 rows and 16,384 columns). Utilizing PivotTables and efficiently managing memory storage will help you overcome Excel’s limitations and ensure a smooth user experience.
Tableau: An Alternative to Excel
Tableau is a powerful data visualization tool that can handle large datasets with ease.

Unlike Excel, which may struggle to process millions of rows, Tableau does not enforce any row or column limits for the amount of data that can be imported. The actual limits depend on factors such as hardware resources, such as computer memory, processing power, and disk space.
In comparison to Excel, Tableau’s user interface is designed to simplify and expedite the process of generating graphs and charts. The mobile-friendly interface allows you to visualize your data effectively, regardless of your device.
By efficiently running on extracted data sources, Tableau optimizes your data processing experience. Should you encounter slow data speeds, you have the option of improving your hardware and reducing the size of your data source by removing columns, filtering rows, or consolidating (aggregating) rows. This process of optimization is significantly more streamlined than Excel.
In summary, if you’re dealing with large datasets and require a reliable alternative to Excel, Tableau is an excellent choice. It offers a user-friendly interface and adaptive data processing that can handle millions of rows, making it a perfect solution for your data visualization needs.
Final Thoughts
In a nutshell, knowing how many rows Excel can handle is crucial when working with data. Newer Excel versions can handle lots of rows, which is great for Excel work.
But if you’re dealing with really, really big data, you might run into limits. No worries, though! There are advanced features such as the Data Model, Power Pivot, and Power Query, or dedicated business intelligence tools like Power BI to help you out.
Remember, Excel’s row limitation is just one part of the data analysis puzzle. With the right knowledge and tools, you can manage and analyze large amounts of data effectively, whether it’s thousands or millions of rows.
If you’re interested in understanding the impact of AI on data professionals, be sure to check out the video below as you will be able to incorporate it with Excel too.
Frequently Asked Questions
What is the maximum row limit in Excel?
The maximum number of rows that Microsoft Excel can handle is 1,048,576. You can see the row numbers on the row header located on the left side of your worksheet.
Does the row limit vary between Excel versions?
Older Excel versions, such as those using the .xls filetype, have a maximum row limit of 65,536. However, more recent versions using the .xlsx filetype can handle the full 1,048,576 rows.
Can Excel handle over a million rows?
Excel can handle 1,048,576 rows in a single worksheet. If you need to work with datasets larger than the Excel row limit, you may need to consider using other tools or software.
How to work with datasets larger than the Excel row limit?
For datasets larger than the Excel row limit, you can use tools such as database management systems or data analysis software like R or Python, which can handle larger data sets. Alternatively, you can use Power Query in Excel to import subsets of the data and analyze the data in separate chunks.
Do CSV files have a higher row limit than Excel?
CSV files as a format do not have a specific row limit, and they can be opened and read with a text editor or processed by other tools beyond the capabilities of Excel. However, when importing a CSV file into Excel, the same row limit of 1,048,576 applies.
Does increasing rows in Excel affect its performance?
As the number of rows and columns in an Excel worksheet grows, file size and system memory consumption can increase, which may impact Excel’s performance. It is recommended to work with smaller datasets when possible or consider alternative tools for large datasets.


