
When working with data, bookmarks offer a streamlined and personalized way to navigate through large volumes of your dataset. They help you capture specific views, including the applied filters, visuals, and slicer states; this makes data interpretation and communication far more efficient.
Power BI bookmarks provide users the capability to capture and revisit the current state of a report page, including filter settings and the state of visuals. Bookmarks can be created, managed, and used both on Power BI Desktop and Service and allow for a more interactive and personalized presentation of data.
This guide will provide an overview of bookmarks in Power BI, explaining the fundamentals and types of bookmarks available. You’ll learn the steps to create, manage, and use bookmarks on both Power BI Desktop and Service. We’ll also cover advanced features like drill locations, troubleshooting tips, and best practices for optimizing bookmarks in Power BI reports.

Follow along to master bookmarks and unlock more intuitive data exploration!
What Are Power BI Bookmarks?
Bookmarks are a Power BI feature that allows users to save a specific view of a report page, making it easier to navigate and explore interesting insights.
This is done by capturing the current state of your report, including the selected visuals and slicer values. This provides a powerful way to highlight key insights and create easy-to-navigate report layouts.
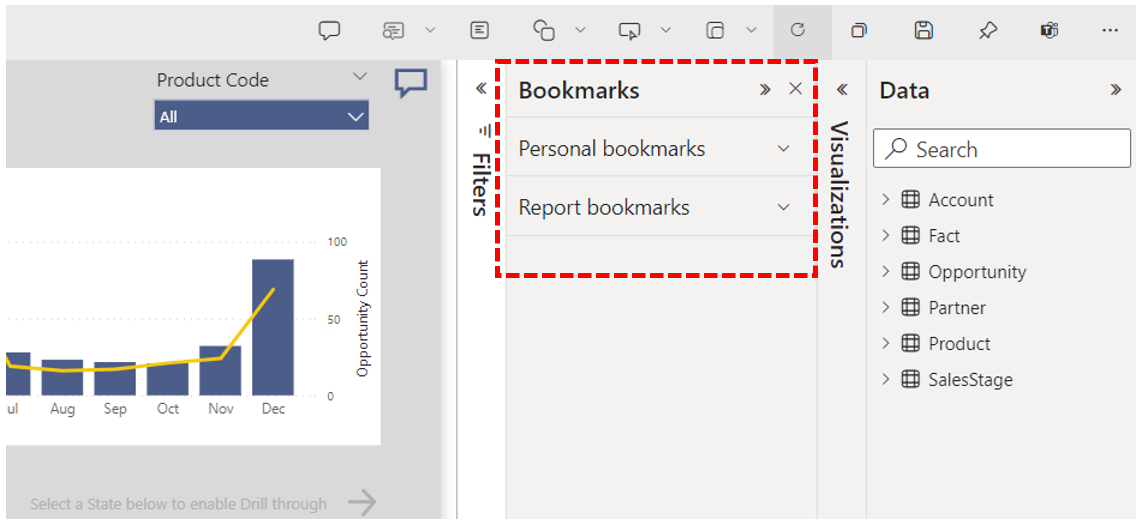
There are two main types of Power BI bookmarks:
- Personal Bookmarks: These are created by individual users in the Power BI service and are only visible to the creator.
- Report Bookmarks: These are created by report authors in Power BI Desktop or Power BI Service during Power BI report design and can be shared with other users who have access to the report.
When creating a Power BI bookmark, you have the option to determine which states and visuals are captured. Here’s what that means:
- State: Captures the current state of visuals, filters, and slicers in the report.
- Visuals: Determines the subset of visualizations that are captured by the bookmark.
- Capture: Records the selected visuals and their properties for use in the bookmark.
By default, all visuals and their states are captured, but you can choose to modify this using Power BI’s bookmark settings.

Now that we’ve gone over the fundamentals let’s take a look at how you can create bookmarks in Power BI in the next section.
How to Create Bookmarks in Power BI
While the method to create bookmarks is essentially the same whether you are using Microsoft Power BI as a desktop application or as the Power BI Service in the cloud, the desktop version only supports report bookmarks while the online version supports both report and personal bookmarks.
1. Power BI Desktop
To create a Power BI bookmark that saves the current state of a report page in Power BI Desktop, follow these steps:
- Configure your report page exactly how you want it to look for the bookmark. This includes adding filters, adjusting slicers, and modifying visuals.
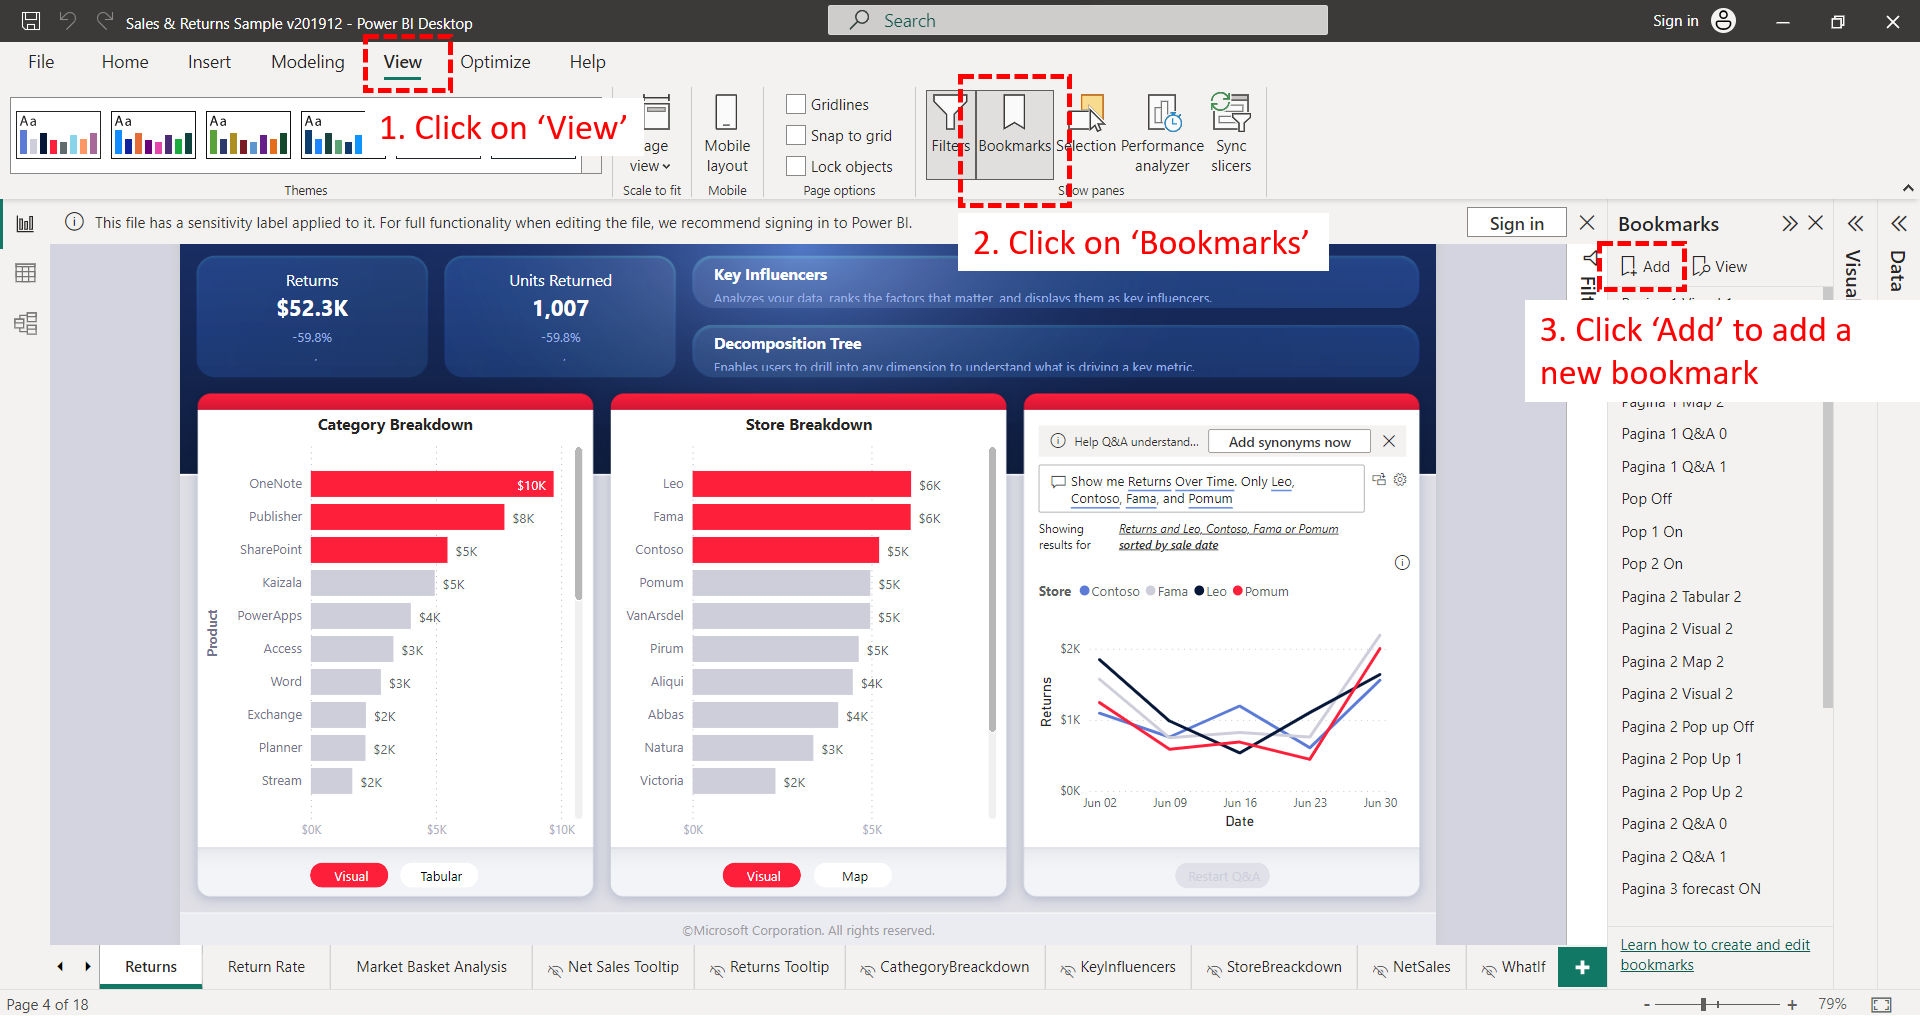
- Open the Bookmark pane by going to the “View” tab and selecting “Bookmarks.”
- Click on “Add” in the Bookmark pane to save the current view as a bookmark. Rename the bookmark by double-clicking the default name.
- Repeat these steps to create multiple bookmarks as needed.
2. Power BI Service
To create a Report Bookmark in the Power BI Service, do the following:
1. Open the report in Edit mode.
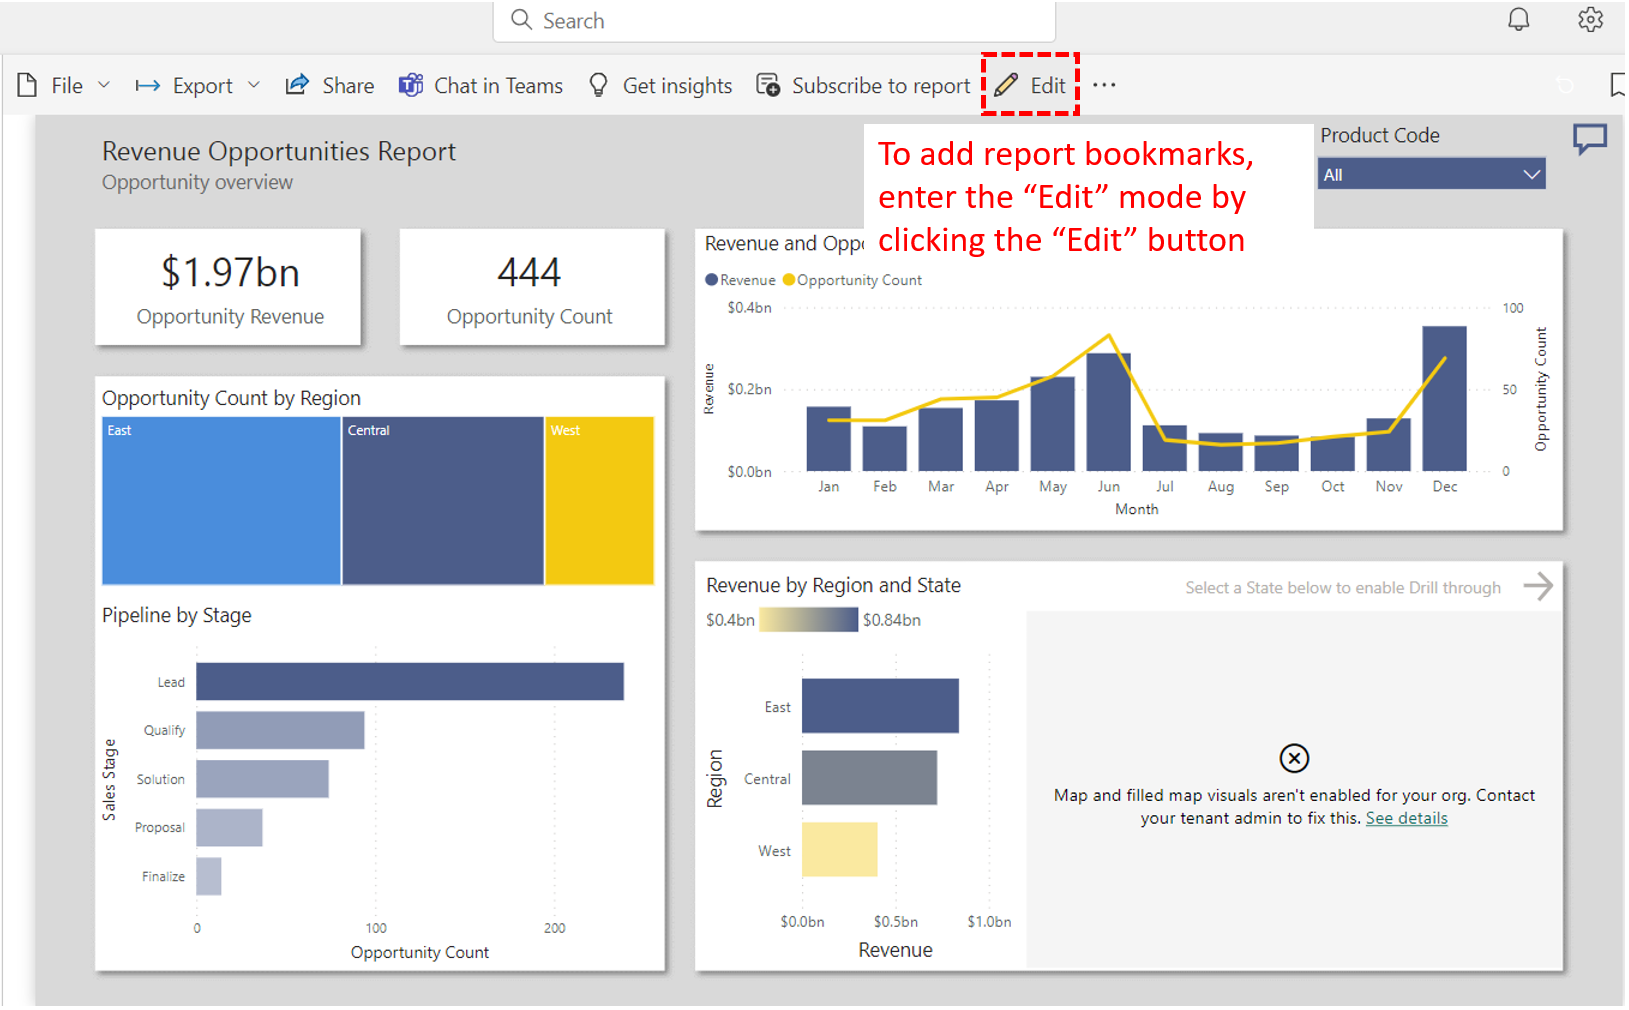
2. Adjust the report view to your liking
3. Click on “View” and toggle the “Bookmarks pane” to On.
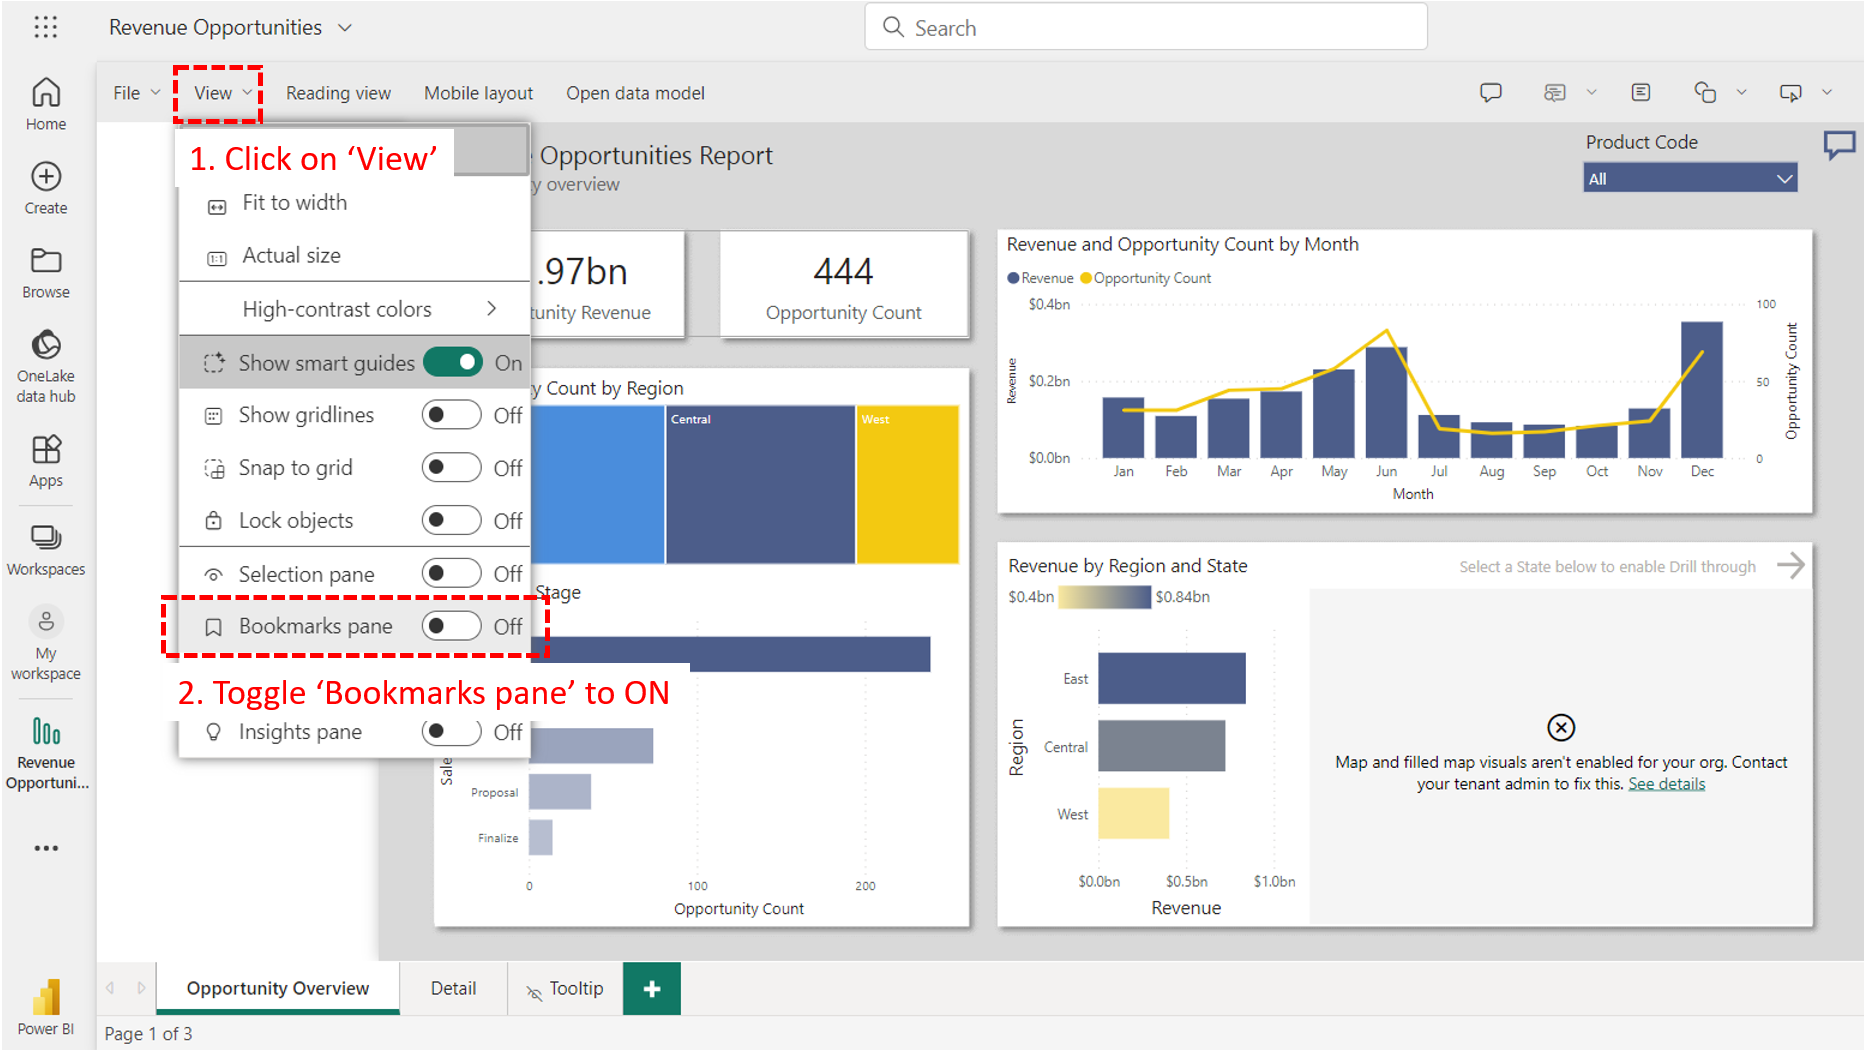
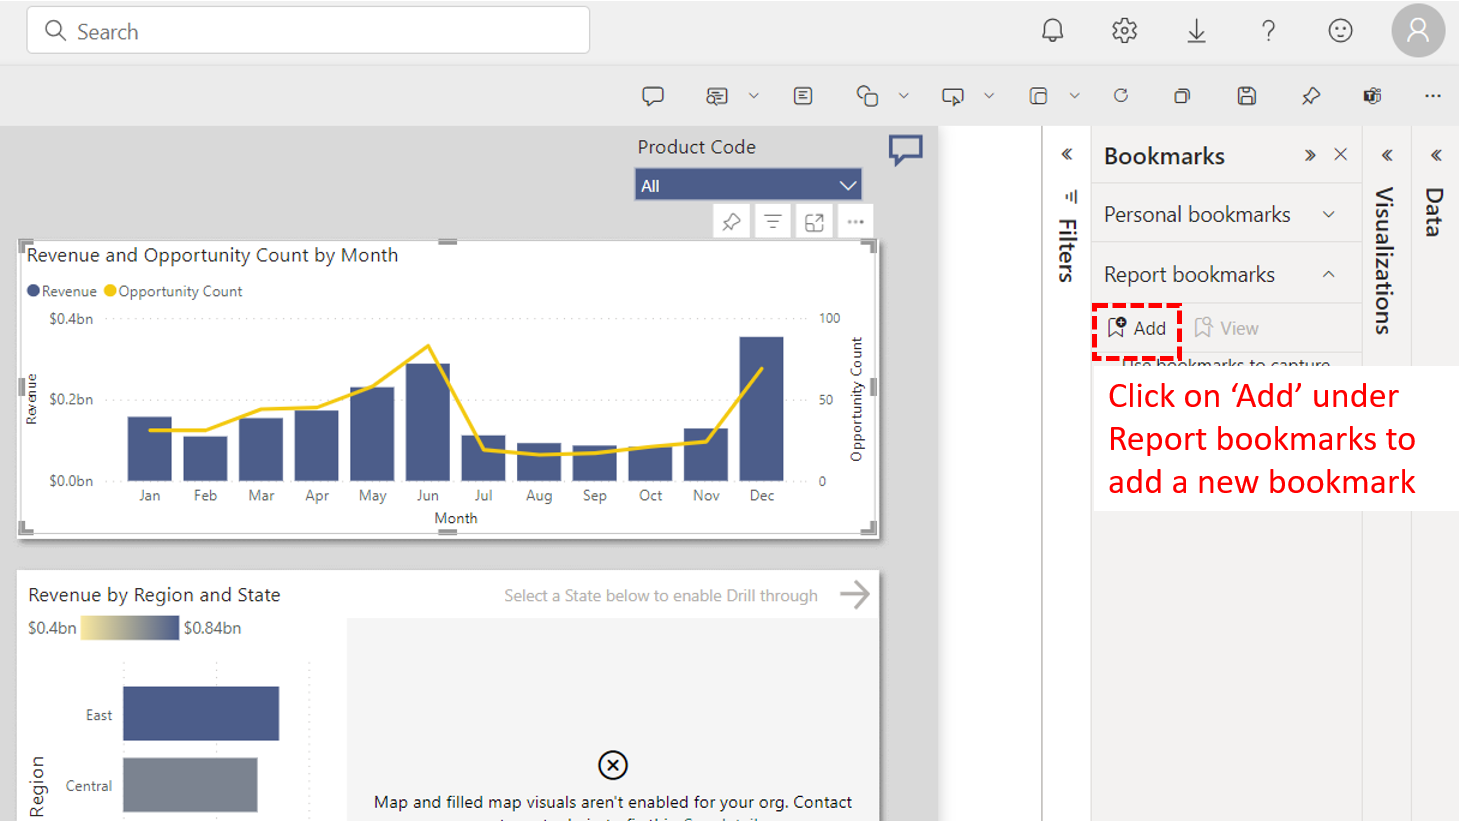
4. Choose “Add” from the Bookmarks pane. A new bookmark is created with a default name. Rename the bookmark by double-clicking on it.
And, to create a Personal Bookmark:
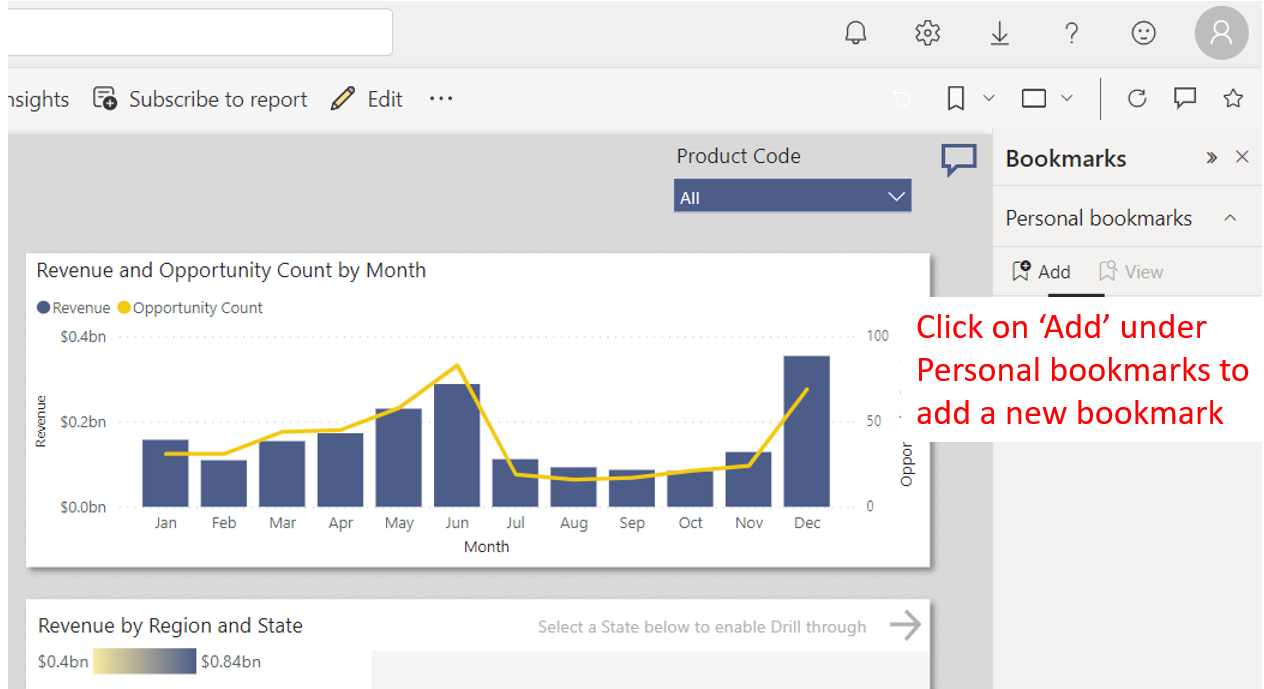
1. Personal bookmarks can be created by opening the report in the Report mode or the “Reading view“.
2. Modify the view as desired, click on “Add” under Personal Bookmarks in the Bookmarks pane, enter a name for the bookmark and click “Save“
Now that we’ve gone over how you can create bookmarks in Power BI, let’s discuss how you can manage your bookmarks once you’ve created them in the next section.
Managing Bookmarks in Power BI
To manage bookmarks in the Bookmarks pane, you can use the following options:
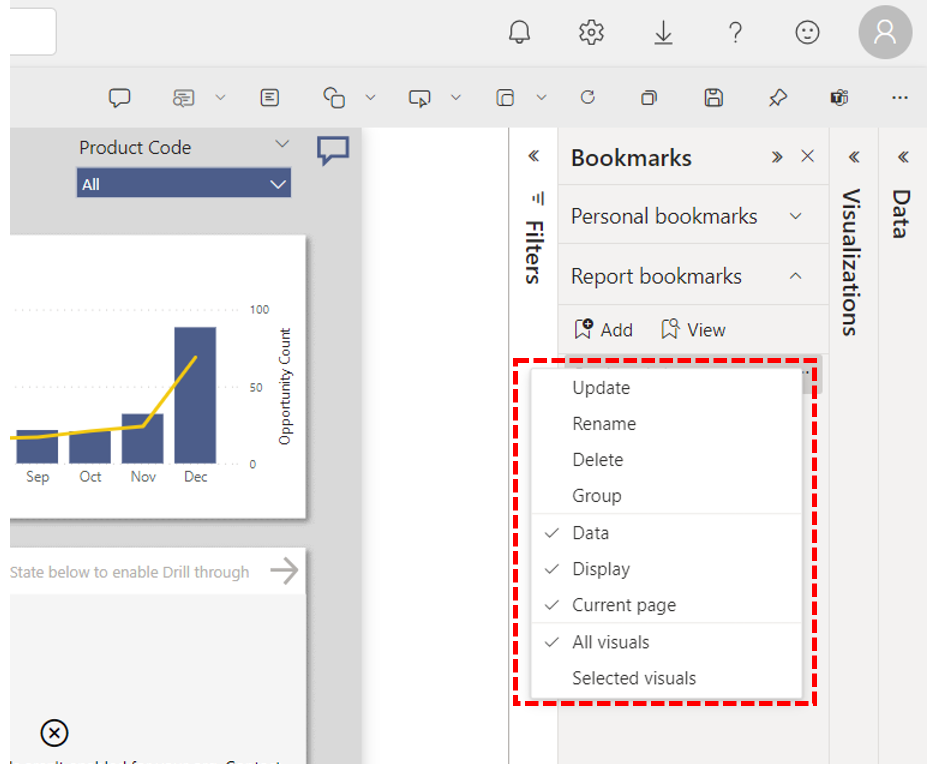
- Update: Click the ellipsis icon next to a bookmark and select “Update” to modify the view of previously created bookmarks.
- Rename: Click the ellipsis icon next to a bookmark and select “Rename” to modify the name of previously created bookmarks.
- Delete: Click the ellipsis icon next to a bookmark and select “Delete” to remove it.
- Group: Organize bookmarks into bookmark groups by selecting one and clicking the ellipsis icon, then choosing “Group.” You can rename the group and add other bookmarks to it as needed.
You can arrange the order of bookmarks in the Bookmarks pane by doing the following:
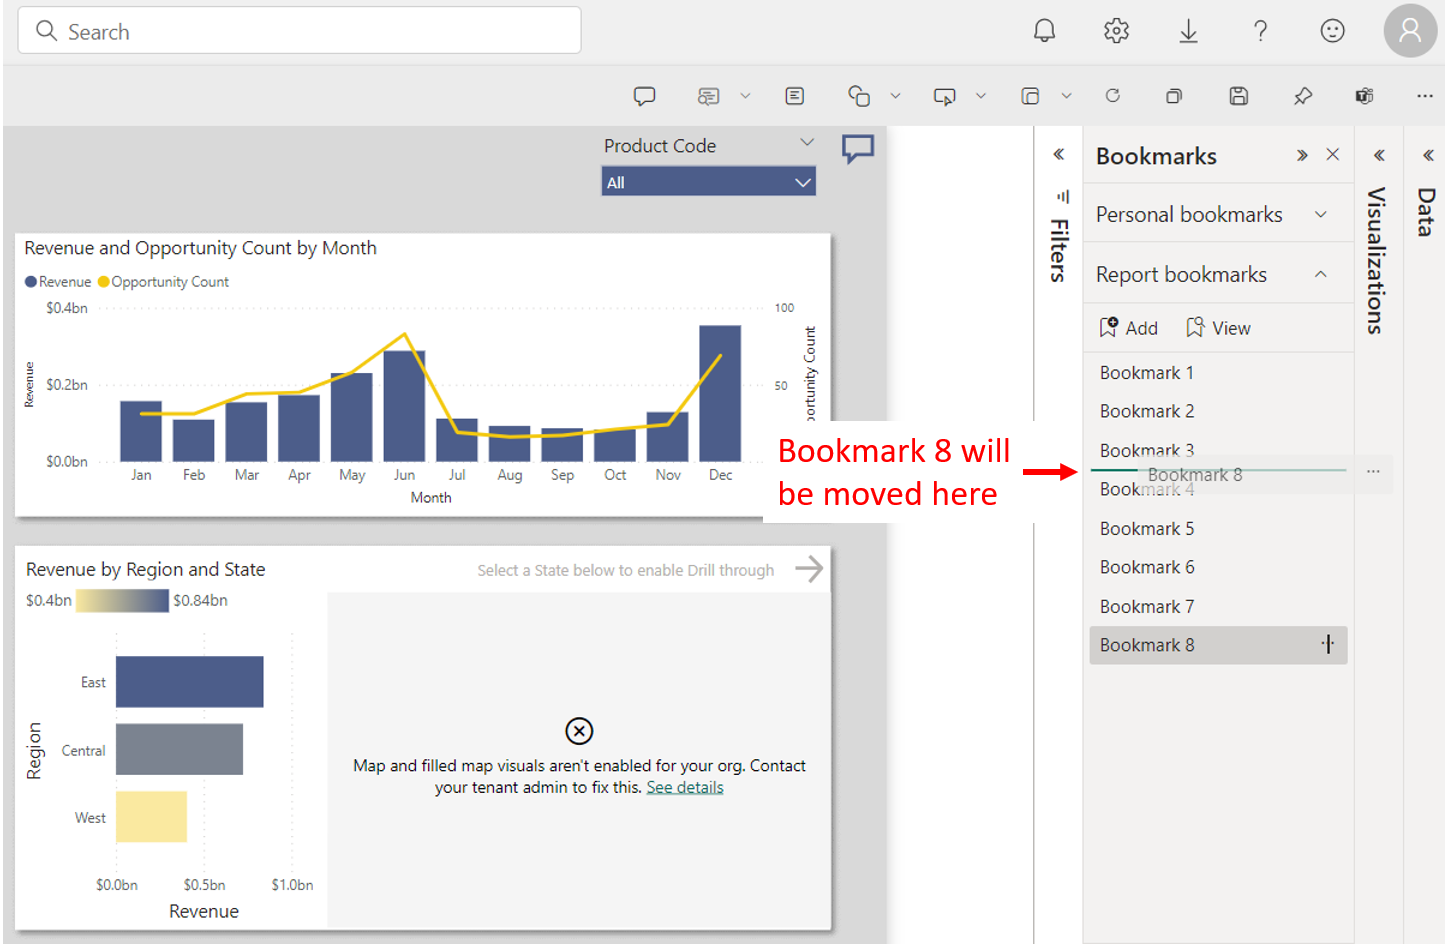
- In the Bookmarks pane, click and drag a bookmark to the desired position.
- A green line will indicate where the bookmark will move to.
- Drop the bookmark into its new position in the list.
- Repeat the steps for other bookmarks until they are ordered appropriately.
Sharing Personal Bookmark Views
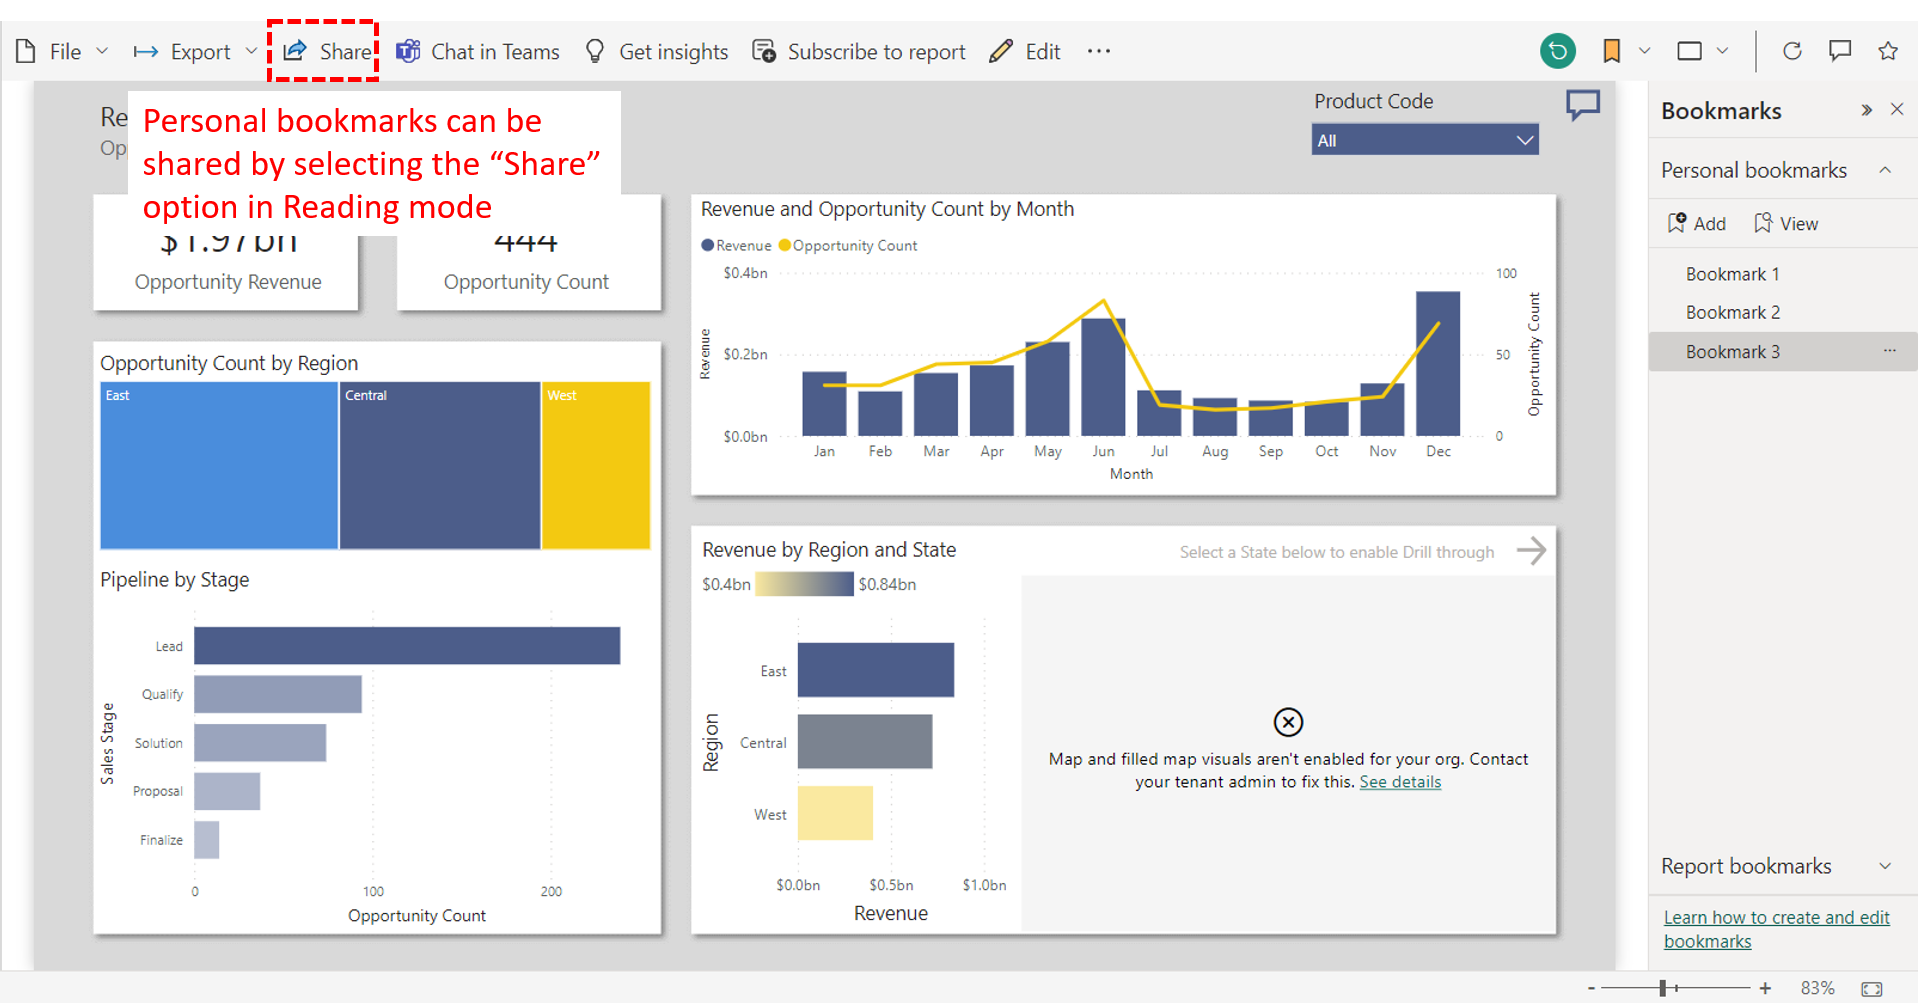
A handy Power BI feature is the ability to share the personal bookmarks you’ve created with others. To do so, follow the steps below:

- With the desired personal bookmark activated, select “Share” from the top toolbar.
- Choose to include your changes in the share dialog.
- Recipients with access will see your personalized view.
Navigating Power BI Bookmarks
You can use bookmarks to build custom navigation experiences for easily accessing these views.
Some options for bookmark navigation include:
- Bookmark Buttons – Create individual buttons that each link to different bookmarks. This provides one-click access to key report views.
- Bookmark Navigator – Automatically generate a button menu that lists all bookmarks in the report. Lets users access any bookmark from one navigation pane.
- Linking Bookmarks to Visuals – Associate bookmarks with shapes, images, or other visuals that act as navigation when clicked.
- Slideshows – Toggle through a sequence of bookmarks using previous/next arrows to present or step through insights.
1. How to Create Bookmark Buttons
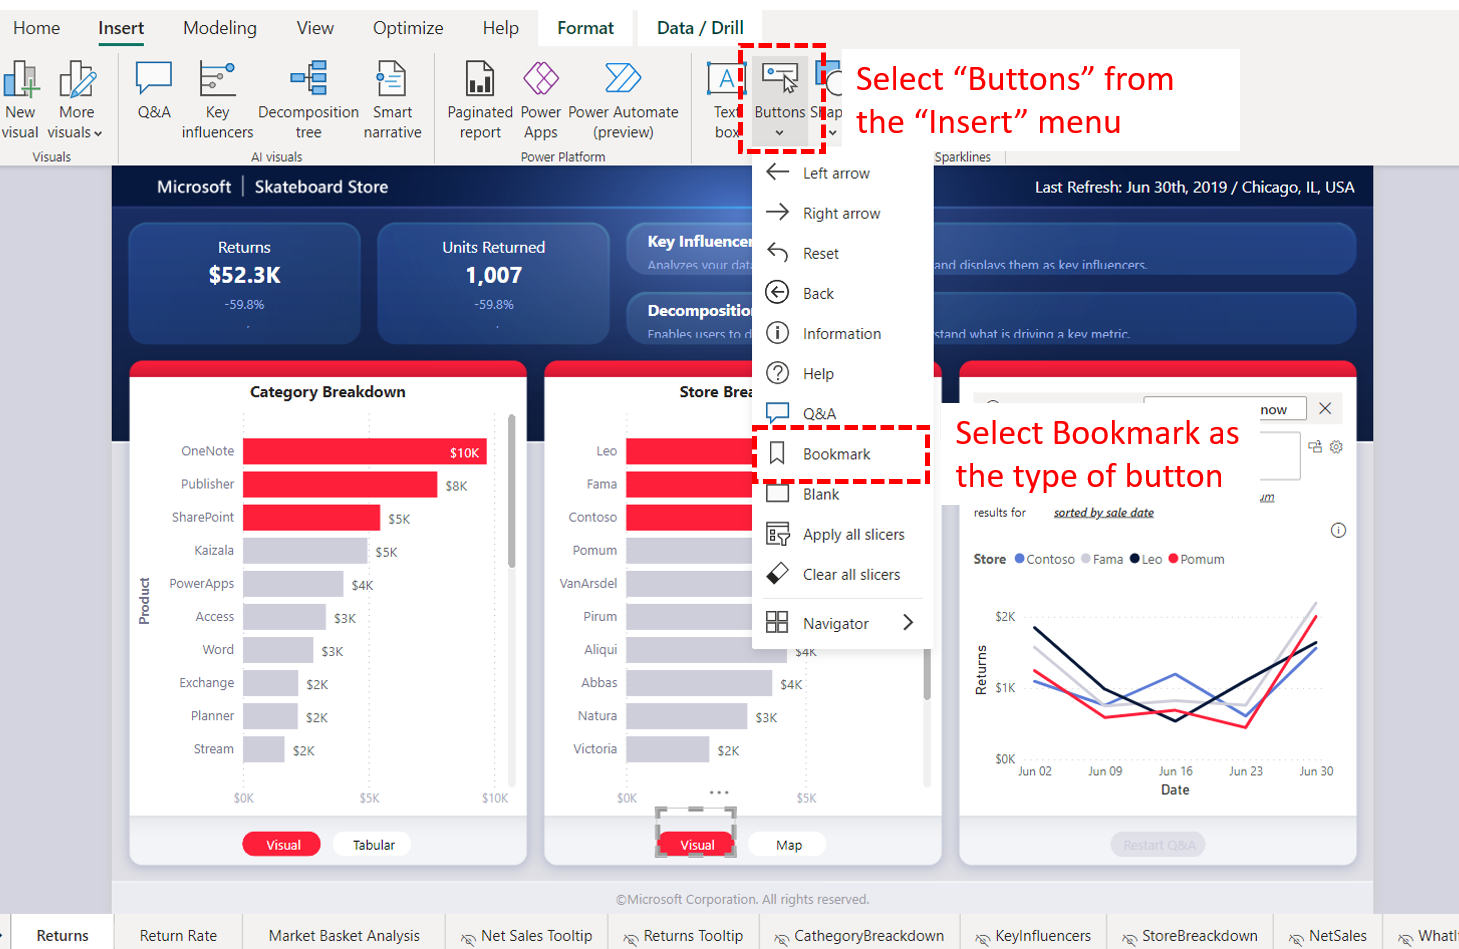
- Design the bookmark views you want to navigate between.
- Insert a button visual and set the action to “Bookmark“.
- Choose which bookmark view to link to.
- Format the button text, colors, etc.
- Repeat to add other bookmark buttons.
2. How to Add a Bookmark Navigator
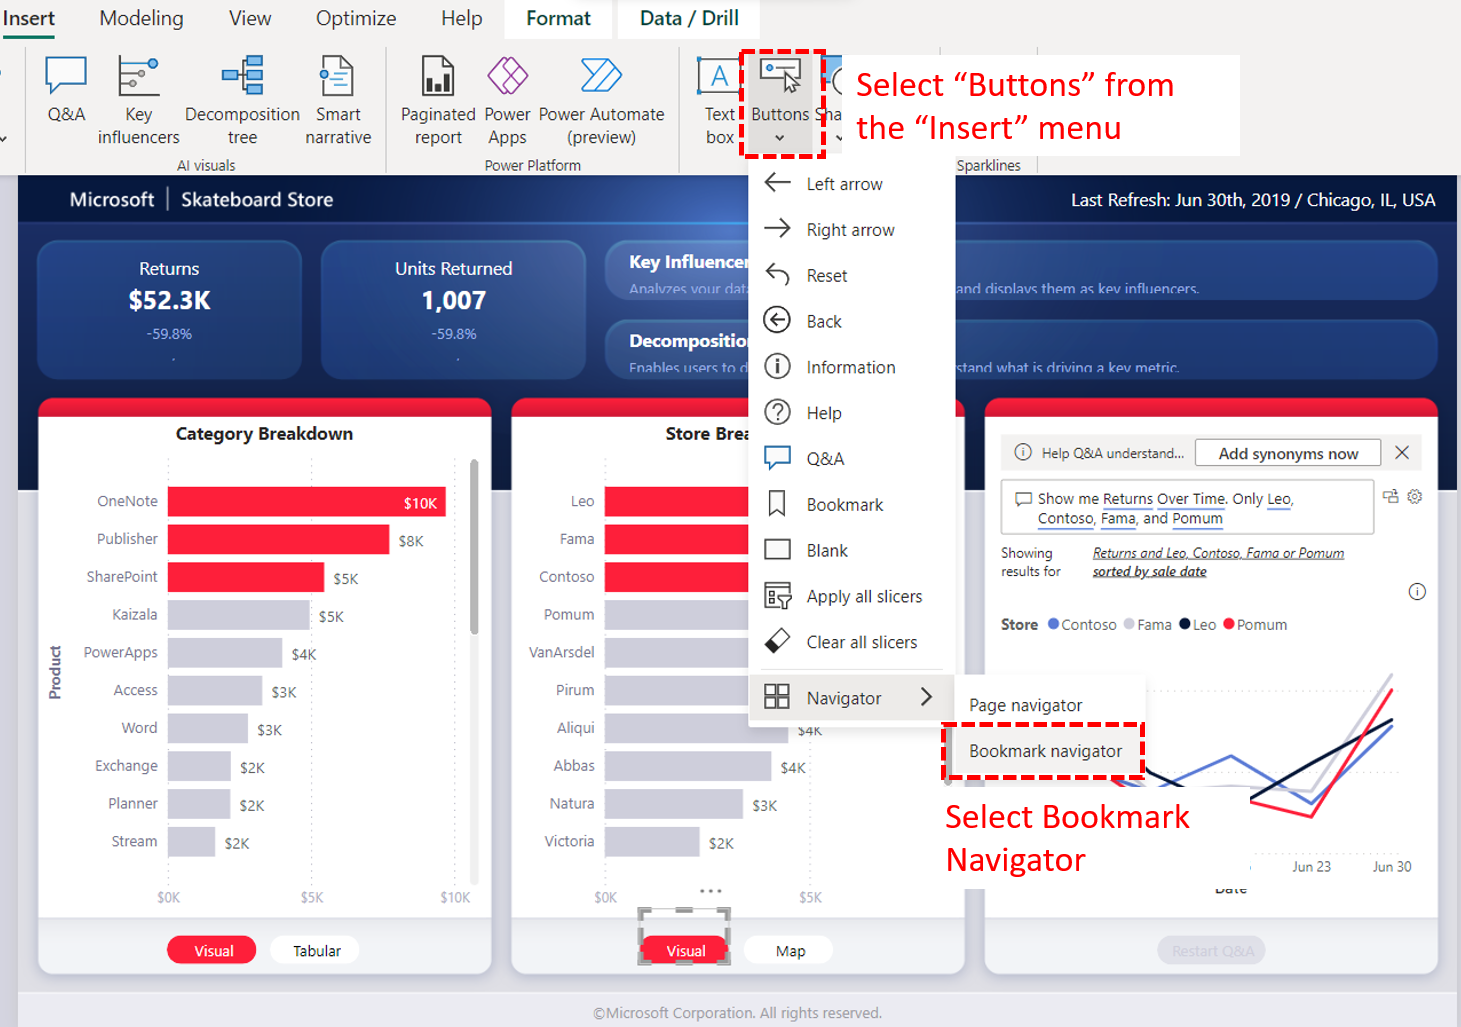
- Create the bookmark views for your report.
- Insert a button visual and set the type to “Bookmark Navigator“.
- The navigator will automatically populate with your bookmarks.
- Format the look and layout of the navigator as needed.
3. How to Run a Bookmark Slideshow
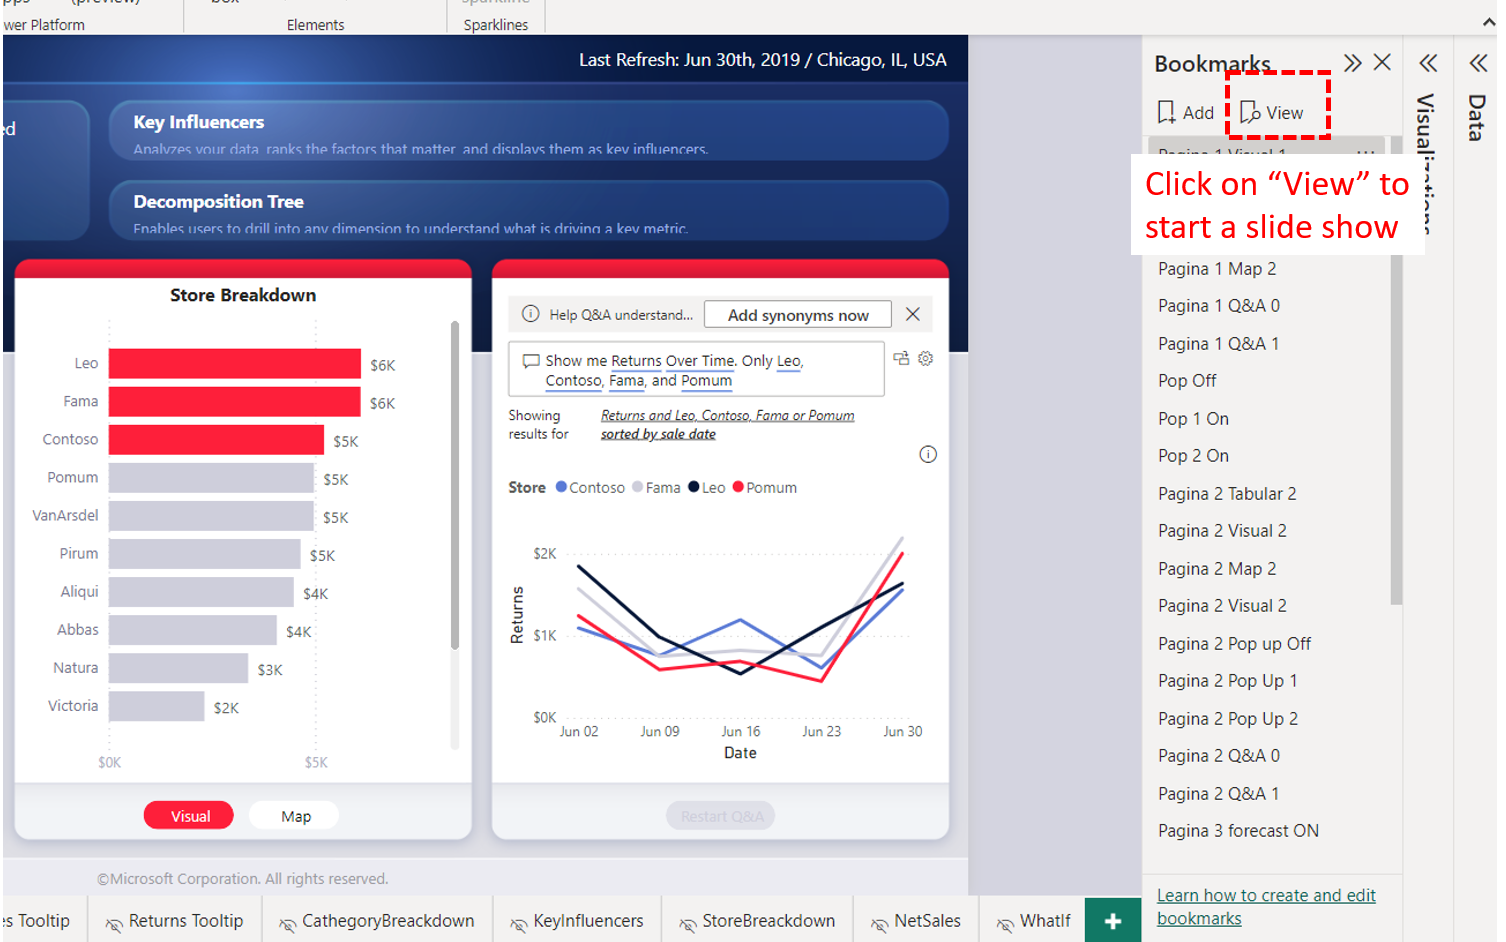
- Arrange bookmarks in the desired sequence.
- Open the Bookmarks pane.
- Select “View” to launch the slideshow.
- Use on-screen arrows to progress through views.
4. Selection Pane and Element Visibility
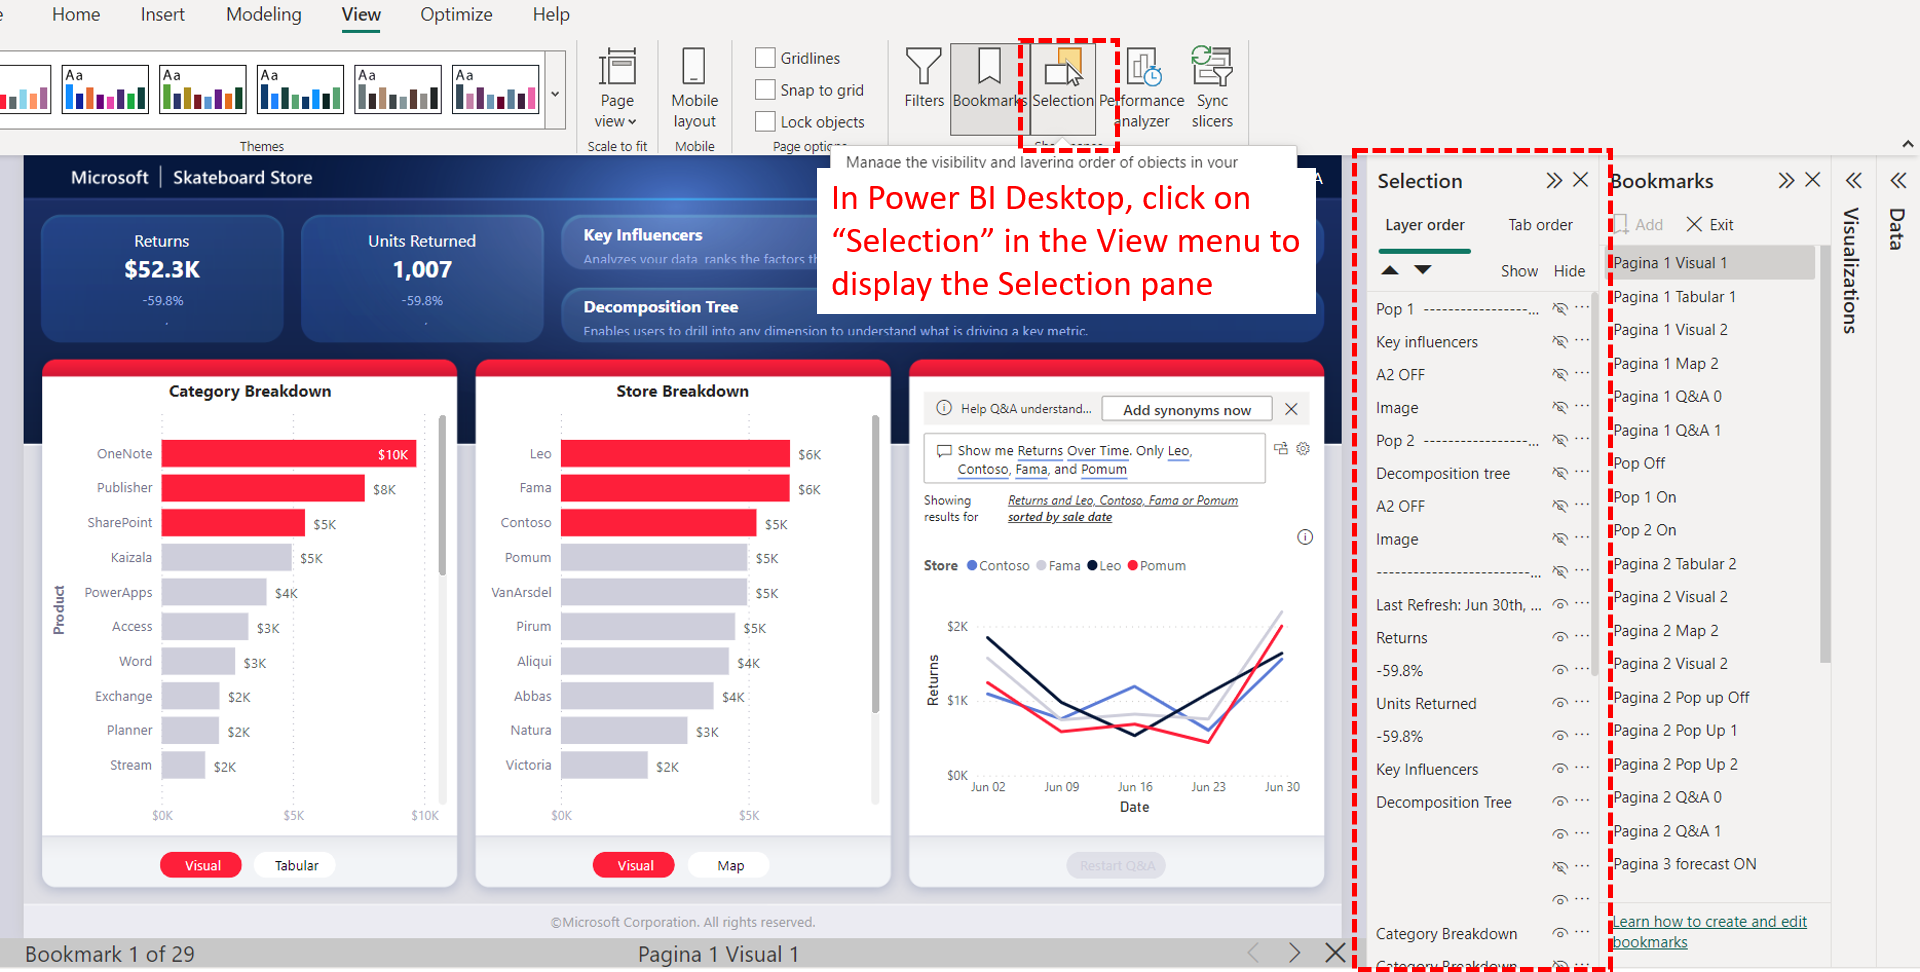
Managing the visibility of visuals is crucial to ensure that only relevant information is displayed to the user. The Selection pane in Power BI provides control over the visibility of visuals on a report page.
This can be used with bookmarks to show/hide objects.
- The Selection pane lists all visuals on the current page.
- Toggling the eye icon, next to a visual, hides or shows it.
- When you create a bookmark, visibility settings are saved.
- Hidden objects remain invisible when the bookmark is restored.
To hide visuals with a bookmark:
- Open the Selection pane and toggle visibility off for objects to hide.
- Create a bookmark to save current visibility settings.
- Hidden objects will remain invisible when applying the bookmark.
- Right-click the bookmark and select “Update” if you modify visibility after creating a bookmark.
Now that you have a handle on the basics, let’s take a look at some advanced features with bookmarks in the next section!
Advanced Bookmark Features in Power BI
Bookmarks in Power BI go beyond basic functionality and provide several advanced features to enhance data exploration, organization, collaboration, and customization.
Let’s look at some of these advanced features:
1. Drill Locations
Drill locations enable users to save the state of visual selection and filters applied to specific visuals, making it easier to navigate through different levels of data. It lets you navigate deeper levels of data from top aggregated views.
- When you apply a drill or expand action on a visual, you are moving down the hierarchy to more granular data.
- Bookmarks can save the current drill state of visuals when created.
- This allows users to return to that precise drill level by selecting the bookmark later.
To capture drill locations in a bookmark:
1. Drill down into visuals to reach the level of detail you want to capture.
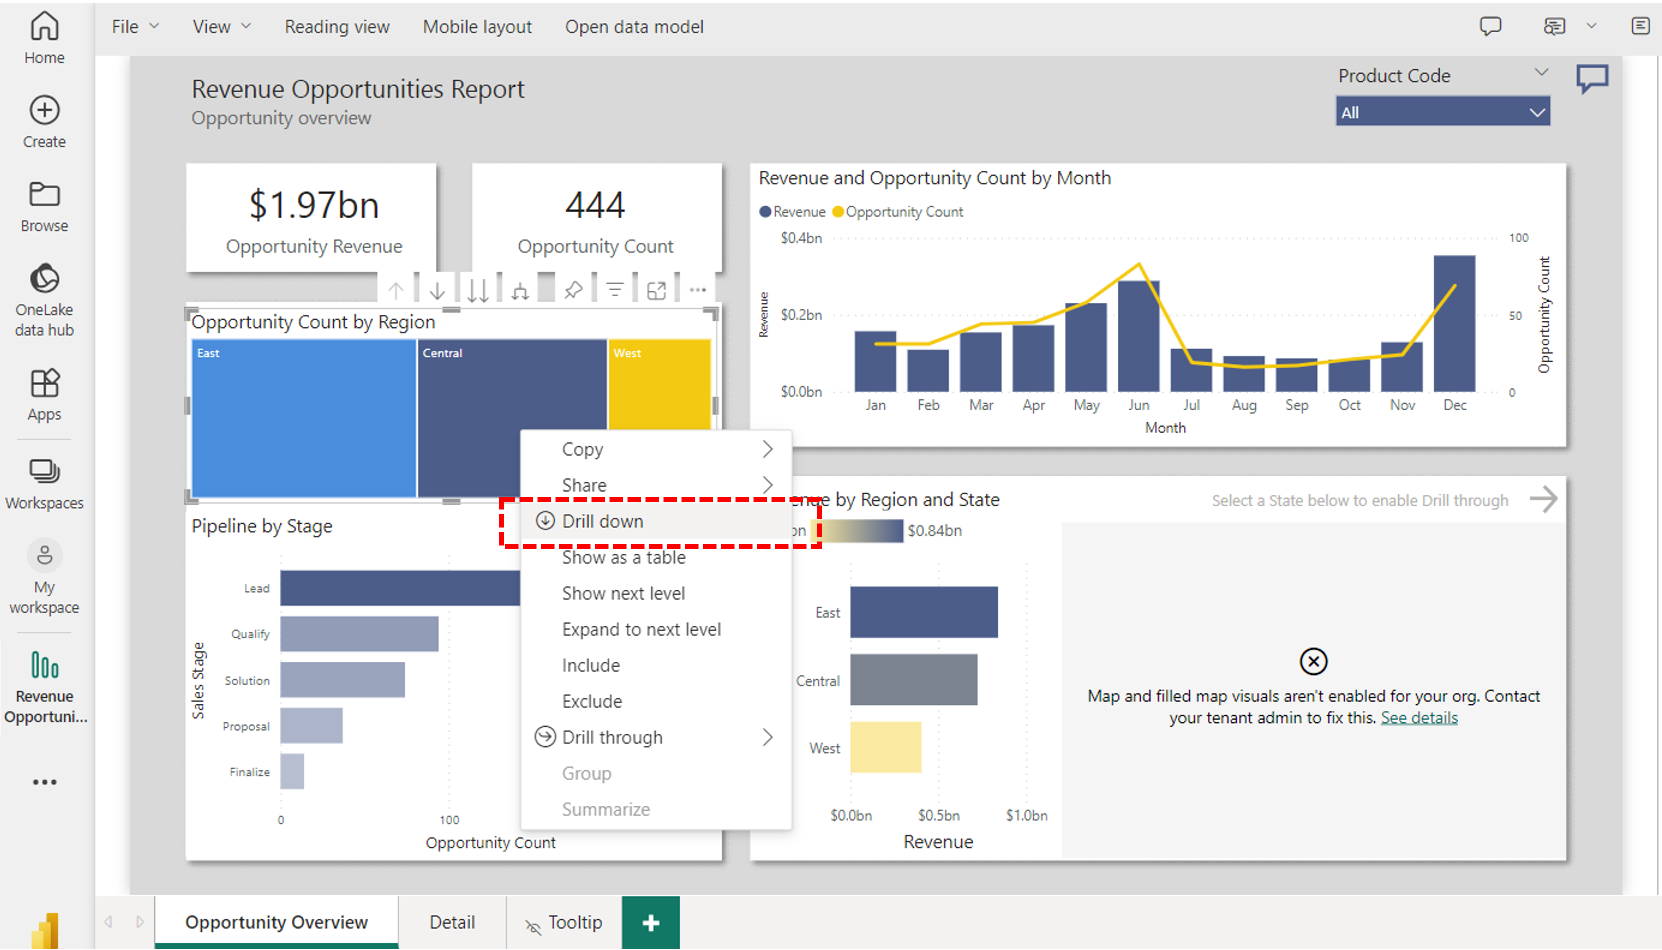
2. When creating the bookmark, click the ellipsis and select “Data“.
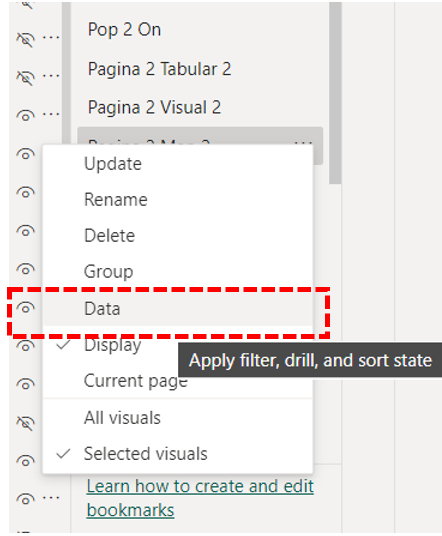
3. Now when users apply this bookmark, any visuals will return to the drill location saved.
2. Bookmark APIs for Embedded Reports
Power BI’s bookmark features extend to embedded reports as well. Developers can utilize Bookmark APIs to integrate bookmark functionality within an embedded report.
This allows for enhanced control and customization, including the ability to manage filters, visual selection state, and drill location when interacting with an embedded report. Having bookmark APIs integrated ensures a seamless browsing experience and improved data analysis capabilities for users.
With these advanced features under your belt, let’s look at how you can optimize and troubleshoot your bookmarks in the next section.
Optimizing and Troubleshooting Power BI Bookmarks
Properly optimizing and troubleshooting your use of bookmarks can help you maximize their capabilities and avoid common issues when working in Power BI.
1. Sorting and Renaming Bookmarks
To easily locate and identify bookmarks, sort them in a logical order and use clear, concise names. Rename bookmarks by selecting the ellipsis (three dots) next to the bookmark and choosing Rename. Assign meaningful, friendly names to improve bookmark readability and organization.
2. Saving and Restoring Default Views
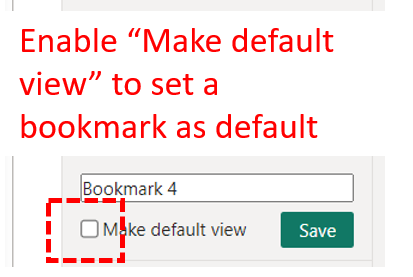
You can save a default view for your report, which is the initial view users see when opening it. To set a default, configure the desired filters, visuals, and settings.
Create a bookmark and select Make default view from its options to set it as default. To restore the default view anytime, open the Bookmarks pane and select Restore to default view.

3. Additional Resources and Best Practices
- Use the Selection Pane to manage visual visibility across your report. This enables you to create dynamic bookmarks that accurately capture selections when applied.
- Group related bookmarks together for better organization and access, like arranging them into a slideshow.
- Limit the number of bookmarks per visual to maintain optimal performance and avoid excessive progress-related bookmarks.
- Periodically test bookmarks to ensure they lead to insights and accurately represent selected visuals.
4. Best Practices
- Always rename visuals in the Selection Pane to increase readability when working with bookmarks and prevent errors.
- When creating a bookmark, verify appropriate visuals and objects are selected or control visibility in the Selection Pane.
- Be mindful of bookmark measures that may lead to incorrect or misleading results when switching bookmarks.
- Evaluate bookmark necessity carefully and remove unnecessary or outdated ones to maintain an organized workspace.
So, how can you use Power BI bookmarks?
Using Bookmarks in Power BI Reports
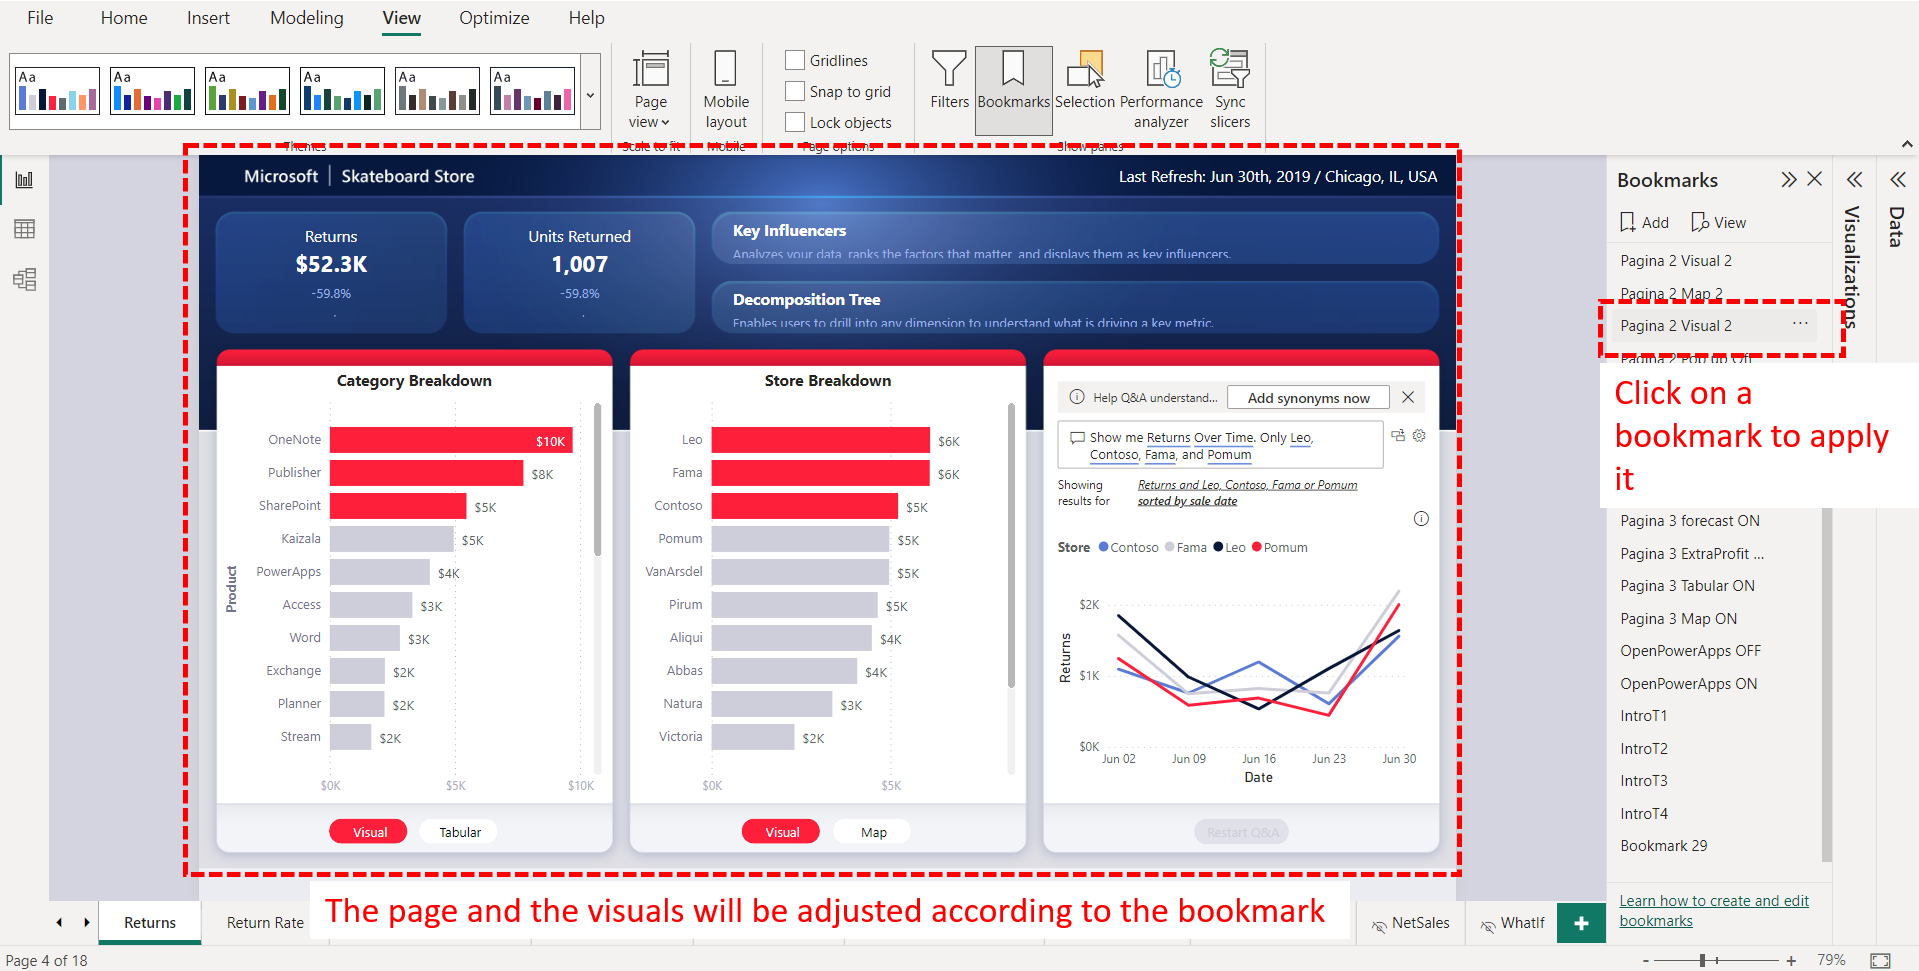
The simplest way to use bookmarks is to apply them. To view a bookmark:
- Open the Bookmarks pane in Power BI Desktop or Service.
- Select the name of the bookmark you want to apply.
- The report page updates to the state saved in that bookmark.
Bookmarks can be used for a variety of use cases, including:
- Navigating Reports: Bookmarks provide an easy way to quickly navigate to different views or pages within a report. Users can select bookmarks from the Bookmarks pane to immediately switch between key report views. Bookmarks can be organized in sequential order to “tell a story” and walk users through the report’s insights.
- Focusing Insights: Bookmarks let you highlight key insights by saving slicer filters, visual details, etc. that emphasize specific findings. When users select a bookmark, it restores all filters/settings that focus on the related insight. Effective bookmark titles help users understand the insight captured by each bookmark.
- Collaboration: Report bookmarks enable collaboration by sharing useful views with colleagues accessing the report. Also, commenting on reports with an active personal bookmark shares that personalized view with others.
- Presentations: Bookmarks facilitate presentations by allowing presenters to quickly switch between key report views. Bookmarks save presenters from needing to rebuild views on the fly during a presentation.
- Tracking Progress: During report creation, authors can use bookmarks to save work-in-progress views. Later, bookmarks provide a helpful way to revisit those views and track progress.
Final Thoughts
Mastering the art of bookmarks is key to unlocking the full potential of Power BI and enhancing data exploration. In this guide, you’ve learned the fundamentals of utilizing bookmarks to save custom views and simplify report navigation.
By following the steps to create, manage, and apply bookmarks, you can now build intuitive experiences for report consumers. Advanced features like drill locations and the Selection pane provide greater flexibility in capturing granular insights.
While it takes practice to optimize bookmarks, the payoff is streamlined collaboration, impactful storytelling, and simplified data analysis. So go ahead and put your new bookmark skills to work in real-world scenarios. You are ready to become a bookmark expert to take your Power BI reports to the next level!
And, if you are looking to take a deeper dive into Power BI, check out our complete beginner’s guide that covers all the basics:
Frequently Asked Questions
Let’s answer some frequently asked questions that you might have when you start yo use bookmarks in Power BI:
1. What are the differences between personal and report bookmarks?
In the Power BI Service, personal bookmarks are created by individual users and are available only to them. These bookmarks allow users to save their preferred views and states of a report for their use.
Report bookmarks, on the other hand, are created by the report authors and are available to anyone who has access to the report.
2. How to use selection pane alongside bookmarks?
The Selection pane is a helpful tool to control the visibility of visual elements in a report. Here’s how to use it with bookmarks:
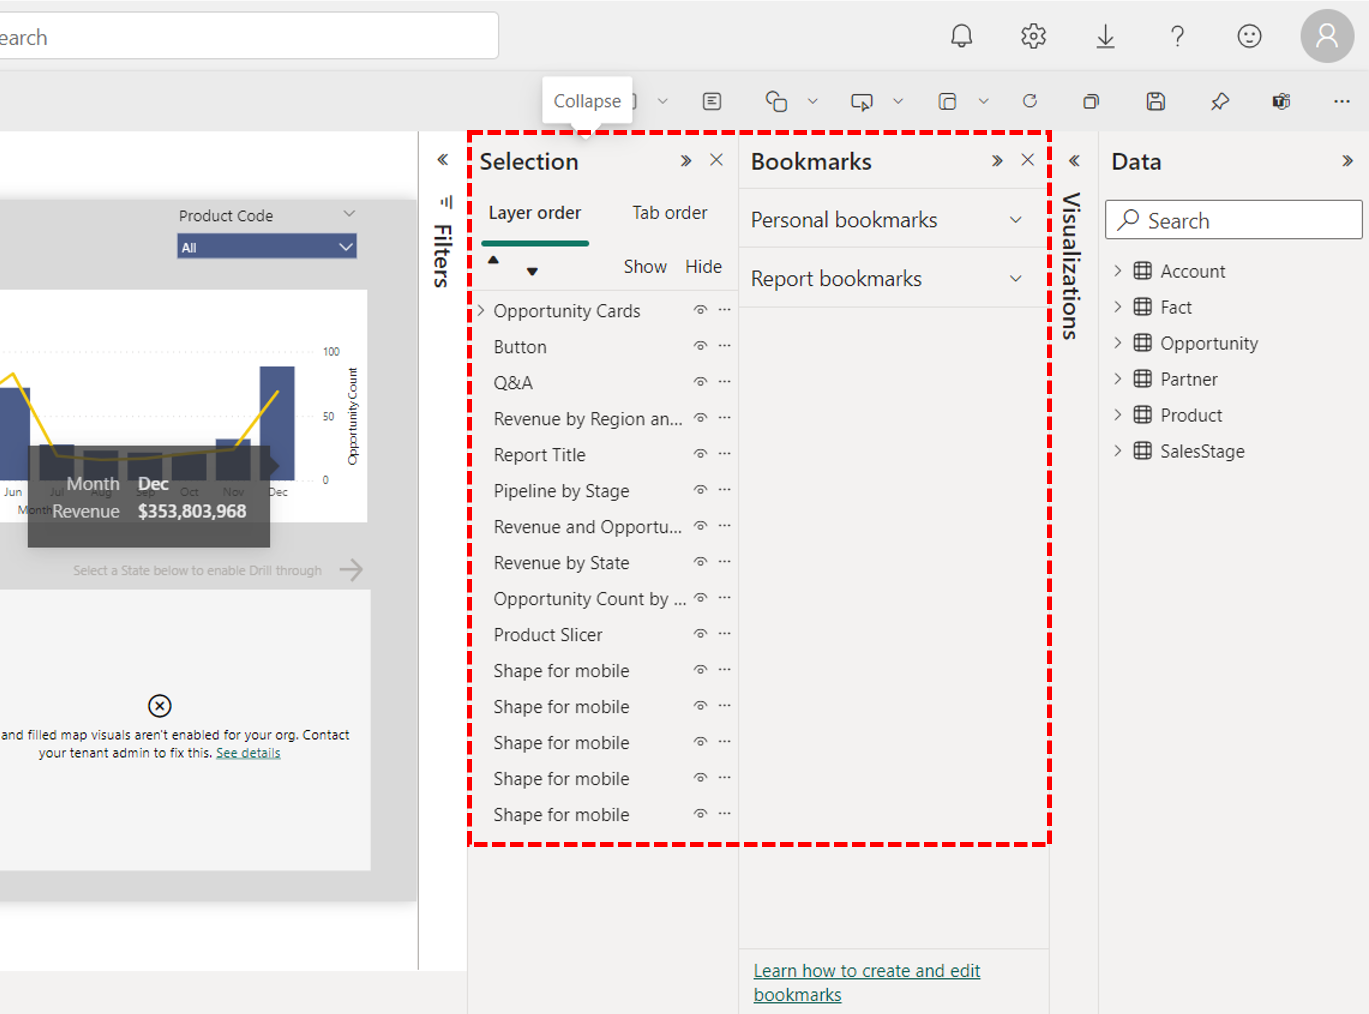
- Open the report and click on the View tab.
- Select both the Bookmarks pane and the Selection pane.
- Arrange and set the visibility of the visual elements in the report using the Selection pane.
- Create a bookmark to save the state of the report, including the visibility settings.
3. What is the difference between all visuals and selected visuals in bookmarks?
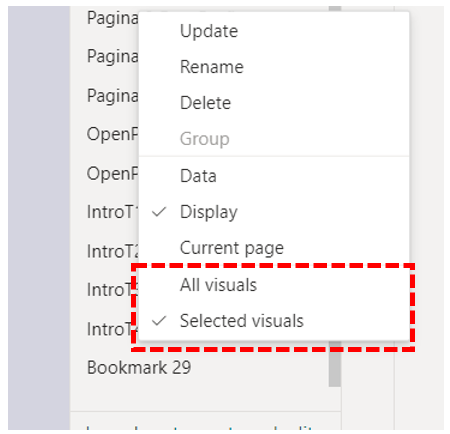
When creating a bookmark, you can choose between two options:
- All Visuals
- Selected Visuals
All Visuals saves the state of all visuals in the report, while Selected Visuals saves the state of only the visuals you have selected. Selected Visuals can be useful to focus on specific parts of the report or create different views featuring just a few visuals.


