In today’s data-centric world, effective data analysis and visualization are crucial for individuals and business users to succeed. Microsoft Power BI offers superior tools, interactive visualizations, and unmatched business intelligence capabilities, but can things get better?
Welcome to Chat GPT. You can now use Chat GPT for Power BI to ask questions about your dataset, write formulas for complex calculations and request steps for implementing a particular functionality.
This is a game-changer, let’s dive into it.

Power BI has a variety of features that can take time to learn. If you’re new or unfamiliar with certain aspects, using Chat GPT’s guidance can help you make the most of Power BI, quite quickly.
Chat GPT has been trained on massive datasets and allows you to ask questions in natural language, receiving detailed and useful responses. By combining ChatGPT with the data visualization power of Microsoft Power BI, you can unlock a wealth of opportunities for generating insights and boosting your organization’s decision-making process at scale.
Now that you understand the importance of using Chat GPT alongside Power BI, let’s take a look at the main areas where Chat GPT can help you improve your data analysis and visualization capabilities.
How is ChatGPT Useful with Power BI Desktop?
ChatGPT is a natural language model which means that you can ask it any questions you would like an answer to, well just about.
We will use this feature of Chat GPT to our advantage and make it come with some complex formulas that we can use in Power BI for new analyses or improve the existing ones.
ChatGPT can help you in the following 4 ways.
Data Preparation
Data Transformation
Data Analysis
Data Visualization
In the sections below, we will look at each step of the data analysis cycle and focus specifically on how it can improve your speed and efficiency in creating a killer Power BI report.

How to use ChatGPT with Power BI Report for Data Preparation and Transformation
Data Preparation and Transformation refer to the process of cleaning, organizing, and converting raw data into a structured and usable format, suitable for further analysis, modeling, or visualization.
They are crucial steps in any data analysis cycle and can take time, often a considerable amount. ChatGPT can help you with cleaning and transforming data in Power Query, and write custom code calculations for creating solid data flows too.
So, restart power bi desktop, and let’s get into it.
How to use ChatGPT with Power Query
In Power BI, Power Query is a powerful tool for data transformation. It allows you to connect to various data sources, apply filters, and perform numerous formatting tasks.
To demonstrate how to use ChatGPT for Power Query formulas and code, we will use a dataset to look at specific examples to give you a more solid grounding on making your next transformation.
To follow this tutorial, go ahead and open Power BI Desktop. On the main screen, click on load sample data source to load the built-in Power BI dataset. We will be using this dataset throughout the article.
Once the data is loaded, you should see the following dataset in your Power BI’s Data View.
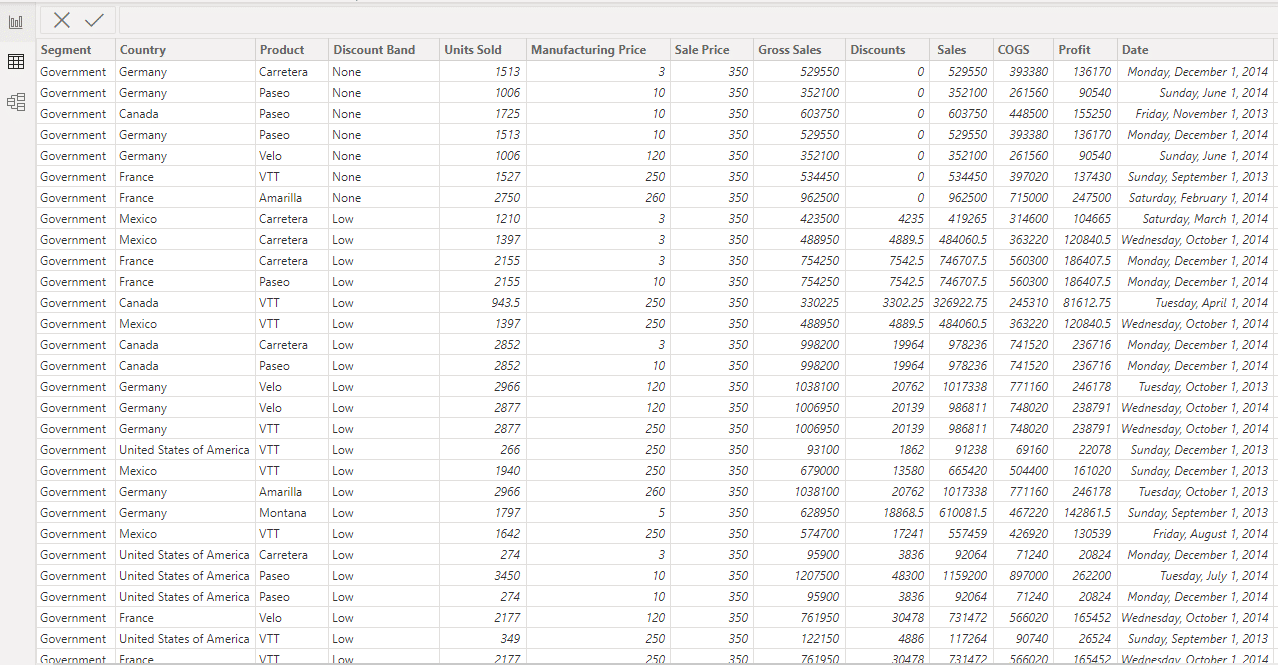
On Power BI Desktop main screen, click Transform Data to enter the Power Query Editor.
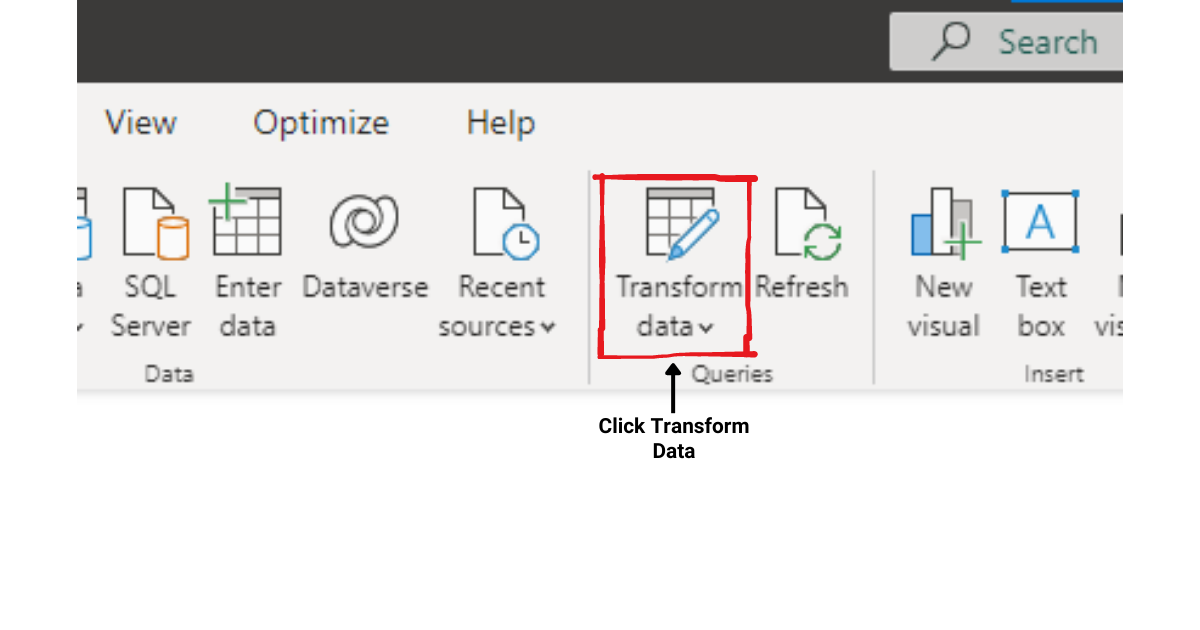
In Power Query Editor, you will see the dataset you are analyzing.
how to Apply a Filter
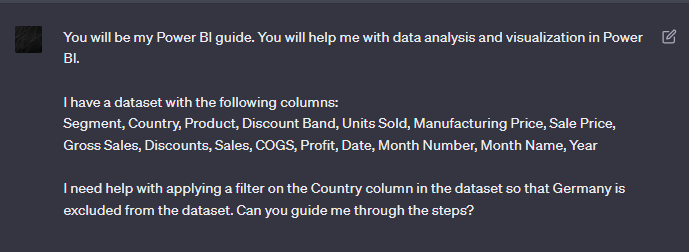
Let’s say we want to apply a filter on the Country column in the dataset. If you’ve never worked with filters in Power BI Desktop before, you can ask ChatGPT, and it will guide you every step of the way.
I entered the following prompt into ChatGPT when I was applying a filter on the Country column.
Ok, I know, I wasn’t so polite, but I wanted to get straight to the point.
ChatGPT gave generated the following detailed list of steps to follow:
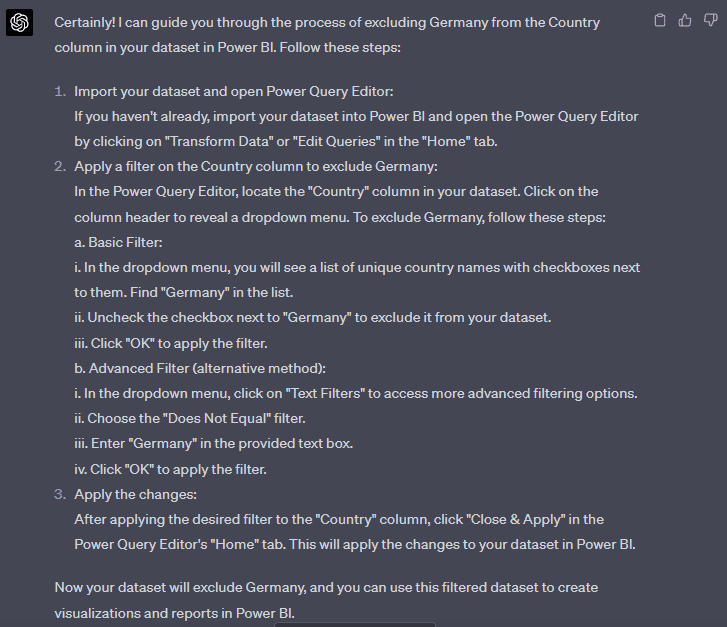
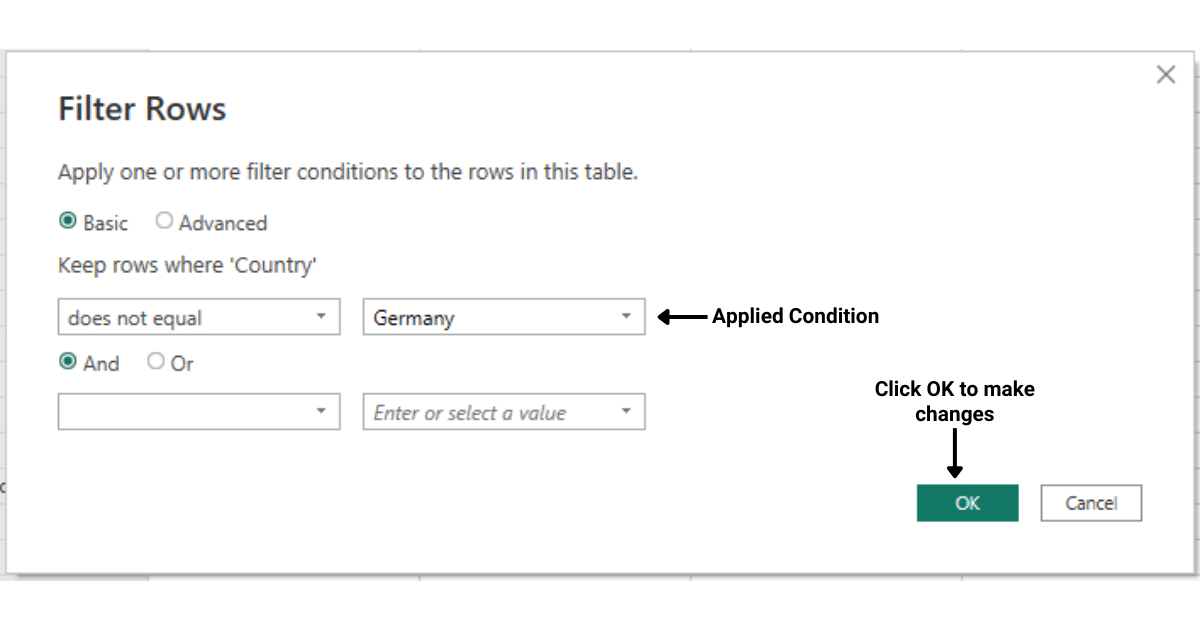
Let’s follow each of these steps and see if we can apply a filter on the Country column.
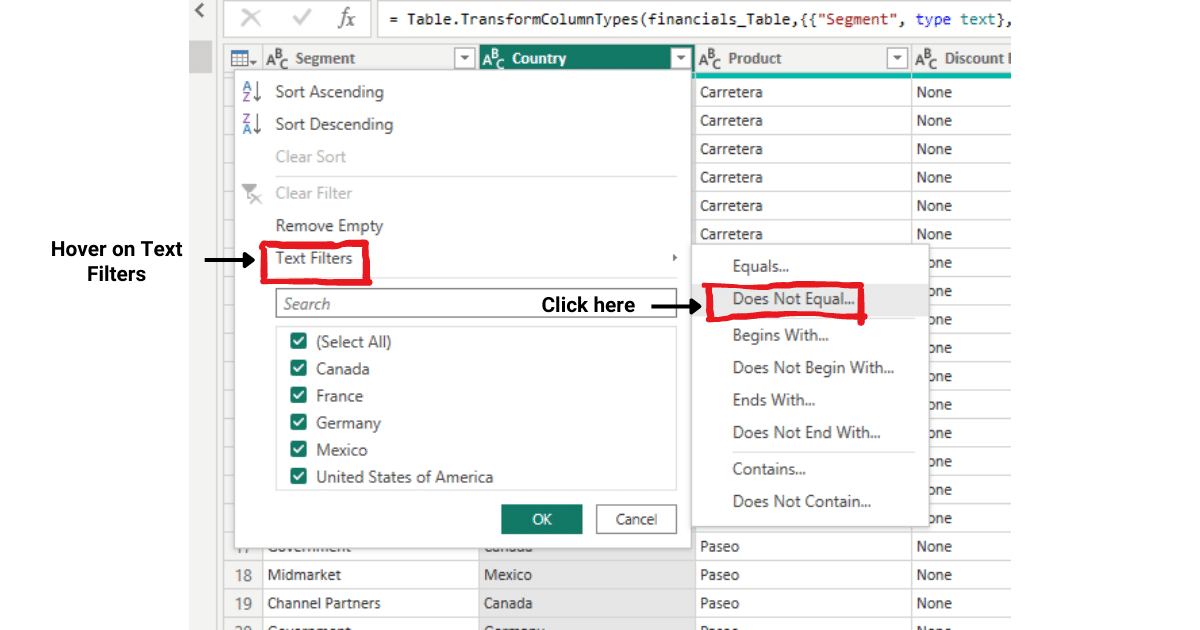
After following the steps given by ChatGPT, I was able to remove rows that had Germany in the Country column.
Making Transformations
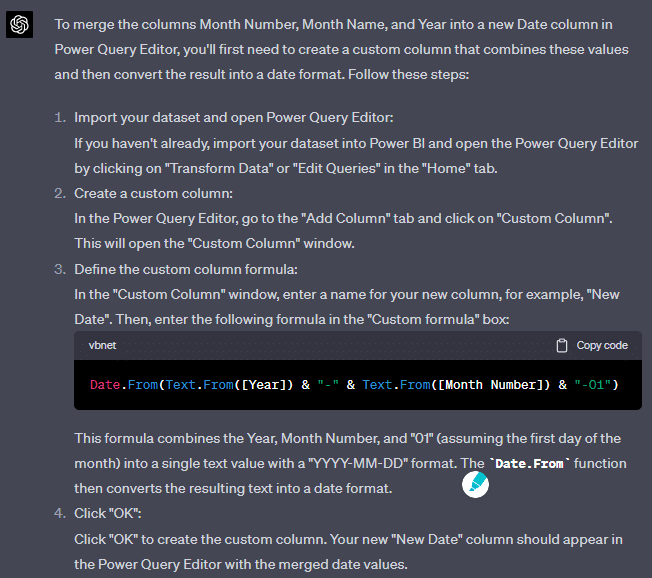
Suppose we want to combine the columns Month Number, Month Name, and Year into a single Date column.
The following prompt was used to generate a step-by-step response using ChatGPT to replicate in Power BI Desktop:

The following guide was suggested by ChatGPT for merging the columns.
With the steps suggested in the guide, the columns were successfully merged to create a new column named New Date.
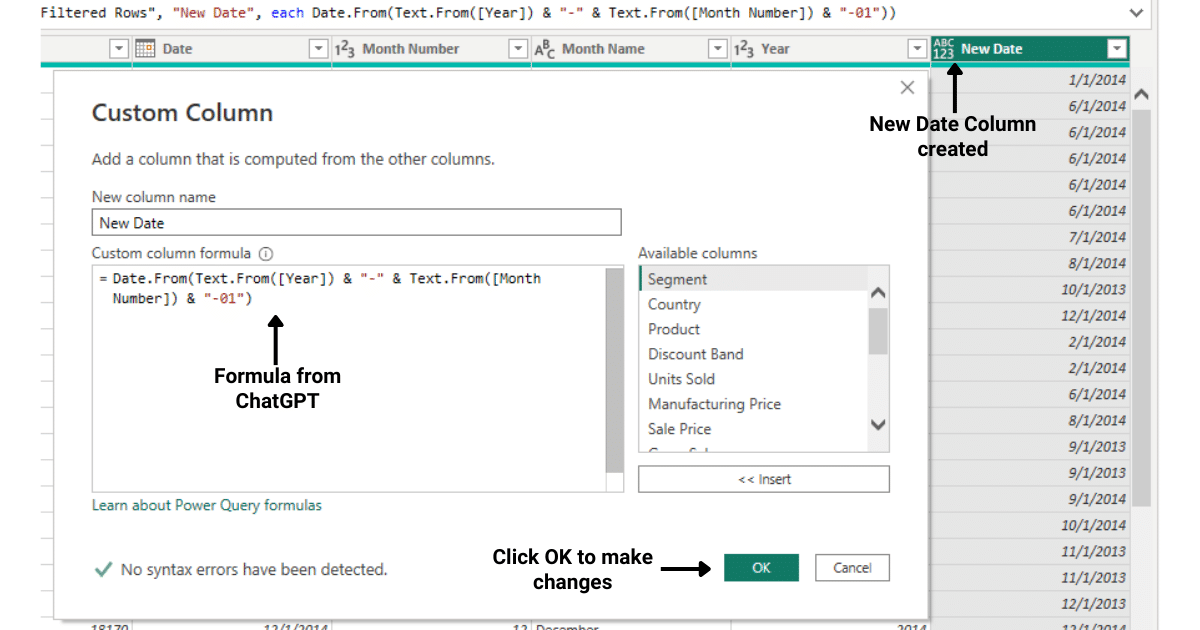
The above two demonstrations should give you an understanding of how to use ChatGPT to make more efficient data preparation and transformation.
In the section below, we will look at how to use ChatGPT to generate formulas and calculations for your Power BI reports.
Let’s get into it!
How to use ChatGPT for DAX Queries
DAX (Data Analysis Expressions) is a formula language used to create custom calculations and aggregations in Power BI. By leveraging DAX, you can create complex measures and calculated columns for your data model.
For a demonstration of using ChatGPT for DAX code, we will use the same dataset as used in the above section.
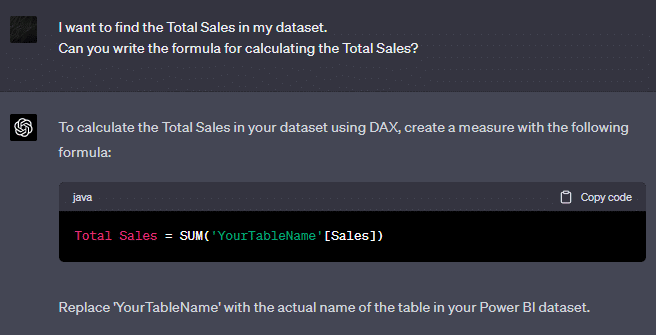
Example 1: Finding Total Sales
I asked ChatGPT to help me write code for finding the total sales. The following is the text prompt and the output given by ChatGPT:
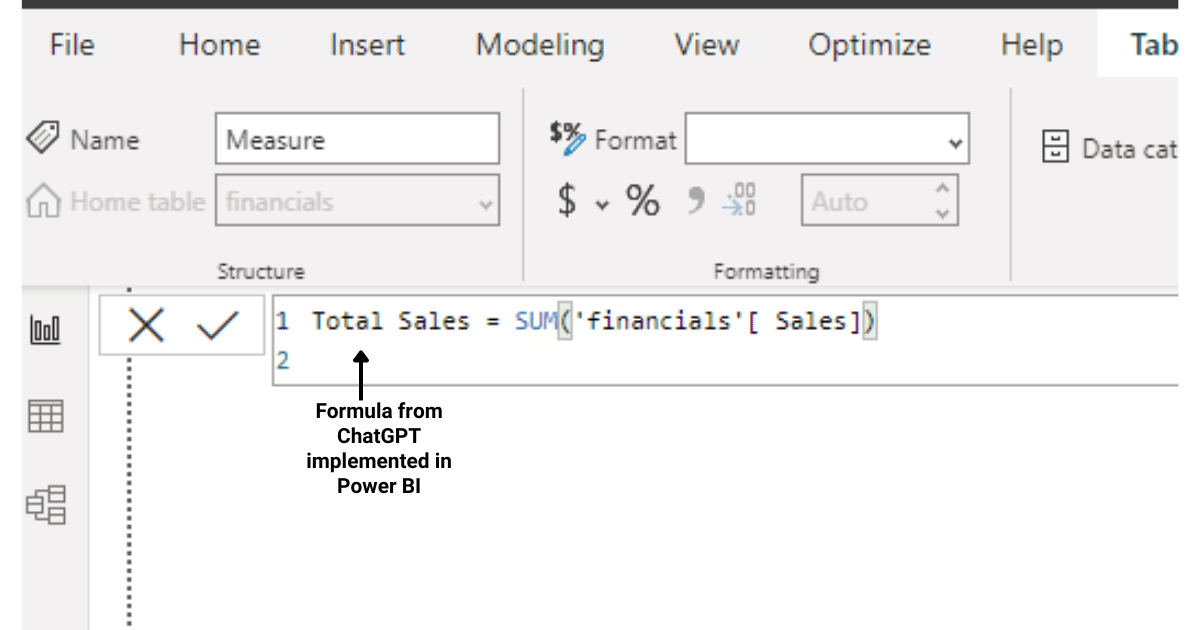
Once you get the code, you can go ahead and implement it in Power BI.
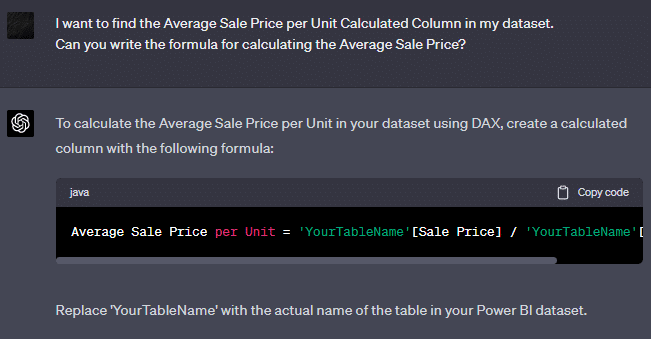
Example 2: Finding Average Sales Price
I asked ChatGPT to help me write the code for finding the Average Sales Price per Unit. The following is the text prompt and output given by ChatGPT:
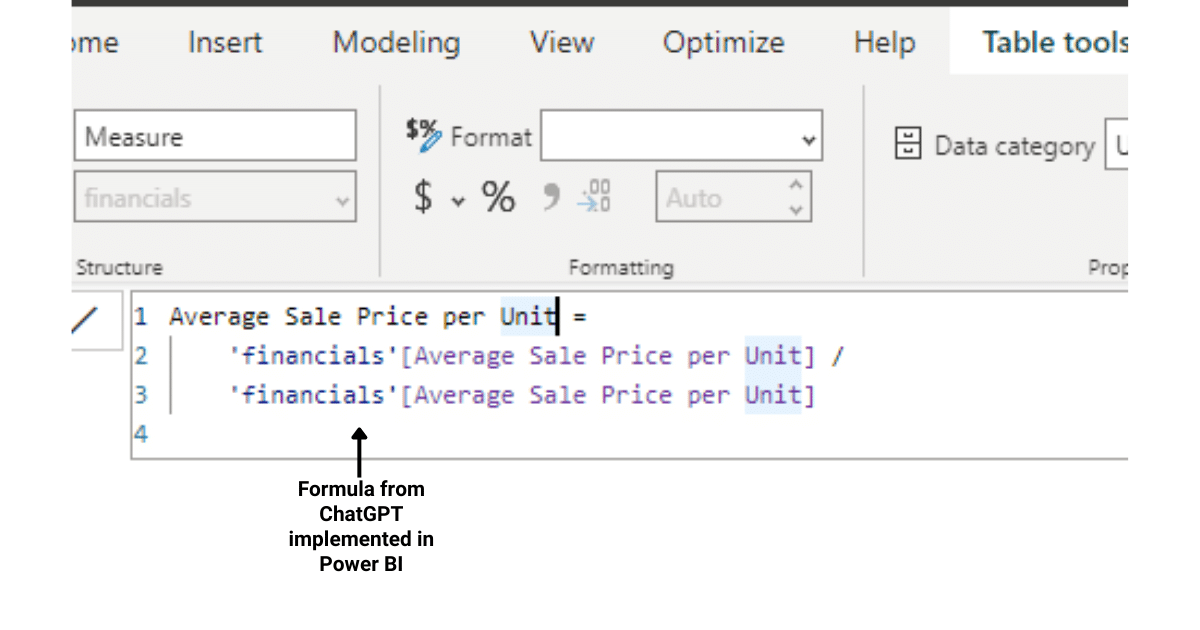
Once you get the formula, you can go ahead and implement it in Power BI.
The above demonstrations are to highlight the amount of help you can get from ChatGPT when working on a Power BI project. You can ask ChatGPT to write the most complex formulas for you and it will return with a template formula that you can change according to the variables in the dataset. For instance, take a look at the formulas generated by ChatGPT below:

You can also ask ChatGPT to build upon the previous formulas for more advanced calculations.
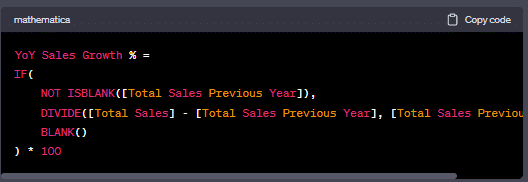
The above formula is a continuation of the previously generated formula which helps you to make more advanced calculations in Power BI.
In short, you can ask ChatGPT to help with the following in DAX:
Creating calculated columns
Defining measures
Implementing time-intelligence functions
We’ve looked at how ChatGPT can be helpful in writing complex formulas. In the section below, we will look at how to enhance your data visualization and report-building capabilities with ChatGPT.
Ready to Learn ChatGPT Tips, Tricks & Hacks?
Join 43,428+ others on our exclusive ChatGPT mailing list; enter your details below.
[wpforms id=”211279″]
How to use ChatGPT for Data Visualization and Analysis
A crucial stage in any data analysis project is to present your findings to relevant stakeholders. Power BI offers a strong set of tools that allows you to make appealing visuals and create summaries of your work.
Following are some of the ways where you can consult ChatGPT for making visualization and reports:
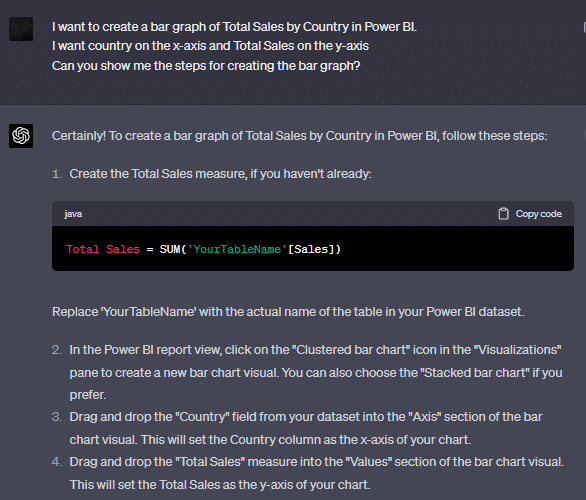
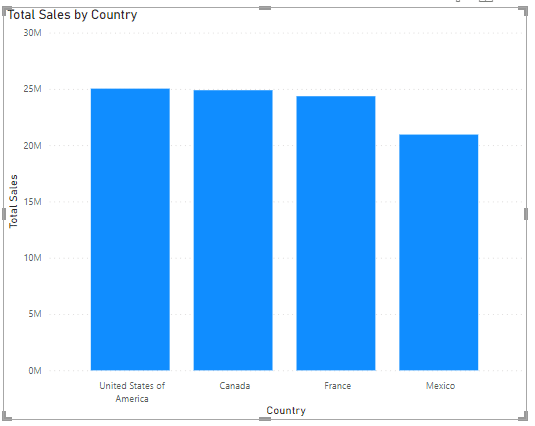
Example 1: Create a Bar Graph of Total Sales by Country
Suppose I want to find the total sales by country. I asked ChatGPT for the directions and the following response was generated:
After following the guide from ChatGPT, I was able to create the following bar graph in Power BI:
Keen to use see how we are integrating Chat GPT with Microsoft Outlook using Power Query? Check out our vid below:
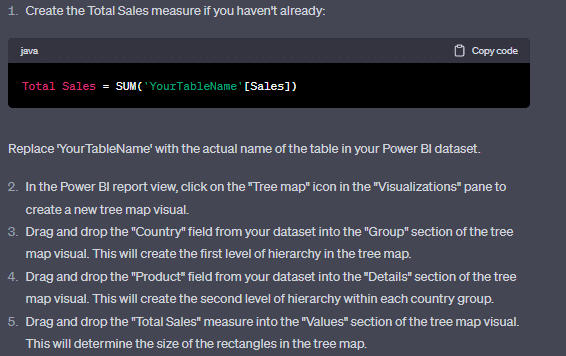
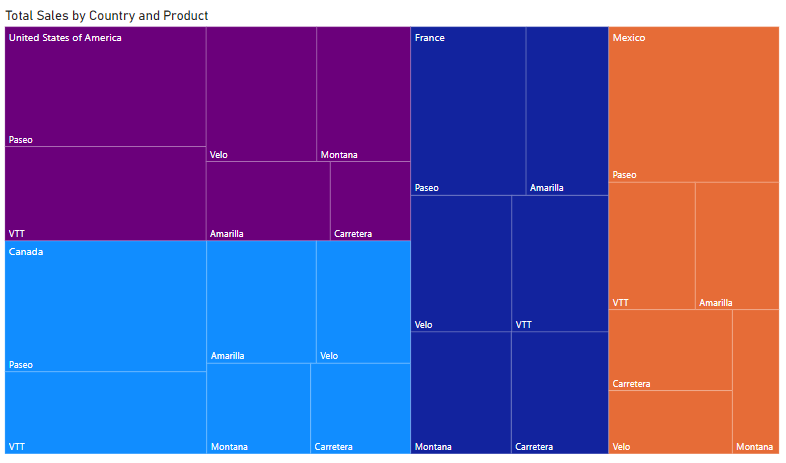
Example 2: Create a Tree Map to show Total Sales by Country and Product
Suppose I want to find create a tree map of total sales by country and product. I used the following prompt to ask ChatGPT for directions:

ChatGPT generated the following step-by-step guide for creating a TreeMap:
With the steps provided by ChatGPT, I was able to create the following treemap:
The above examples should give you a good starting point for using ChatGPT with analyzing and visualizing data in Power BI.
You can also use ChatGPT for recommendations and directions about your data. In the section below, we will look at how you can use ChatGPT to ask for a recommendation and direction for your analyses.
How to Use ChatGPT for Insights and Recommendations
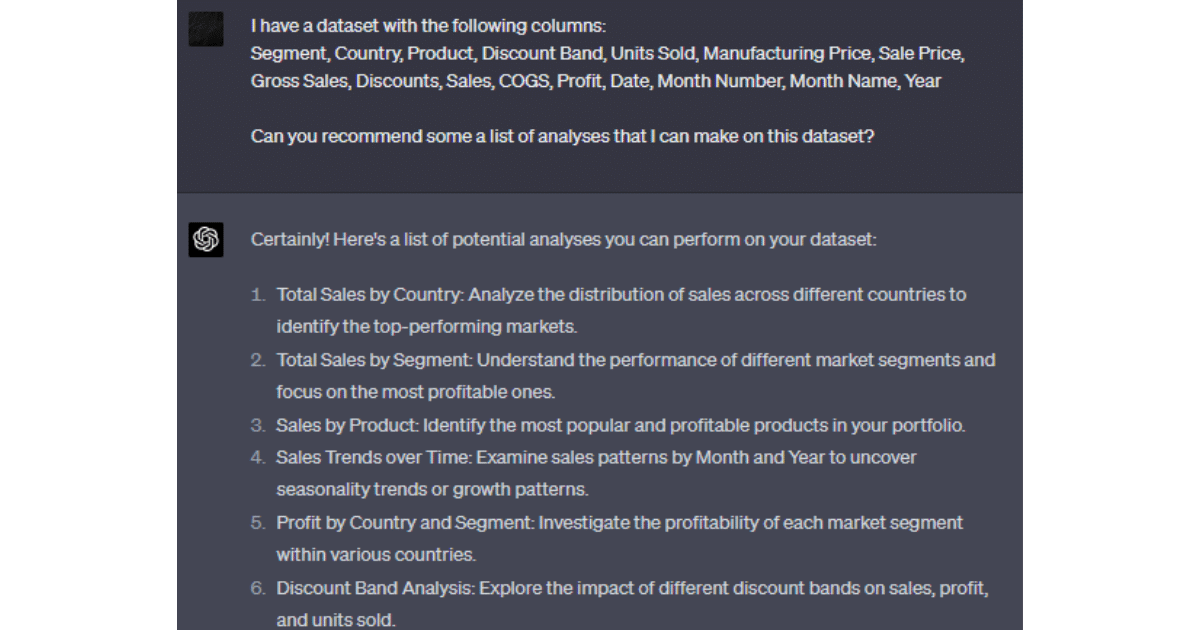
When using ChatGPT with Power BI, it can suggest a variety of data analyses and visualizations based on the column names provided.
By understanding the context and the nature of the data, ChatGPT can recommend numerous potential insights and data exploration paths that users can follow to gain a deeper understanding of their dataset.
This functionality allows users to unlock the hidden value within their data by suggesting multiple analytical approaches tailored to the specific dataset.
For example, given a dataset with columns such as Segment, Country, Product, Units Sold, and Sales, ChatGPT can recommend analyses like calculating Total Sales by Country or Segment, identifying the most popular Products by Units Sold, or exploring Sales trends over time.
Users can also receive suggestions for suitable visualizations, such as bar graphs, pie charts, or line charts, to represent the extracted insights effectively.
Suppose I want a list of possible analyses on my dataset. After asking ChatGPT, it recommended the following list of analyses:
Our Final Word (For Now)
Power BI combined with ChatGPT presents an immense opportunity for data visualization and analysis.
By utilizing its diverse capabilities, you can harness the true potential of your data and make informed decisions that drive your business forward. BUT… and this is a big but…
Chat GPT, although proving to be really helpful, should not be fully relied upon. Sure, embrace the technology (we are) but always learn, practice, and build your skills alongside it too!


