When it comes to data storytelling, there are three important factors to consider to make sure that our report tells the right story — the user, the context, and the solution. These factors are critical because they describe the purpose of each report.
In a previous tutorial, we described data storytelling as the process of transmitting information to a given audience. With effective storytelling, we can get the engagement we’re looking for from end users.

How do we make our data stories more effective? We just need to ask the right questions so that we know what approach to use as we develop our reports.
Effective Data Storytelling By Understanding The User
The first question we should always ask is, “Who is the audience?”
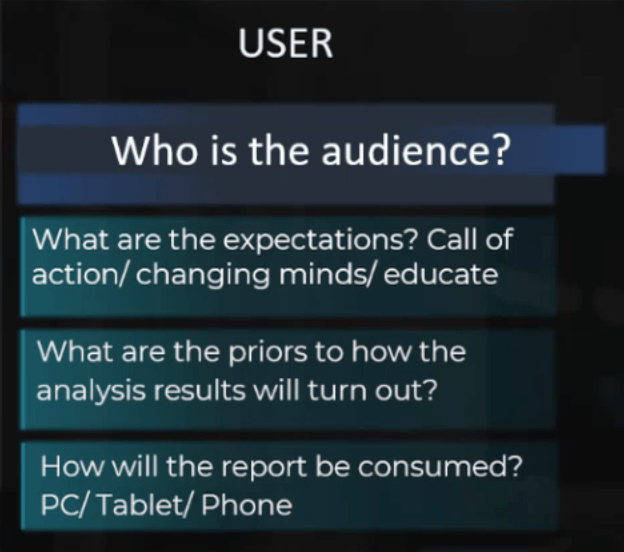
Failing to identify the end user means that we’re putting together a report without really knowing what elements our report needs. An old quote says, “If one does not know to which port one is sailing, no wind is favorable”.

This applies to the report development process, specifically storytelling. We should be making reports based on what the audience needs, and not based on what we personally want to present.
Who is the audience? What is their role in their organization? What is their analytical maturity? Do they have preferences and habits that should dictate the way the data is presented? What kind of tools do they use?
We should also understand their pain points and their limitations. Do they have habits that could dictate how they analyze the data?

Analysts Versus Executives
Knowing the audience allows us to make decisions on how we should be building our report. Some audiences are completely visual and appreciate the overuse of charts, for example. Others might need more thorough explanations on each section of the report.
It’s also important to understand that analysts and executives will always have different perspectives.
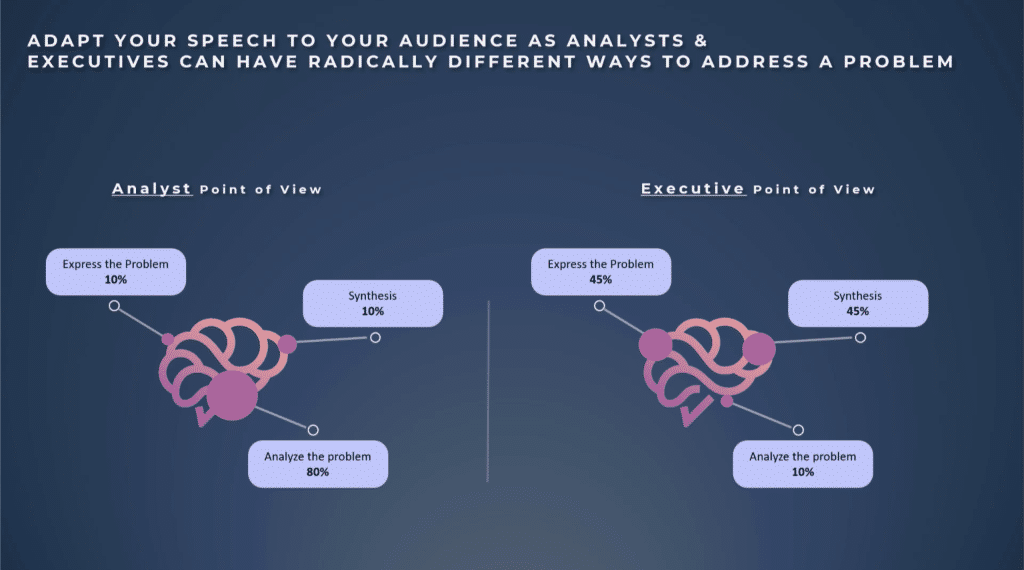
Analysts tend to spend more time analyzing the problem and less on expressing the problem or working on a synthesis. Executives are the exact opposites and would jump into expressing the problem and working on a synthesis without leaving much time for analysis.
Because analysts and general management have two radically different ways to address a problem, you also need to ask the right questions. What are their expectations? What will they do with the report? Will it be used to highlight specific trends and use it for decision making?
Knowing the end goal of the project is extremely important because this tells you how to create a story that will lead to the results they need. Identifying your audience as either analysts or executives (or a mix of both) allows you to tweak your approach based on their priorities.
Two Approaches In Logic And Flow
There are two basic types of approach in terms of story logic and flow. The first approach is called the inductive approach.
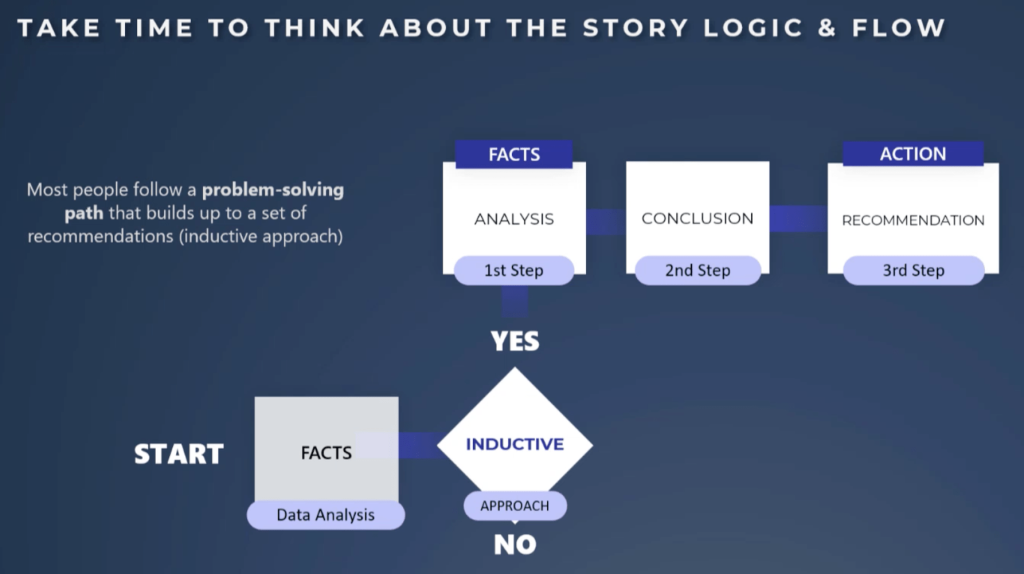
The inductive approach is a common path most of us use in problem solving. We start with the facts and analyze the data before doing our analysis. From there, we come up with a conclusion, which will be the primary basis for our recommendations.
The second approach is called the deductive approach.
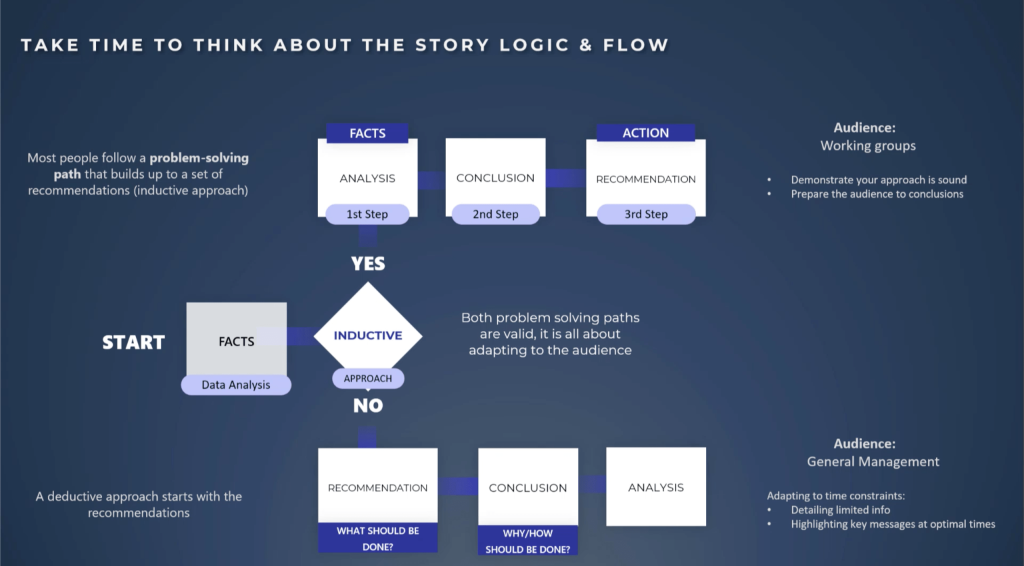
This deductive approach starts with recommendations on what should be done before asking questions on why it should be done. If there are more questions, that’s the only time you jump into the analysis and methodology.
This approach is mainly for executives who are less interested in seeing facts and methodology and would like to see action taken right away. The conclusions and actions will be their primary basis in asking questions, if needed. Knowing this allows you to be prepared with clear answers to those questions.
The main advantage of this approach is the detailed information given within a limited timeframe. It allows you to engage in a Q&A discussion that will help the audience understand your ideas. This lets you highlight key messages at optimal times.
This approach has two potential outcomes. First, the end users could find the quick access to information very useful and could comfort them if the findings align with their initial hypothesis. This will increase ownership.
On the other hand, if you end up proving their insights wrong, it will spark interest and will be a great opportunity for you to get their attention. This could end up as a turning point in your story.
Understanding The Context Of Your Data Storytelling
Knowing the context is another key to successful data storytelling. Never forget that you’re creating a report for someone else. This means that the context might be different from what you’re expecting.
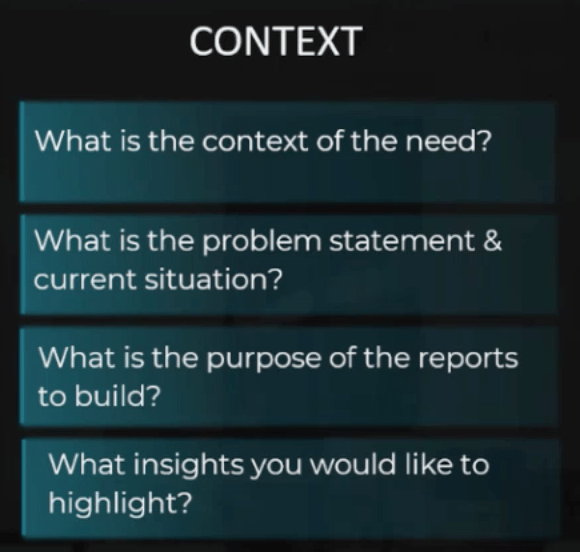
Why is there a need for this report? Did something trigger this need? What are the circumstances?

Feedback interactions prove to be useful in this case. It shows you what the problem is and gives you the chance to look at the bigger picture. It allows you to create a report that could potentially pave the way to a resolution.
A good understanding of the context also helps you understand which business questions should be answered first. It allows you to structure your report in a logical manner, based on what the current needs are. It creates a connection between the problem, the expectations and the solution.
Coming Up With A Solution
The third important factor to consider in coming up with a data story is the solution. What are the questions you would like to get answers to?
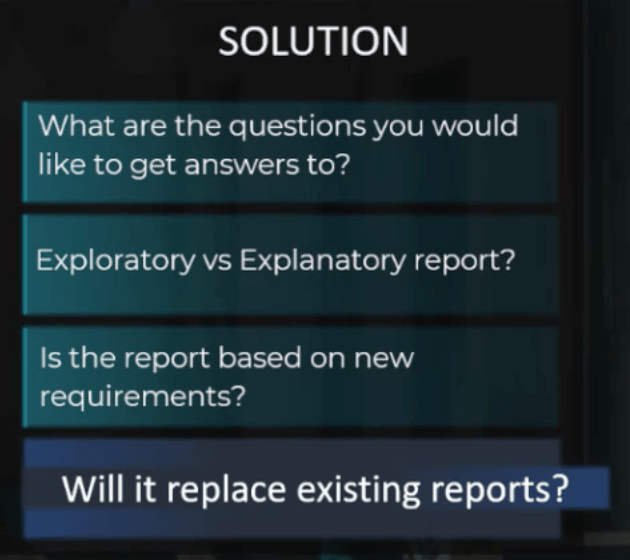
There are a lot of things your end users do not know but would like to find out through the report you’re working on. Note that this is not just about existing questions that they already have. As you work with the data, they will formulate new questions along the way. These questions will lead you to the right story line to follow.
Figuring out what solutions to provide will also help you determine whether you need an exploratory report or an explanatory one. Again, this ties up to the kind of audience you have. If you have executives as the end user, you would most likely need explanatory reports that present less details but cover a larger scope. Your priority would be presenting clear actions instead of drilling down on each piece of information.
However, if your audience consists of people working in operations, then you would need an exploratory report where you’ll be presenting more details with a limited scope. They would need tools for interaction such as filters so that they can navigate the report more effectively.
It’s also important to understand if the report addresses a new requirement or if it is meant to replace an existing solution. If the report is meant to replace an existing solution, you have the advantage of seeing what worked and what didn’t work in the last solution they were using.
If this is a new requirement, the best way to create an effective report would be to understand where the need came from. Is the report supposed to address current issues, or should the report evolve as new data is uncovered?
The more you communicate with your audience and ask the right questions, the more you will get to know their real needs.
***** Related Links *****
Business Reporting Using Power BI
Web-Based Report Development Techniques In Power BI
Best Practices For Data Visualization In Power BI
Conclusion
A report is a communication tool that makes technical analysis easier to understand. It has a purpose and sends a call to action. It educates and provides information that will help end users make decisions.
This is why you want to create a relevant, intuitive and visually pleasing experience for your end users every time you produce a report. You want to make an impact. That’s something that you can achieve through effective data storytelling.
All the best,
Alex