
This tutorial will discuss about Python scripting in Power BI reports. You’ll learn how to use Python to accomplish different outputs inside Power BI. You’ll also understand some of the technical limitations of Python so that you can avoid errors while using this inside the Power BI desktop.

Understanding Python Packages For Scripting In Power BI
Errors happen between Python and Power BI because they update at different speeds. Sometimes, there are conflicts about packages in these two software. You can avoid errors by setting up the right environment.

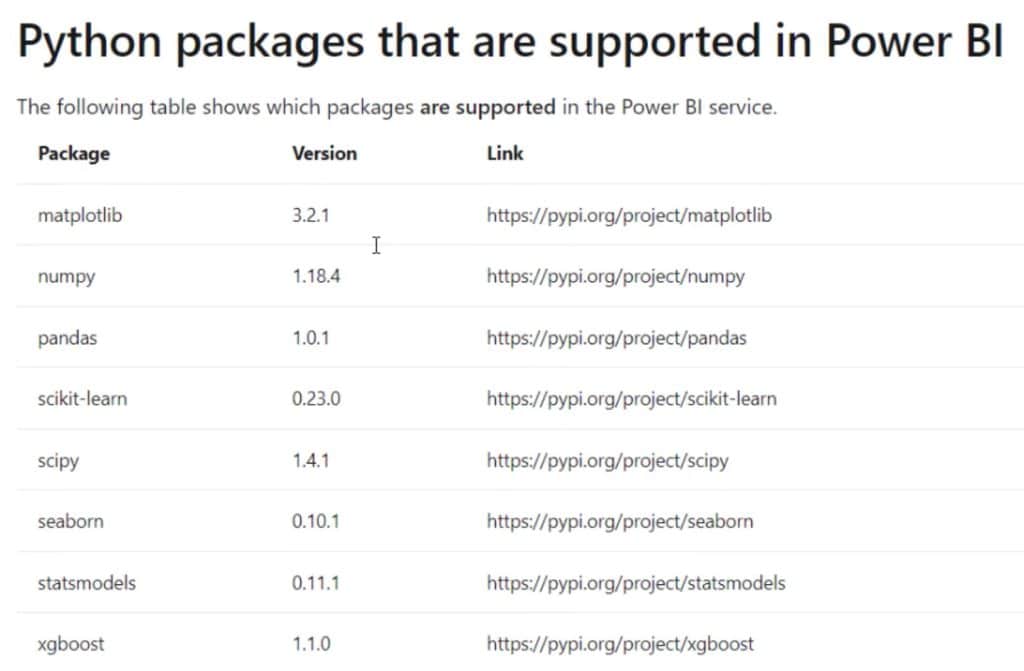
Not all packages in the Python Anaconda Installation are supported by Power BI. In the image below, you can see all the different packages that are currently supported.
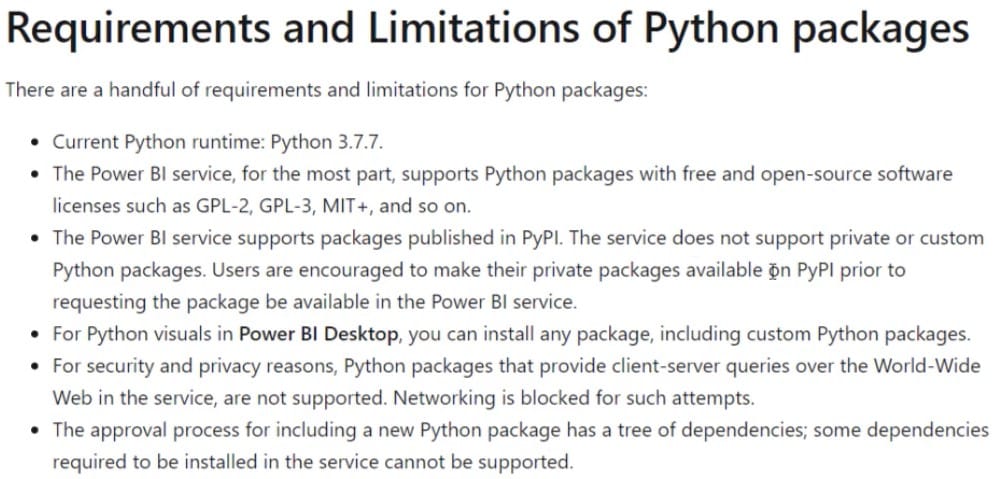
This next image shows the the requirement and limitations of Python packages.
Pandas is the data manipulation library, while Numpy is the linear algebra. Scikit-Learn and Xgboost are libraries that allow you to do machine learning and pre-processing. Scipy and Statsmodels deal with statistics. Seaborn is used for visualization, while Matplotliob is the visual library.
Creating Environments With Python Scripting
You need to create an environment that contains the packages that you need to avoid conflicts. You can create an environment using the Anaconda Prompt that was installed during the Anaconda installation. To open the prompt, type Anaconda in the windows search bar and click the app.
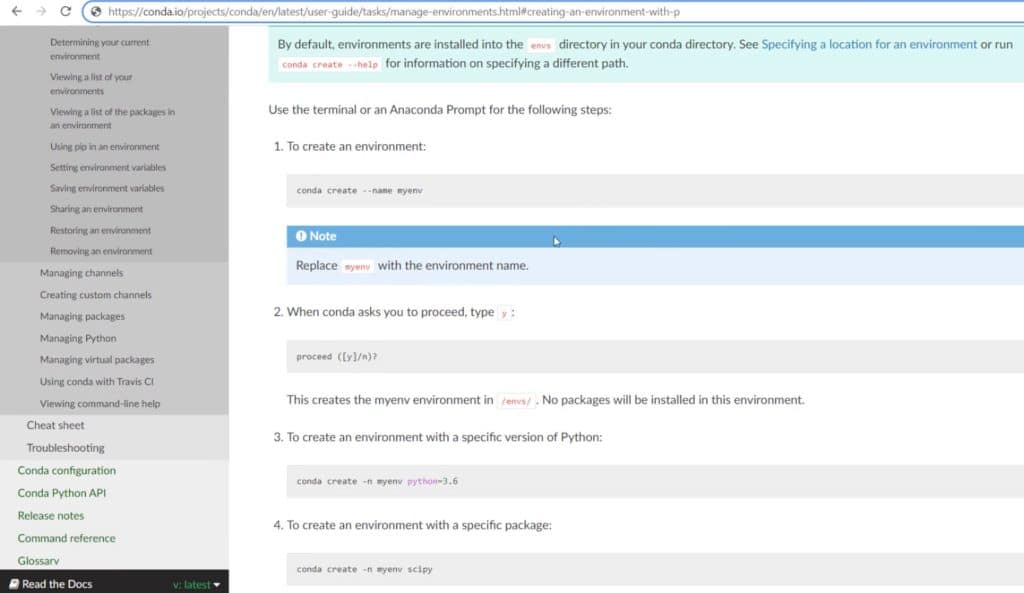
If you search “create environment in anaconda” in Google, you’ll be redirected to this page. In the same page, you can see different ways of creating specific environments.
In the Anaconda Prompt command window, you can see the base environment and the working directory.
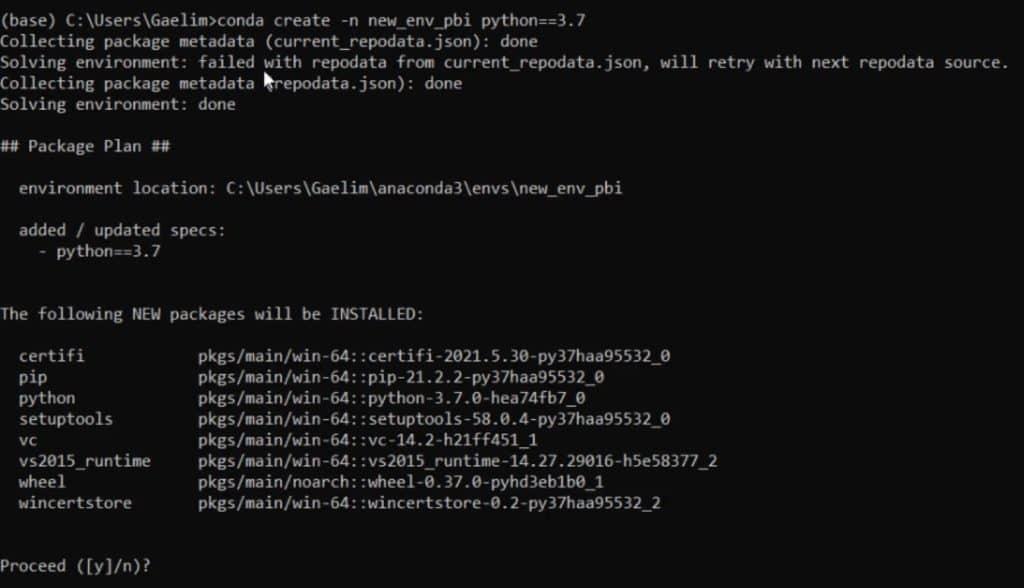
To create a new environment, input conda create. Then, input –n followed by your environment name. Lastly, type what Python version you want. In this example, the environment name is new_env_pbi and the Python version is 3.7.


Press Enter once done. You’ll then see that it is creating a new environment.
Press Y to proceed with the process.
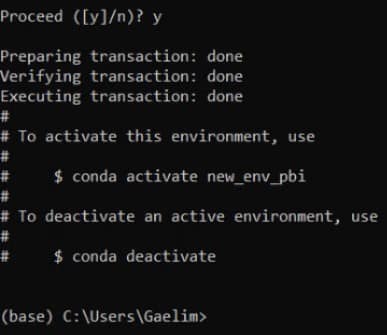
Next, you need to activate the environment. Input conda activate new_env_pbi.

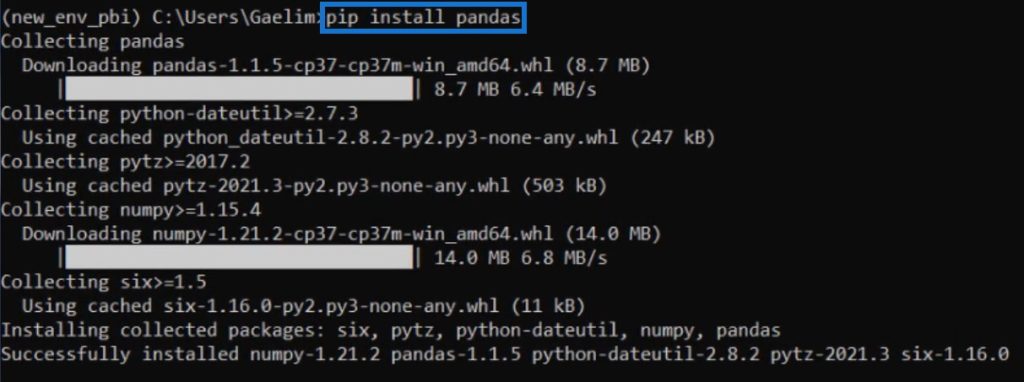
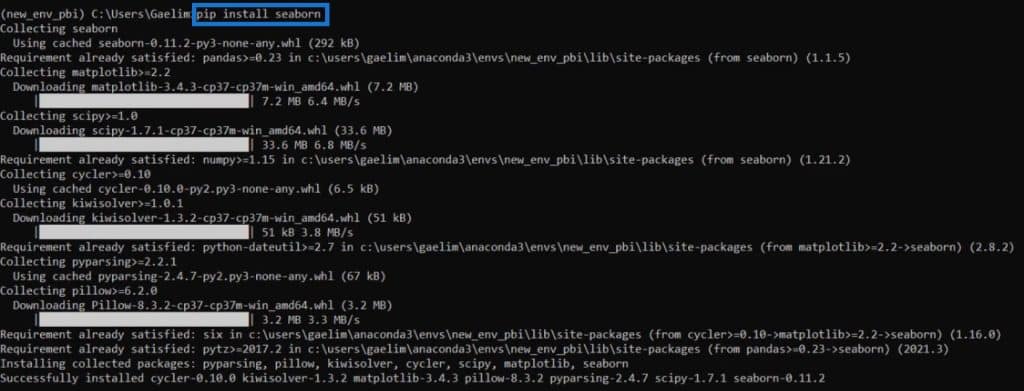
Once done, you can then see that the new environment is activated. From there, you can start installing packages that you need. First, install Pandas to bring in data. Input pip install pandas and press enter.
Next, input pip install seaborn to install Seaborn. You’ll also see that Seaborn also loads Matplotlib. After the installation, you can now open the Power BI desktop.
Getting Data Using Python
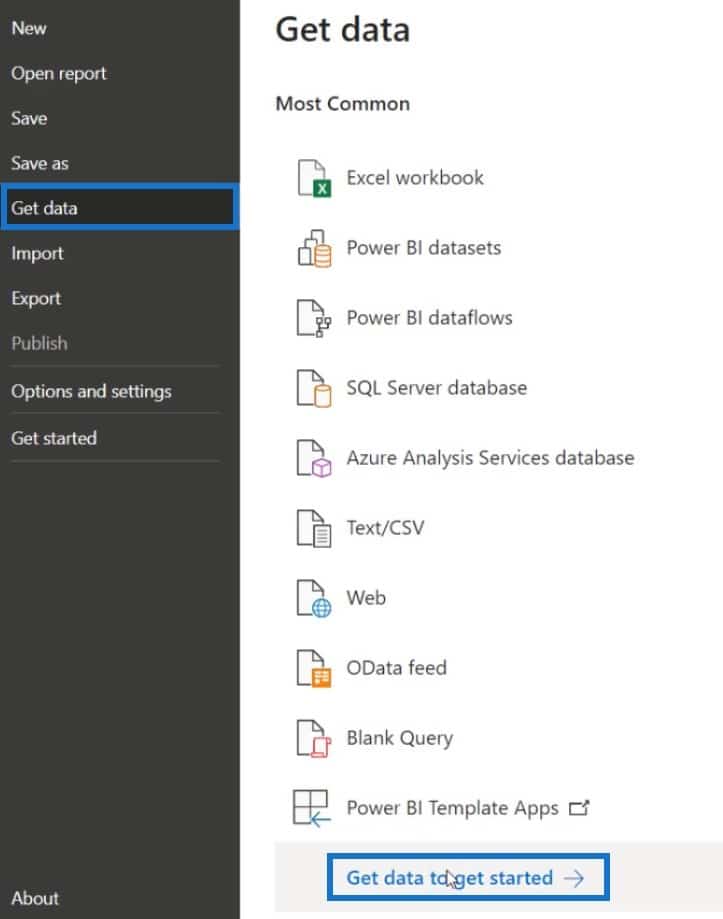
There are three ways to get data inside Power BI using Python. The first one is to go the File toolbar, click Get Data, and then select Get Data To Get Started.
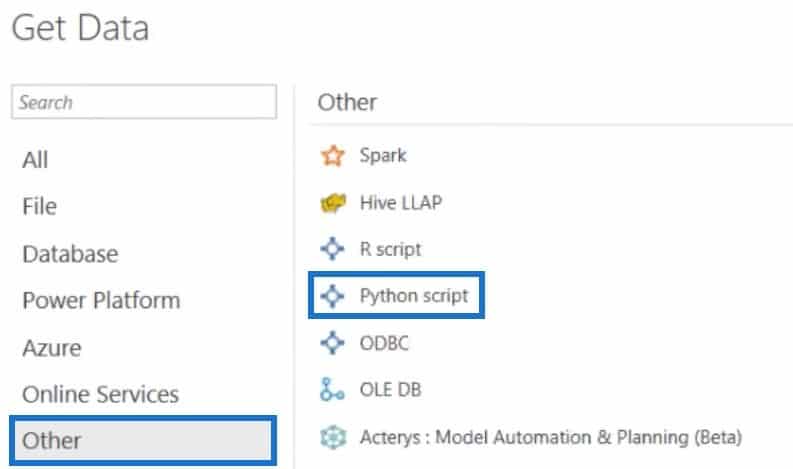
Click the File Toolbar again, select Other, and choose Python Script.
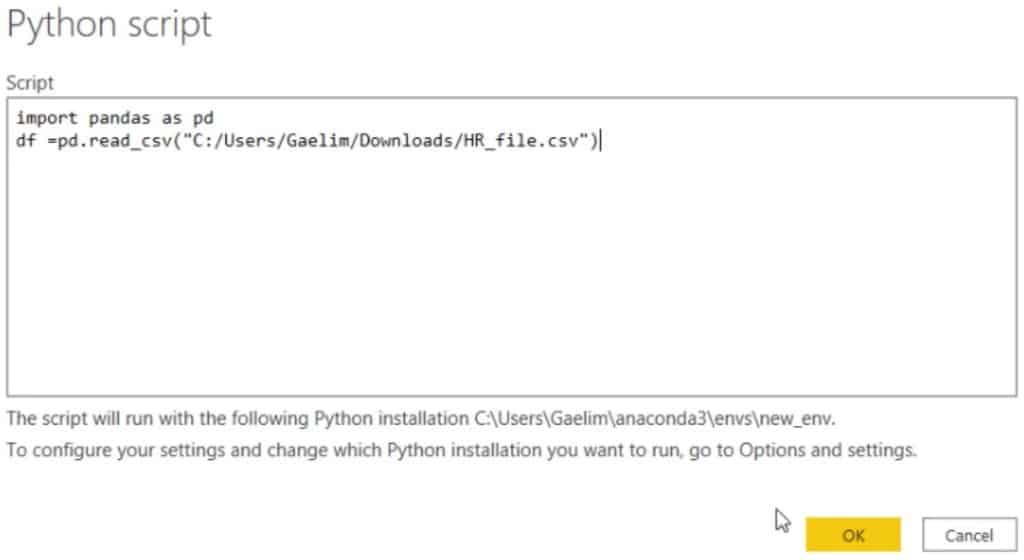
From there, input a script to bring in data and press OK. In this example, this script is used.
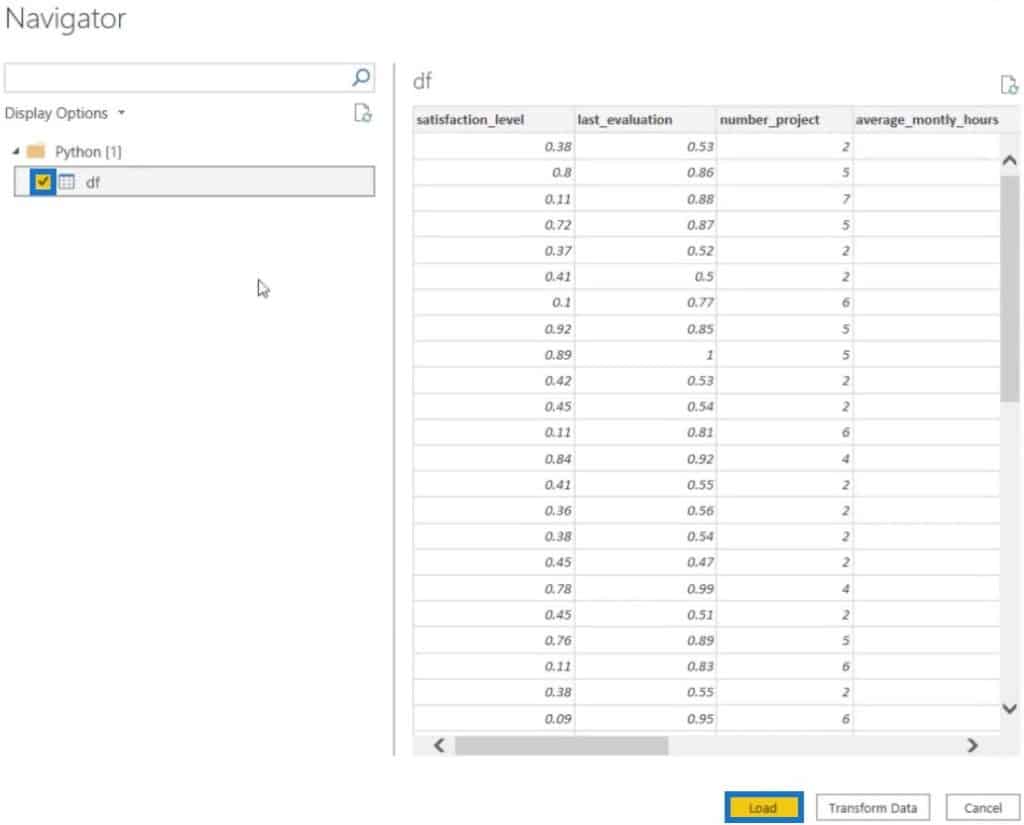
In the Navigator pane, click the variable under the Python folder and click Load.
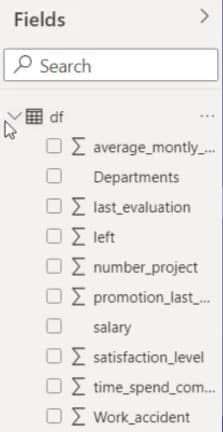
You’ll then see that data in the Fields pane.
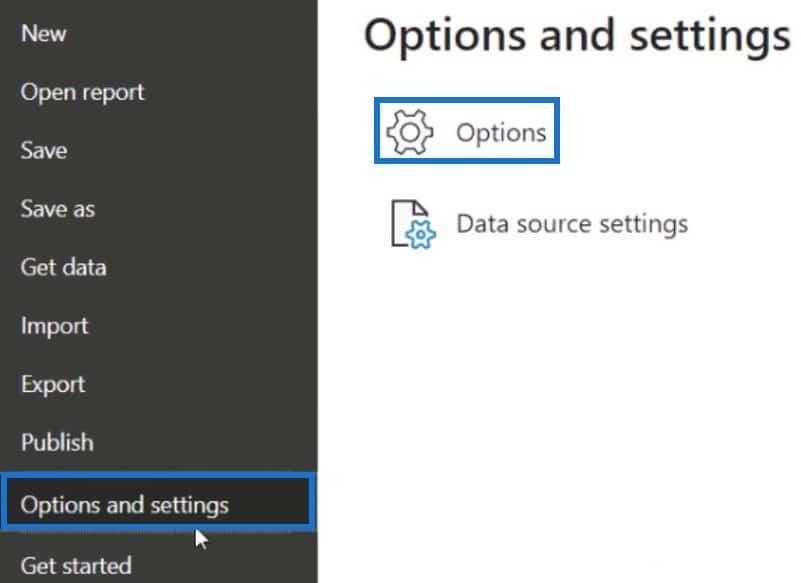
After that, you need to ensure that you are using the correct environment. Go to the File toolbar, click Options And Settings, then select Options.
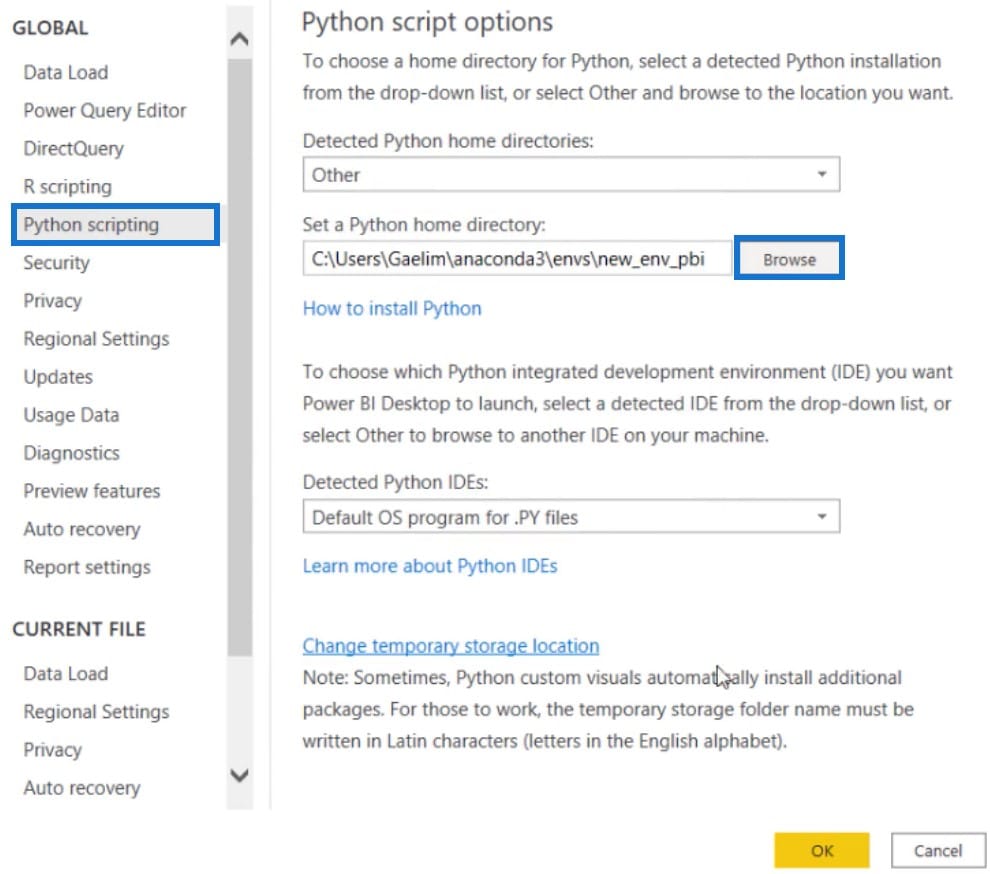
Under Global, click Python Scripting and set the Python Home Directory. Click Browse and open new_env_pbi.
Enabling Python Scripting Visualizations In Power BI
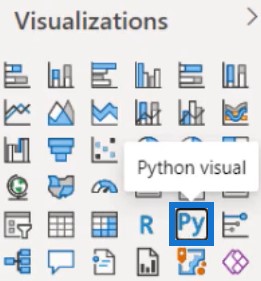
To access Python Integration, click the Python Visual under Visualizations.
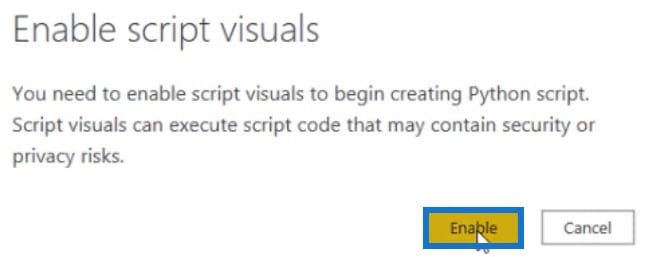
Then, enable script visuals.
Once done, a text-based Python Script Editor will appear on the canvas.


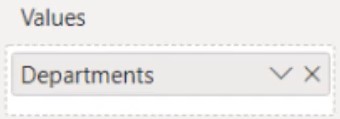
To start scripting, drag a field in the Values area of the visualization. In this example, Departments is placed inside the Values area.
The visualization will now look like this.
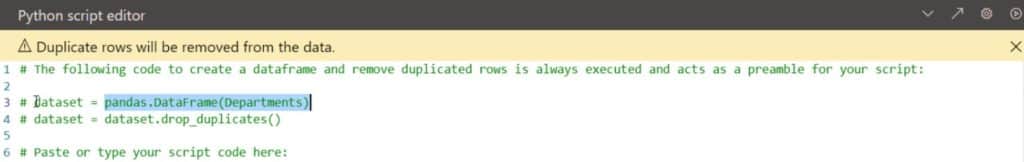
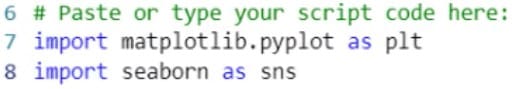
A dataframe is created using the pandas.DataFrame function. The script saved it as a variable and named it dataset. Below line 6, you can paste or type your script code to create a visual. In this example, the following codes were used.
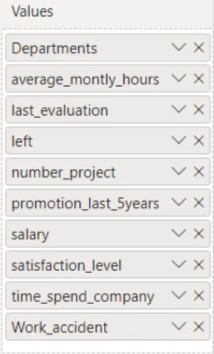
Currently, the data frame is incomplete because it only has Departments. So, drag all columns from the Fields pane to the Values area to create a full data frame.
After that, you can choose a visual from your Jupyter Notebook. Then, copy the code of that visual and paste it into the editor.
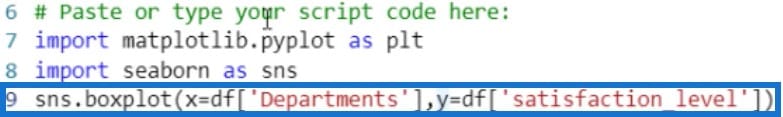
Change the variable used in the visual code from df to the dataset and input plt.show() in the next line to use the Matplotlib.

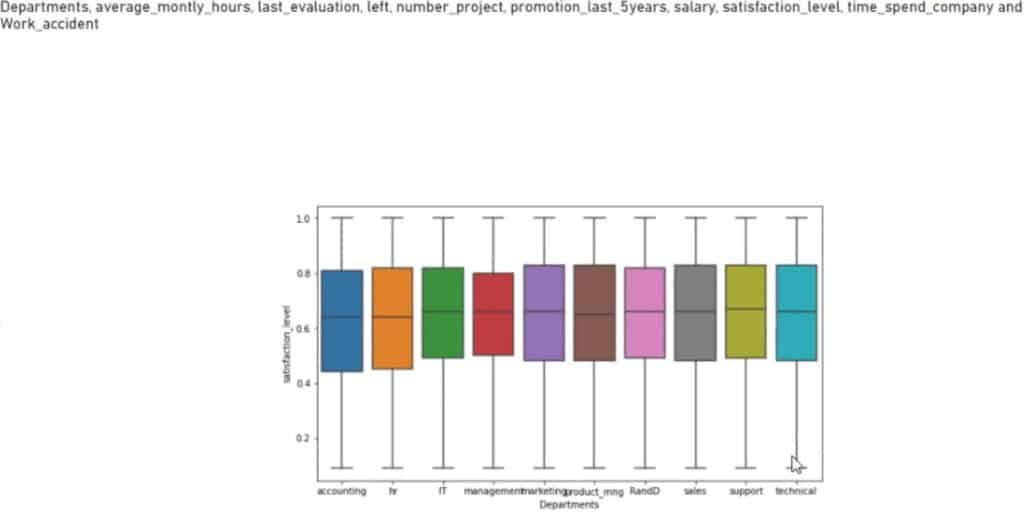
Once done, run the script by clicking the run icon in the editor.

You’ll then see the visualization materialize in your canvas. The visual isn’t interactive but you can make it dynamic by customizing it.
Customizing Python Visualization
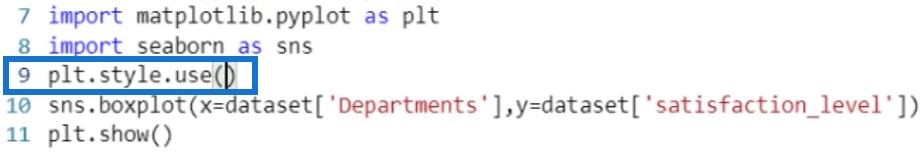
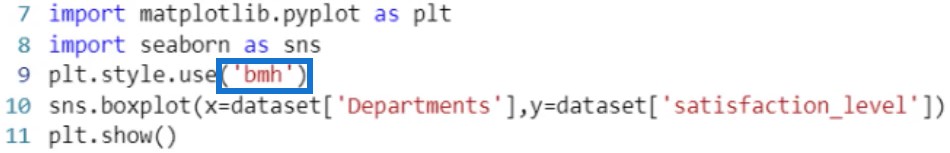
Click the arrowhead to open the Python Script Editor. Next, input plt.style.use().
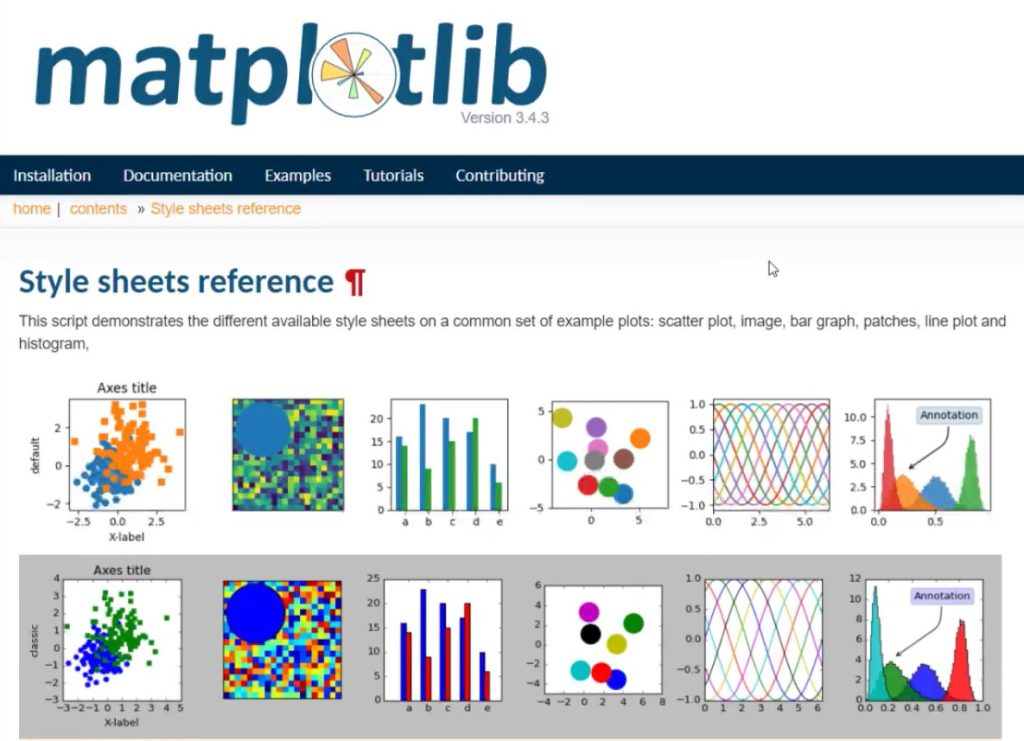
Open Google and search for matplotlib styles. Click the Style Sheets Reference and you’ll be redirected to their page.
Inside the page, you’ll see different styles that you can use.
Select a style and input the code of that style in the script code.
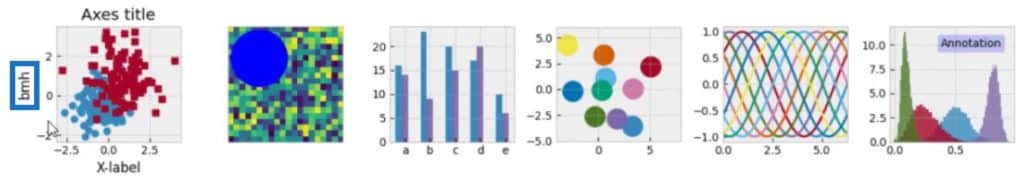
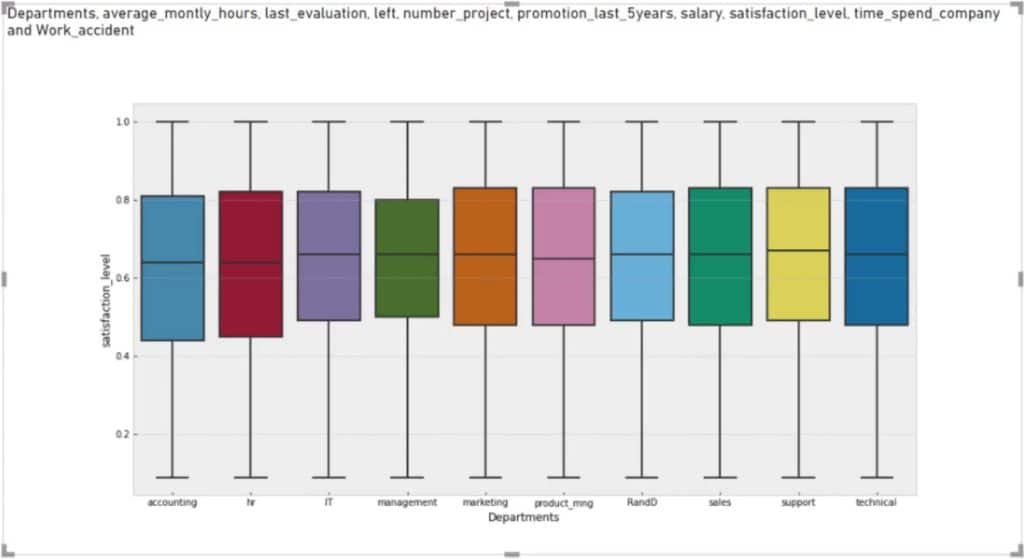
In this example, the code of the style used is bmh. Once done, press the run icon.
You’ll then see that the colors inside the visual have changed.
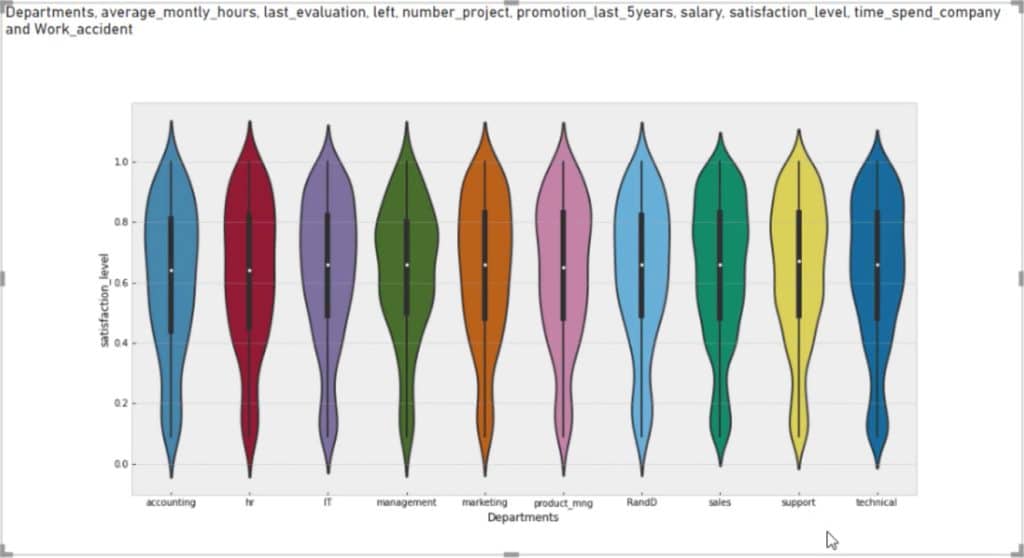
You can also change the shape of the visual if you want. To do this, open the script editor, change boxplot to violinplot and run the script code.

You’ll see that the shape of the visual has changed.
Transforming Data In Power Query Using Python Scripting
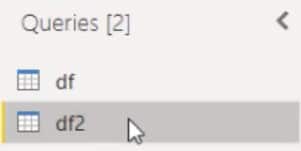
The last method for accessing Python scripting in Power BI is to transform data in the power query editor. One of the best practices is to duplicate the data and do the scripting in the duplicate instead of using the main data. In this example, the main data is df and the duplicate is df2.
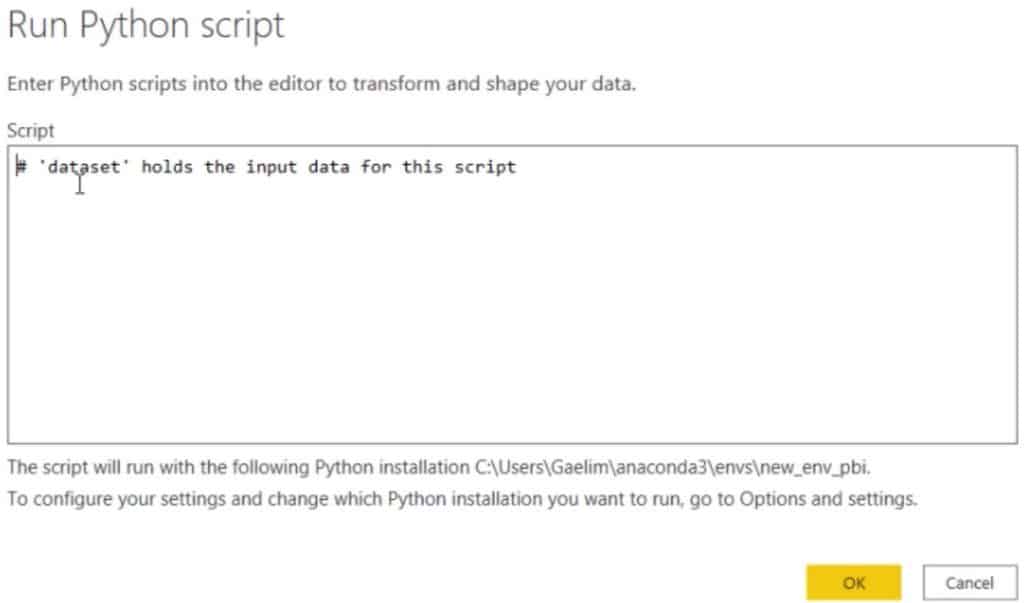
Go to the Transform toolbar and select Run Python Script.

You’ll then see the Run Python Script dialogue box with a script message.
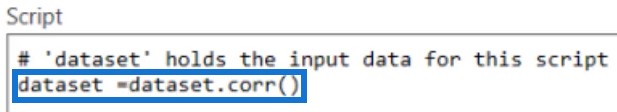
Input a code for tables from your Jupyter Notebook. In this example, dataset.corr() is used in the script. But first, you need to resave the variable by typing dataset = again.

After pressing OK, you’ll see the data in your canvas.
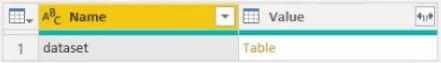
Expand the table by clicking Table in the Value column. This will also show a correlation table.
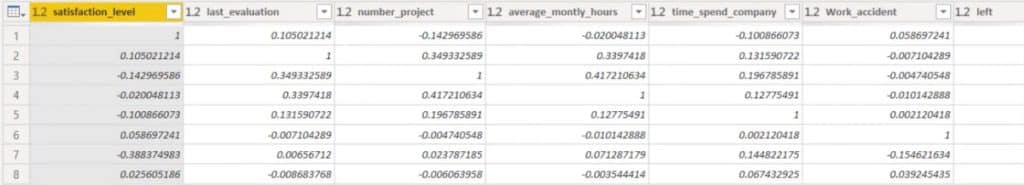
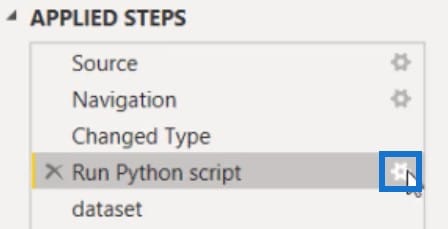
However, the Index column in the Python Script is not shown in the correlation table. To fix this, go to the Applied Steps pane and click the gear icon of the Run Python Script step to open the script code.
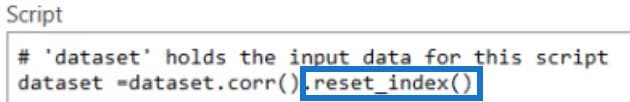
Now, input another function by inputting .reset_index(). Then, string that function with the correlation table function.
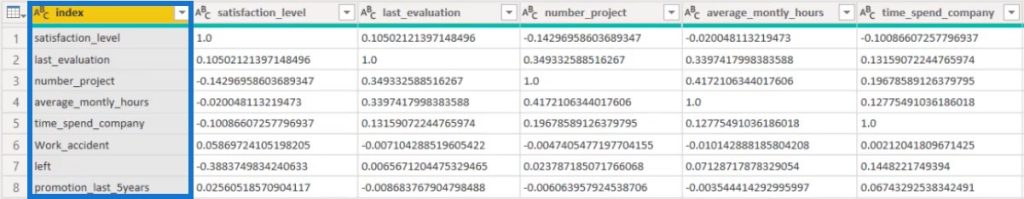
Once done, you can now see an Index column in the correlation table.
***** Related Links *****
The Importance Of Creating Compelling Power BI Visualizations
Power BI Best Practice On Reports & Visualizations
Python I for Power BI Users – New Course in the Enterprise DNA Education Platform
Conclusion
There are a lot of things that Python can do once it is integrated with Power BI. In this tutorial, Python scripts were used in three different ways: to bring in the dataset, to create visuals, and to manipulate the existing data in the power query editor.
Gaelim


