
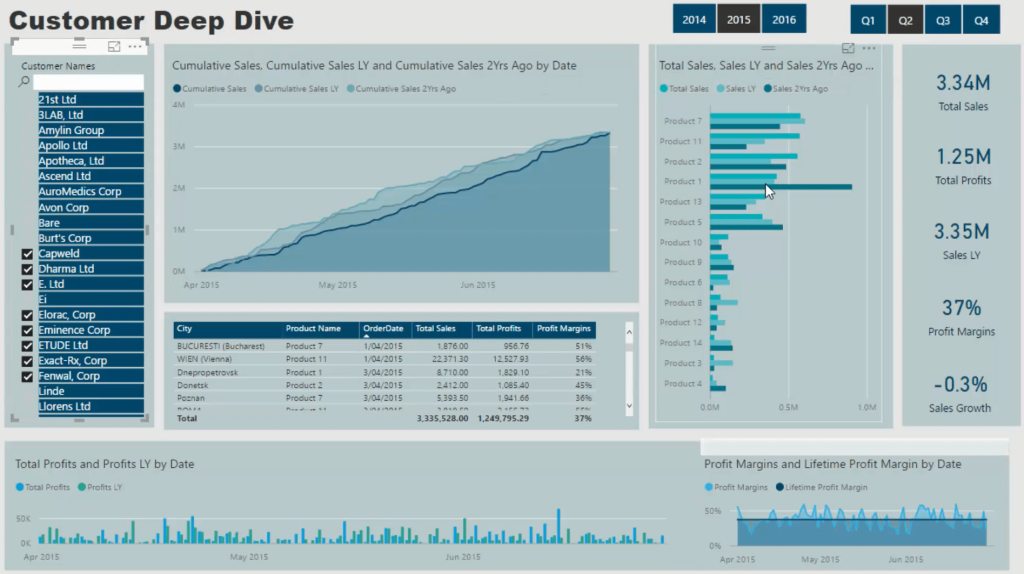
In this Power BI dashboard tutorial, you’ll learn about different design tips to improve your dashboard for a better user experience.
Previous blogs have taught you how to create a customer deep dive development report. The last step when creating this dashboard is to clean it all up and make it look better.

Choose & Add A Theme
First, create a theme. Create themes that relate to the business that you’re in or are consistent with the other models that are getting built within your organization.
Models having different colors aren’t good to look at because it takes the attention away from the insights in your reports.
Go to Switch Theme and then Import Theme.
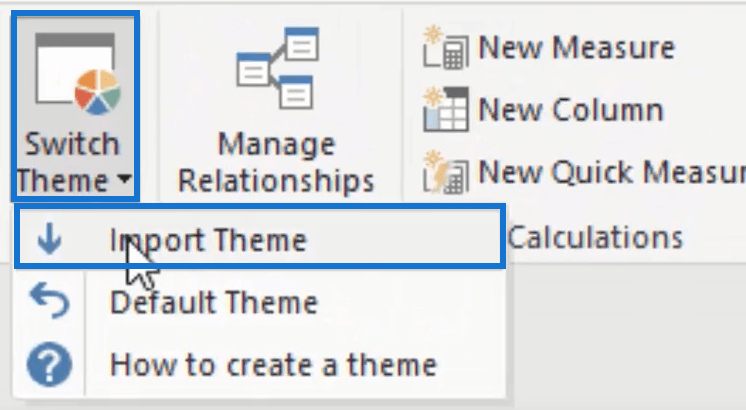
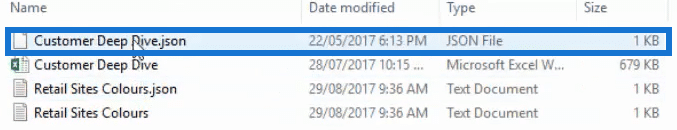
Then, you can open any theme that you want to use.
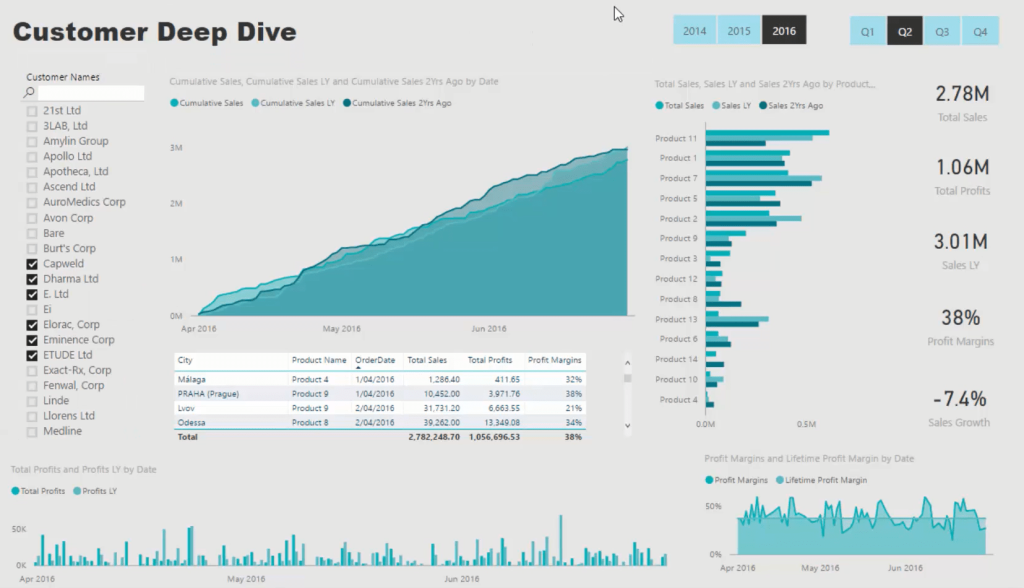
This is a generated customer deep dive color palette that is available for you. If you open and use it, you’ll see that the colors quickly changed. The theme changed the entire color of the report.
But this may improve and change in time. The theme generation may have been adjusted. They may be improved to help you make your report compelling.
Add A Background
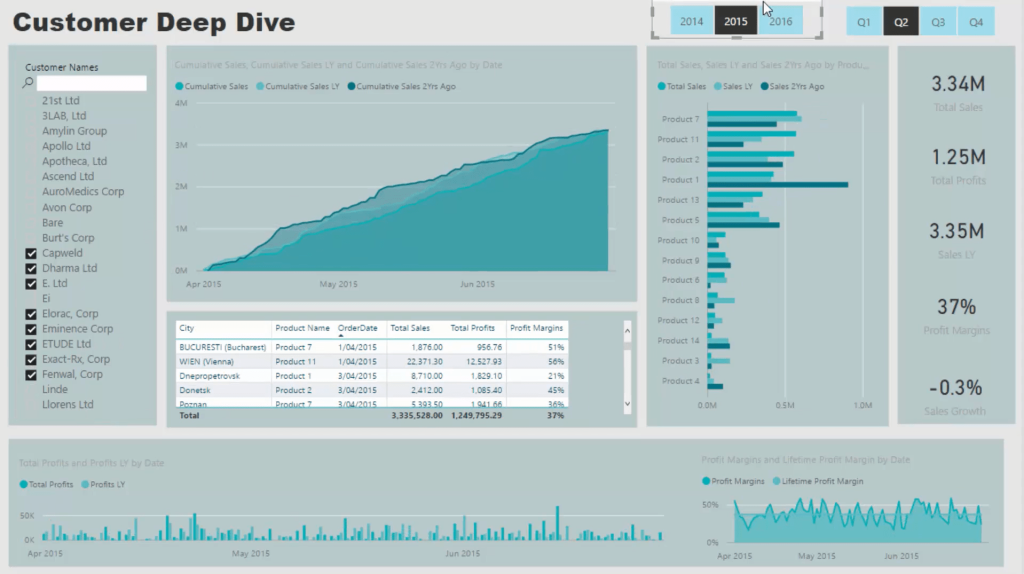
After the theme selection, proceed to the background color. In this example, it’s using a gray color. Consumers will now focus on specific areas on your report page

However, all visuals are jumbled together on one page. So, you need to create shapes behind the visualizations to make them stand out.
Fill them with a dark color, turn the transparency up, get rid of the lines, and then send it to the back. Copy the shape and paste it behind every visualization in your report. Make sure to align them properly to make it look compelling.
You can see how it groups your reports and how it shapes the way consumers would look at it. The table functionality has been vastly improved in the last releases of Power BI desktop. But it already has compelling visuals just on its own.
For the slicer, change the background color to align it the color palette. Choose a dark color for the background and choose white for the text.
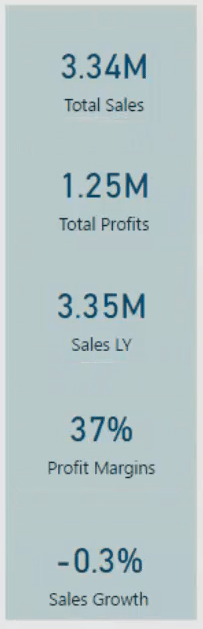
Next, change your cards’ data label and category label color to a darker shade.
You can play around with the colors. You just have to make sure that they are aligned with the themes in your organizations.
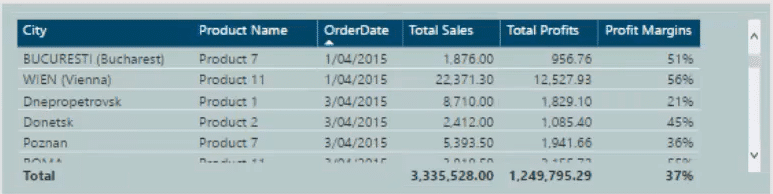
In this table, change up the column header color to make it stand out. Then, change the table style to none.
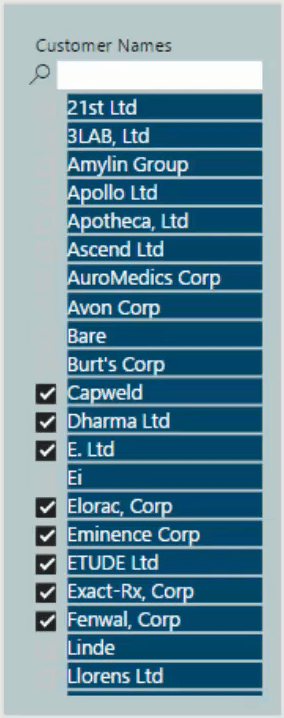
Also, change the color of the Customers Names table to match the theme.
By adding colors and shapes, your visualizations will start to pop and make your report look a lot better.
Adjust The Titles
The only thing you need to do now is make the titles readable. It’s important to make sure that people know what they’re looking at.
For the cumulative sales comparison table, change the title name to Sales Time Frame Comparison to make it shorter. Make the legends slightly bigger and darker for your consumers to see.
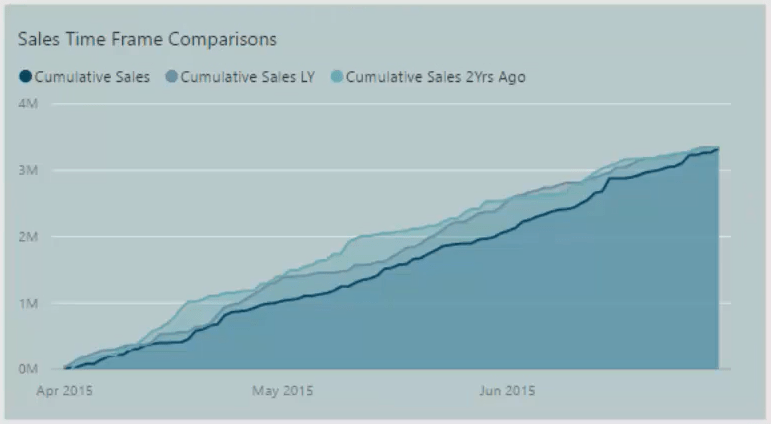
These are simple little things that add up at the end to make consumer experience better. A lot of people need to understand what they’re looking at.
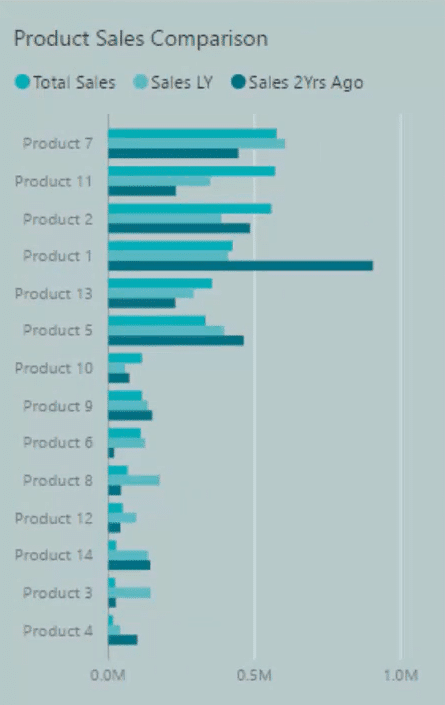
For the sales table, you can change the title to Product Sales Comparison because the legend already shows what the chart is.
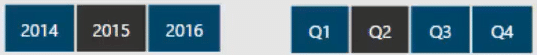
You now have this amazing dashboard. You can quickly dive into any time frame and see the trends.
***** Related Links *****
Creating Compelling Power BI Dashboards With High Quality Insights
The Importance Of Creating Compelling Power BI Visualizations
Using Filter Fields & Visual Interactions To Create Compelling Visualizations In Power BI

Conclusion
To wrap things up, you have to make sure that your interactions are correct so that if you select a report, it’s filtering correctly.
You can now look at your clients, dive into a product, and change the time frame. You can look at your profit margins and see how they have performed through time. All you have to do is click any visualization and it will give you the insights you need.
If you want to create another report like this, implement what you have learned from this Power BI dashboard tutorial along with the DAX and Time Intelligence formulas you’ve learned in previous tutorials.
After doing some formula writing and visualization customizations, you’ll be able to create another compelling report.
All the best,
Sam


