
In the world of data analysis and data science, you might be wondering which programming language is the better choice, R or Python?
Well, both are popular programming languages, each having their own strengths and weaknesses. Let’s explore them.
So, deciding whether to choose R or Python is an important step for aspiring data scientists and analysts alike.

After going through the article, you will have learned the differences between the R and Python programming languages. Equipped with this knowledge, you will be able to choose an appropriate programming language for your next data project.
Let’s get into it!
(Running short on time, scroll down to watch the video version of this article!)
Language Overview
R Language
R is a powerful open-source programming language for working with data. It is designed for data manipulation and visualization. R initially emerged as a statistical software for researchers and statisticians to make robust analyses using data.
With the inclusion of different packages under the CRAN project in R(such as tidyverse, dplyr, and ggplot2), it became a leading option for data scientists to analyze large amounts of data.
Some advantages of using R for data analysis include:

- Robust Community
- A high focus on statistical modeling
- Extensive resources for data visualization
Now let’s explain Python, don’t worry, we are not talking about a snake, well, a real one.
Python Language
Python is a versatile, open-source programming language. Although not specifically developed for data science, Python has gained significant popularity in this field due to its simplicity and readability.
Some advantages of using Python for data analysis are:
- Clear syntax, which makes it easier to comprehend and write code, even for beginners.
- Offers a high level of scalability
- Python’s growing libraries specifically for data science (such as Pandas, NumPy, Scikit-learn, and SciPy) make it a go-to choice for data applications. Furthermore, API’s like SQLite allows you to write SQL code within Python.
Ease of Learning
When deciding between Python and R for data analysis, it’s crucial to evaluate how easy it is to learn each language. Although Python and R are generally considered easy to learn, the best fit for you relies on your personal background and aspirations.

Python
If you’re just getting started with programming or have some experience in languages like Java or C++, Python might feel like a breath of fresh air. Known for its readability and simplicity, Python is beginner-friendly and can be used for a variety of tasks.
- Emphasizes readability and simplicity, ideal for beginners
- Versatile general-purpose programming language for diverse tasks such as scripting, web development, and data science
- An abundance of documentation, tutorials, guides, and courses
- Engaging learning platforms like Coursera and Codecademy offer Python resources
So, what about R?
R Programming Language
R is designed specifically for working with data and offers a more familiar and straightforward experience for someone with a background in statistics.
- Tailored specifically for data processing, analysis, and visualization
- A rich ecosystem of libraries and packages for data science tasks
- Extensive documentation, tutorials, guides, and courses are available
- Learning resources available on platforms like Coursera and RStudio’s official learning resources
Data Analysis and Visualization
Data analysis and visualization are crucial components in the decision-making process, as they transform raw data into actionable insights. By identifying trends, patterns, and outliers, these techniques enable businesses and organizations to make informed decisions, optimize operations, and drive innovation.
This section focuses on the data manipulation and visualization capabilities of both languages.
Data Manipulation
In any data science project, data manipulation is an important stage of the analytics cycle. In fact, most of your time goes into changing data into a form suitable for your analysis. Tasks like cleaning, reshaping, and filtering are essential, and this is where data manipulation comes into play.

Both Python and R offer a range of libraries to manipulate data:
- Pandas and NumPy are commonly used Python libraries for data manipulation. Pandas deal with merging, reshaping, and aggregating data, while NumPy concentrates on numerical operations involving arrays.
- The R programming language offers the popular tidyverse package ecosystem, including dplyr and tidyr, to manipulate data. dplyr allows for filtering, arranging, selecting, and mutating data, while tidyr handles reshaping wide and long formats for data cleaning.
Now, let’s talk about visualization.

Data Visualization
An important stage in the data analytics life cycle is presenting findings from data in a way that has a long-lasting impact on the readers. As a data scientist or analyst, using appropriate graphs and statistics that effectively communicate your message is crucial.
Python and R offer powerful visualization libraries that allow you to create powerful graphs and dashboards packed with insights.
- Python has Matplotlib, Seaborn, and Plotly, among others. Matplotlib provides a foundation for creating static, animated, and interactive visualizations, while Seaborn simplifies the creation of statistical graphics. For interactive plots, Plotly is a widely-used option.
- R has ggplot2, lattice, and Shiny, to name a few. ggplot2 is a highly flexible graphics system based on the Grammar of Graphics, enabling a wide range of plots with a consistent underlying structure. Lattice specializes in visualizing multivariate data, while Shiny allows for creating interactive web applications for displaying your visualizations.
When working with data, you will realize that Python offers a more streamlined approach to visualization, whereas R provides multiple packages and options, enabling greater flexibility in creating visuals.
What about machine learning and artificial Intelligence?
Machine Learning and Artificial Intelligence
Often, you will be required to build machine learning models that streamline data generation and analysis tasks.
Data scientists use machine learning algorithms to generalize complex data generation processes and make predictions.

Both Python and R programming languages are loaded with machine-learning packages that allow you to build complex models using big data.
As you dive deeper into these fields, you will find that Python’s versatility shines in handling big data, such as data manipulation and repetitive tasks.
Due to its origins in software development, Python has more extensive libraries and frameworks with predefined algorithms.
As you work on your projects, consider the following aspects for each language:
- Python: TensorFlow, Keras, Scikit-learn, and PyTorch are popular libraries for machine learning and deep learning in Python. This language has larger and more active experienced programmers developing tools for AI applications.
- R: Packages like ‘caret’, ‘randomForest’, and ‘xgboost’ are widely used in R for machine learning purposes. R excels in statistical modeling and time series analysis but may fall short in terms of scalability and processing efficiency.
Let’s talk performance and speed!
Performance and Speed
Often, you’ll be involved in performing EDA and building models that do not require you to keep a strict eye on the performance and speed of your analyses.
However, when building models that other users interact with, it becomes crucial to analyze the performance and speed of predictions. Large-scale programmers place a heavy emphasis on performance and speed.

There are notable differences between R and Python in terms of performance and speed.
Let’s check them out.
Speed
Python tends to perform faster than R in many scenarios. For example, in a speed benchmark comparison, the Python code was found to be 5.8 times faster than the R alternative.
To make our comparison more solid, we will use a benchmarking code to compare the execution time for reading a CSV file and calculating the mean of a specific column in Python and R.
Benchmarking code in Python
To run the benchmarking code in Python, open up Jupyter Notebook(an IDE for running Python code) and run the code given below:
import pandas as pd
import numpy as np
import time
# Generate a dataset with 1 million rows and 10 columns
rows = 1000000
cols = 10
start_time = time.time()
data = pd.DataFrame(np.random.rand(rows, cols), columns=[f'column_{i}' for i in range(1, cols + 1)])
end_time = time.time()
# Calculate the time taken to generate the dataset
gen_time = end_time - start_time
# Calculate the mean of a specific column
start_time = time.time()
mean_value = data['column_5'].mean()
end_time = time.time()
# Calculate the time taken to compute the mean
calc_time = end_time - start_time
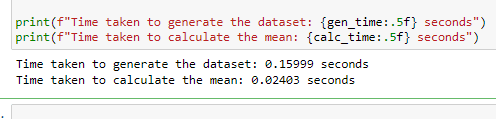
print(f"Time taken to generate the dataset: {gen_time:.5f} seconds")
print(f"Time taken to calculate the mean: {calc_time:.5f} seconds")
After running the code above, you’ll see the output as shown in the image below:

Benchmarking code in R programming language
To run the benchmarking code in R, open up RStudio and execute the code give below:
library(microbenchmark)
# Generate a dataset with 1 million rows and 10 columns
rows <- 1000000
cols <- 10
start_time <- Sys.time()
data <- as.data.frame(matrix(runif(rows * cols), nrow = rows))
colnames(data) <- paste0("column_", 1:cols)
end_time <- Sys.time()
# Calculate the time taken to generate the dataset
gen_time <- end_time - start_time
# Calculate the mean of a specific column
start_time <- Sys.time()
mean_value <- mean(data$column_5, na.rm = TRUE)
end_time <- Sys.time()
# Calculate the time taken to compute the mean
calc_time <- end_time - start_time
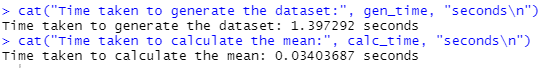
cat("Time taken to generate the dataset:", gen_time, "seconds\n")
cat("Time taken to calculate the mean:", calc_time, "seconds\n")
After running the code above, you see the time it takes for R to perform the operations as shown in the image below:
Dataset generation
- Python: 0.15999 seconds
- R: 1.397292 seconds
Python is significantly faster in generating the dataset compared to R. It took Python about 0.16 seconds, whereas R took approximately 1.4 seconds to create the same dataset.
Mean calculation
- Python: 0.02403 seconds
- R: 0.03403687 seconds
Python is also faster in calculating the mean of a specific column, taking around 0.024 seconds, while R takes 0.034 seconds.
Memory management
Python is more efficient in terms of memory usage, while R tends to put everything in memory. This distinction can become particularly relevant when working with large datasets that may strain the available memory resources.
Code efficiency
Python’s performance can vary depending on the code’s efficiency, while R can exhibit consistent behavior across implementations. In comparison, the slowest implementation in Python was about 343 times slower than the fastest, while in R, it was about 24 times slower.
Community and Support
Community and support play a crucial role when choosing between R and Python for data analysis, as they significantly influence your learning experience, access to resources, and professional growth.
Availability of Resources
- Python: Python has a vast user base, making it easier to find support and resources for your projects. Its diverse community offers extensive libraries and tools for various applications, including data analysis.
- R: R has a more specialized community focused on statistics and data analysis, resulting in a wealth of resources tailored to the needs of data analysts and statisticians. R’s focused community enables targeted support for data analysis tasks.
Job Market
- Python: Python is in high demand in industries such as web development, software engineering, and artificial intelligence. Possessing Python skills can open doors for you in various fields, including data analysis.
- R: While R is primarily used in research and academia, it is gaining popularity in industries requiring advanced statistical analysis, such as biotechnology, finance, and data journalism. If your career aspirations align with these fields, learning R could prove beneficial.
Integration and Extensibility
Integration and extensibility play a crucial role in data analysis because they allow for seamless collaboration between different tools and packages, enabling you to perform a wide range of tasks.

A language with strong integration and extensibility features can easily adapt to new technologies and offer a more comprehensive set of functionalities for your data analysis projects.
Let’s compare both languages.
Python:
- Originally designed for software development, offering excellent integration capabilities and use cases
- Highly extensible with numerous libraries such as NumPy, Pandas, and Scikit-learn, which can enhance Python’s functionality in data analysis tasks.
- Facilitates interoperability by allowing you to run R code using the rpy2 package.
R:
- Focused on statistical computing, providing extensive support for data import from various formats like Excel, CSV, and SPSS.
- Offers web scraping capabilities through modern packages like Rvest.
- While not as versatile as Python, it has a rich ecosystem of packages for data analysis and visualization.
- Enables interoperability by letting you execute Python code using the reticulate package.
Syntax and Readability
Syntax and code readability are essential factors when choosing a programming language for data analysis, as they can significantly impact your learning curve and coding efficiency.
Clear and concise syntax enables you to write code quickly and reduces the likelihood of errors. Good readability makes it easier for you and others to understand and maintain your code, contributing to more effective collaboration.

Some of the key syntax differences between Python and R are:
Assigning Values to Variables
In Python, assigning values to variables is straightforward. You simply use the equal sign to assign values to variables.
Python:
x = 5   --> Assigns a value of 5 to x
Python is known for its simple and clean syntax, which contributes to its smooth learning curve.
On the other hand, R uses the assignment operator (<-) to assign values to variables.
R:
x <- 5     --> Assigns a value of 5 to x
This syntax is well-suited for statistical analysis tasks, providing more flexibility in code.
Indexing
Python utilizes zero-based indexing, where the first element is at index 0. This approach is common in many programming languages and might be more familiar to those with programming experience.
Python:
numbers_list = [1, 2, 3, 4, 5]

# Accessing the first element (zero-based indexing)
first_element = numbers_list[0]
print("First element:", first_element)

# Accessing the third element (zero-based indexing)
third_element = numbers_list[2]
print("Third element:", third_element)
Output
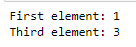
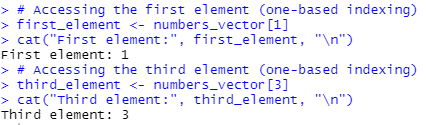
In contrast, R adopts one-based indexing, where the first element is at index 1. This indexing system is often preferred by statisticians and researchers due to its intuitive nature, aligning with the way humans typically count.
R:
numbers_vector <- c(1, 2, 3, 4, 5)

# Accessing the first element (one-based indexing)
first_element <- numbers_vector[1]
cat("First element:", first_element, "\n")

# Accessing the third element (one-based indexing)
third_element <- numbers_vector[3]
cat("Third element:", third_element, "\n")
Output
Loading and Importing Libraries
To import libraries in Python, you use the import keyword. This simple and consistent method makes it easy to integrate additional functionality into your Python code.
Python:
import numpy as np
R requires the library function to load libraries. The syntax is different but it has the same function as import in Python.
R:
library(stats)
The Final Word
When comparing R and Python, each language offers unique strengths suitable for various data analysis tasks. To decide which language to choose, consider your objectives, background, and preferences.
R provides specialized experiences with extensive packages for data manipulation and visualization, making it a suitable choice for those focused on statistical programmings, such as statistical tests.
Python attracts a wider audience. Its popularity results in a larger community, diverse resources, and broader job prospects, making it more familiar for those experienced in general-purpose programming languages.
Keen to learn more about R and Python? Check out our range of Free Training Courses and join over 220,000+ global people trained in our data skills community.


