This Power BI Showcase features comprehensive Power BI workforce planning reports that go in-depth into employee data and human capital analytics. You may watch the full video of this tutorial at the bottom of this blog.
The examples will be focusing on a large enterprise which has been around for 30 years.
We’ll be focusing mainly on this company’s latest years where they’ve experienced significant business growth.
The amount of calculations and simulations within this data model allow us to extract insights that someone in the HR department or management would find useful to improve employee engagement and performance.
This showcase is broken down into four reports.
Employee Data Summary
The first report allows us to dive into all the key metrics that we’d want to know about our employees.
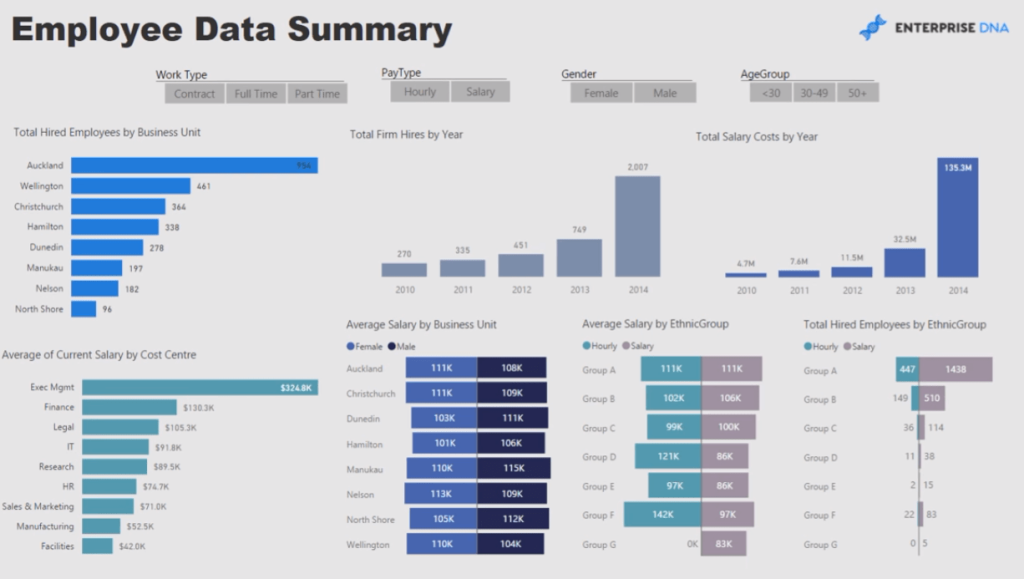
These metrics could be in terms of their location or area assignment, function, and performance growth.
For this example, we can see that this firm has grown substantially over the last few years, not just in the number of personnel, but also in terms of salary costs.
We can see the average salary comparison between males and females, and analysis between ethnic groups which are key ratios that are prevalent in many organizations.

The slicers in this report allow us to dynamically filter the information to get the insights we require.
For instance, we can easily focus on our employees under 30 and how they’re tracking versus the employees who are 50 years old and above.
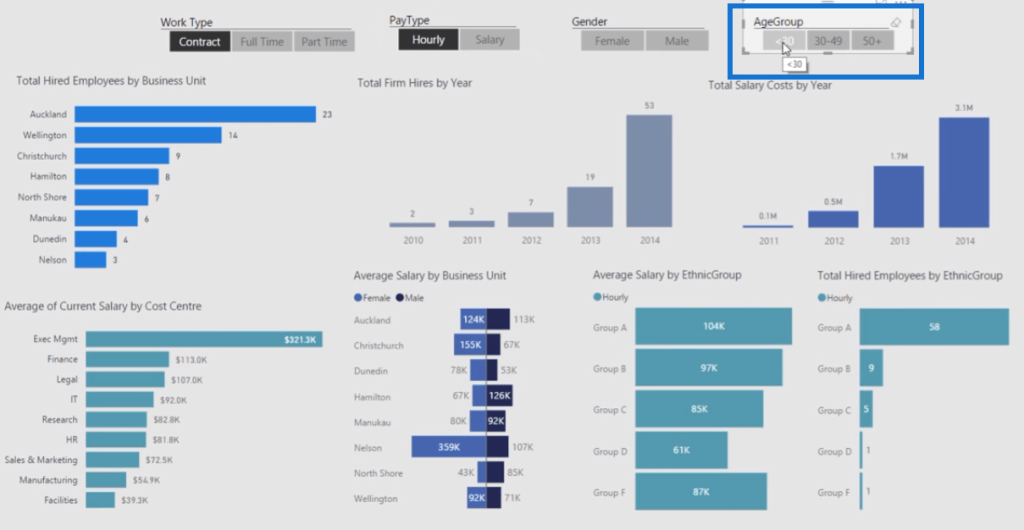
The ability to get down to the answer we need is a significantly powerful tool within this Power BI reporting model.
Business Units & Cost Centers
The second report dives into individual business units and cost centers.
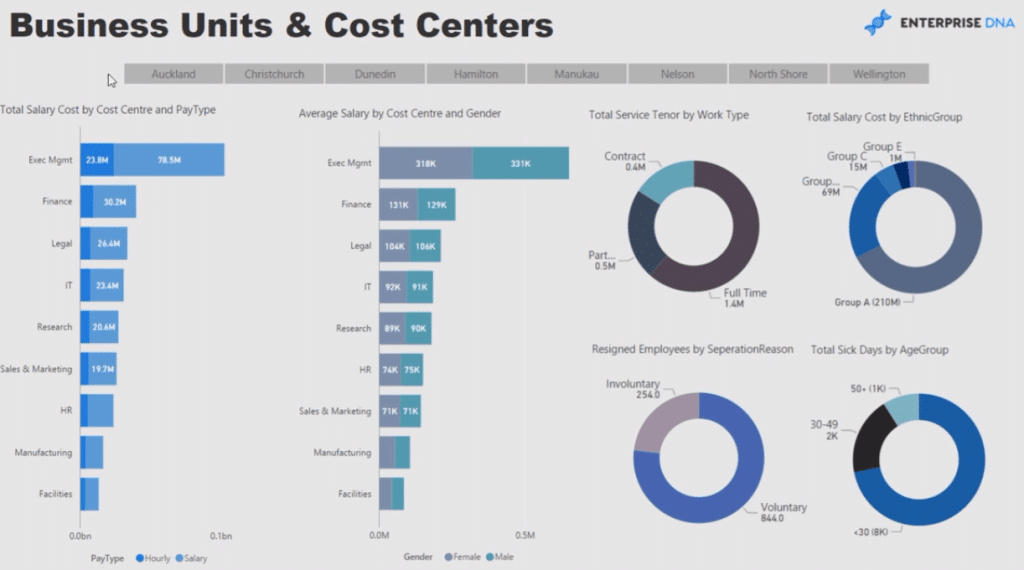
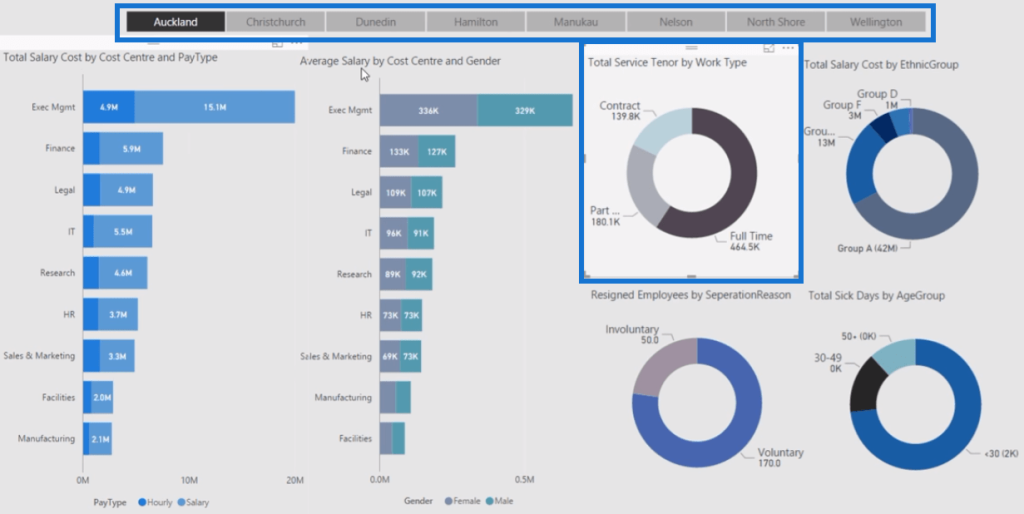
Using the filters allows us to easily drill down into a specific business area or subsidiary.
We could look at Auckland’s full-time employees and see the Total Salary Cost and Average Salary Costs for that area and group.
Gender & Ethnicity
This next report provides detailed information on the gender and ethnicity clusters within the business.
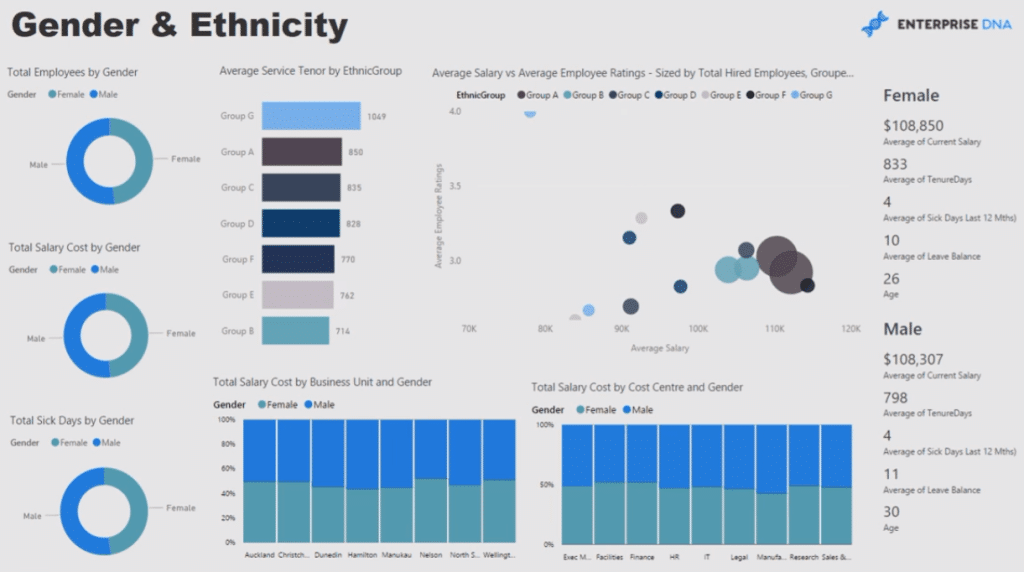
We need to understand our employee composition because this is a crucial step in maximizing human capital potential.
The analysis we get from this report enables us to get a good overview of the events happening within the entire organization.
We can get a look at employee salary versus the average employee rating.
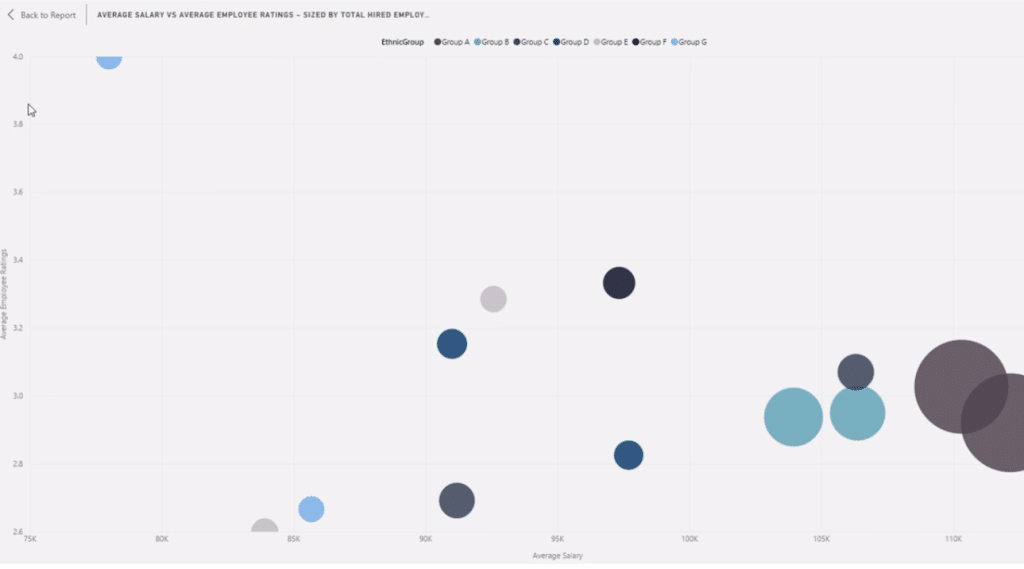
With this, we can analyze whether the employee reviews were biased.
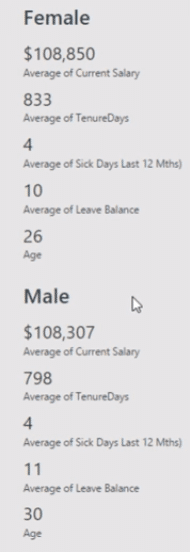
This report also has a good breakdown of the metrics between female and male groups.
We can also click on a specific ethnic group:
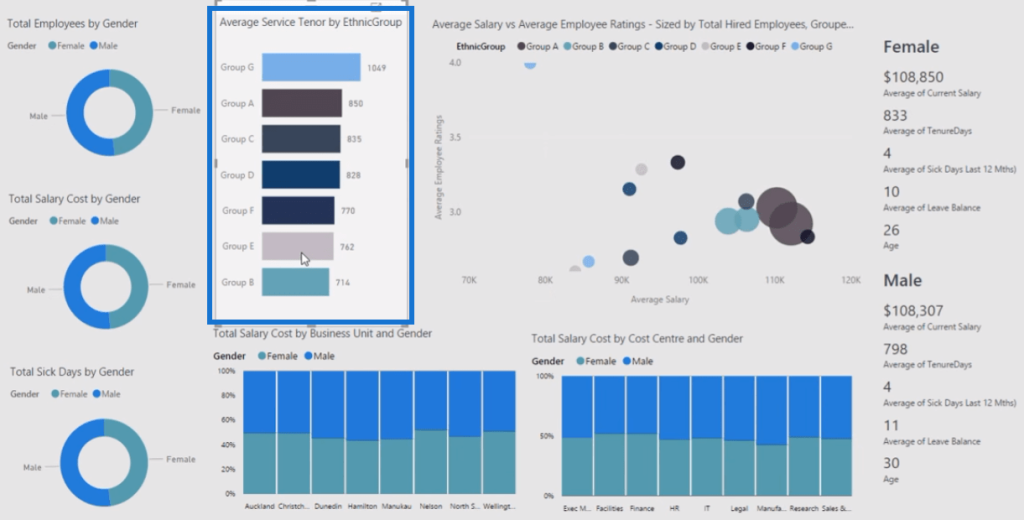
This dynamically updates the other information within the report.
Human Capital Simulations
The last report uses DAX to create various scenarios on workforce arrangements.
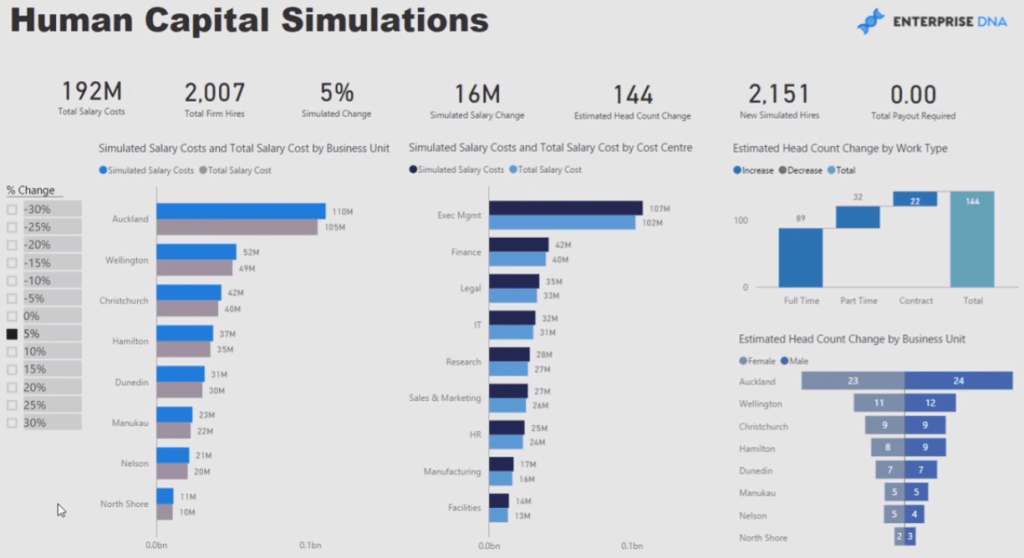
If a company wants to downsize or upsize their human capital, it needs to understand the additional costs or the reductions that could be achieved with the resizing.
We need to make sure that we’re keeping our ratios intact throughout the organization.
As an example, we’ll look at what happens to the business when we downsize the workforce by 20%.
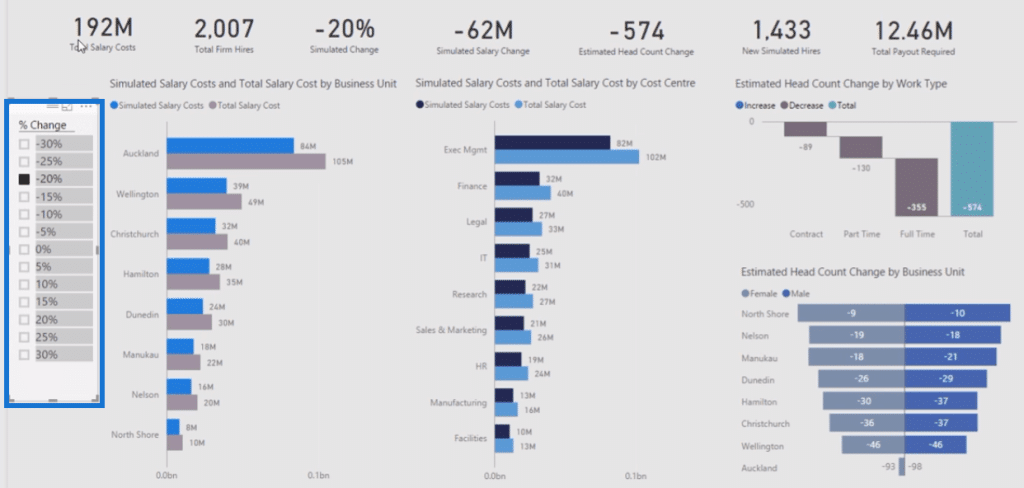
Before the downsizing, we can see that the current Total Salary Cost is 192 million and the Current Total Hires is 2,007.
Once the workforce was reduced by 20%, the Total Salary Cost was deducted by 62 million with the remaining of 1,433 hires.
This seems like a good step to minimize cost; however, the company may need to pay for redundancy.
Using this simulation, we can automatically figure out how much we’d have to pay to our current employees due to the downsizing.
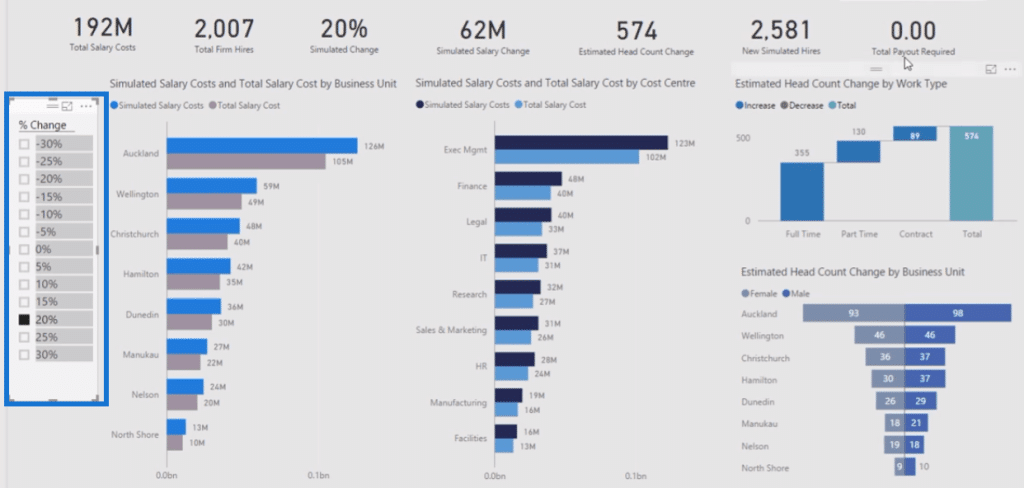
We can also look at what would happen if we choose to upsize by 20%.
***** Related Links *****
How Many Staff Do We Currently Have – Multiple Dates Logic In Power BI Using DAX
Developing Sensitivity Analysis Logic Using DAX In Power BI
Using Multi-Layered Scenario Analysis In Power BI
Conclusion
The Power BI workforce planning reports featured in this Showcase are great sources of insights on human capital and workforce management.
Scenario analysis and the ability to simulate varying organizational changes aids in the creation of effective operational strategies.
These insights can be used by the management or CEO to make a reasonable decision that gives the best cost-benefit analysis for the business.
All the best,
Sam
[youtube https://www.youtube.com/watch?v=zvSwiijWwd4&feature=youtu.be?rel=0&w=784&h=441]


