
I’m huge on scenario analysis in Power BI. Being able to input variables inside your calculations that you can ‘shock’ to effectively predict outcomes is so powerful when trying to make decisions. You may watch the full video of this tutorial at the bottom of this blog.
In Power BI you can complete this really efficiently, and you can combine many of the formula techniques with your data models and exponentially see how future results could be impacted across a range of dimensions.
Since the recording of this video, the Power BI team have actually made it even easier to create ‘What If’ parameters which is great, so that will speed things up for you.
But what I really wanted to showcase here was how you can layer scenarios one on top of the other. This grows your analytical power immensely.

Let’s just walk through one example.
When Can You Use Scenario Analysis In Power BI?
You might want to run a promotion and decrease prices. As a result, the demand for your products may increase.
With that pick up in demand you may be able to arrange a lower cost on your inputs, and you can now buy bulk. You see what I mean.
You can layer all these scenarios one after the other and then see, based on your forecasts, how that might change things or impact your profitability.
But before actually diving into how we can actually layer multiple scenarios using DAX, let us first review the data that we’re going to use in this demo.
Reviewing The Data Model And The Slicers
Just to give you a bit of a background on the data that we are working on here, let us take a quick look at our data model. I have set this up in advance instead of working on everything from scratch to save us time.

So basically, we are working on sales data. We also have information about our customers, our products, as well as the regions where we made sales and the dates when the transactions occurred.
And as you can see, we have supporting tables here for price changes, cost changes, and demand changes.
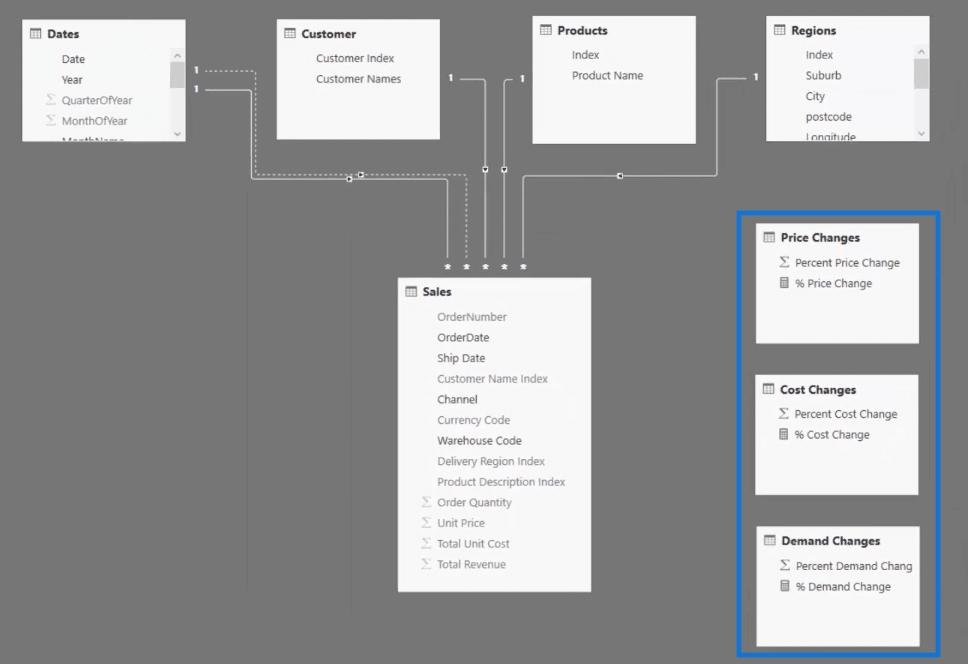
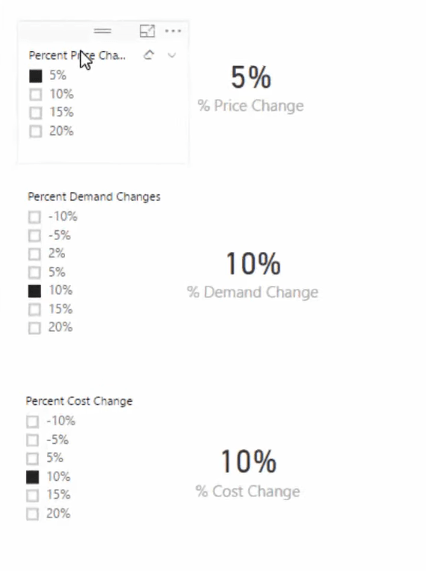
We’re going to use these three supporting tables as slicers and then bring in the calculation into our analysis.
Let us just check out our formula for the Percent Cost Change.
What we’re saying here is that IF has one value then percentage cost change–it can be average or sum. This means that if we have selected one option in the Percent Cost Change such as 10% or 15% for example, return the result.
But then if it is zero, meaning if nothing is selected, then what we’re saying is that there is zero change to costs.
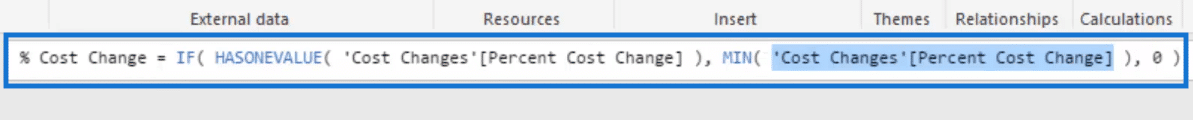
Creating the Percent Price Change and the Percent Demand Change formulas will require a similar pattern so we will no longer discuss the other two.
Using Iterators In Multi-Layered Scenario Analysis
To actually do multi-layered scenario analysis in Power BI, we need to use some iterating functions.
Let me show you why this is needed by looking at Total Sales.
Why We Need To Use Iterators
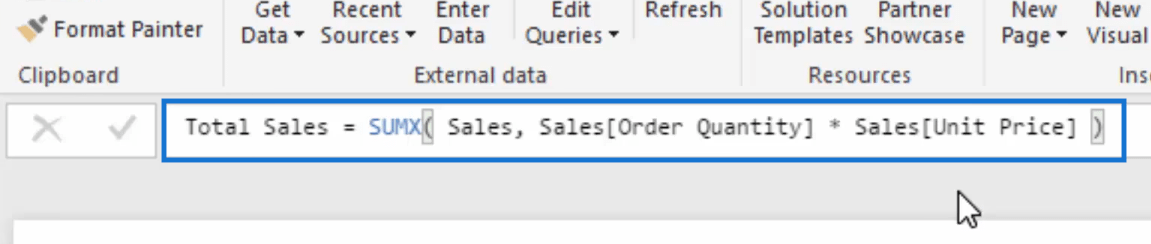
We have here below our Total Sales formula.
What it does here is it calculates the SUM of the Total Revenue.
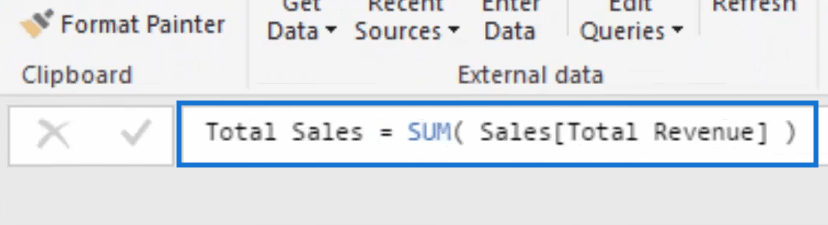
The problem with this formula, however, is that we cannot incorporate other variables that affect the Total Revenue.
For example, what if the demand increases? How will that affect our sales? How about when the unit price increases? We need to be able to factor these in.
Therefore, let us revise our formula using the iterating function SUMX.
Using SUMX In The Total Sales Formula
So we got our Total Sales formula here. But instead of SUM, let us now use SUMX, then Order Quantity and then multiply that by the Unit Price.

Using Scenario Analysis in Power BI
At this point we have already reviewed our data model and the slicers that we’re going to use. We have also discussed why we need iterators.
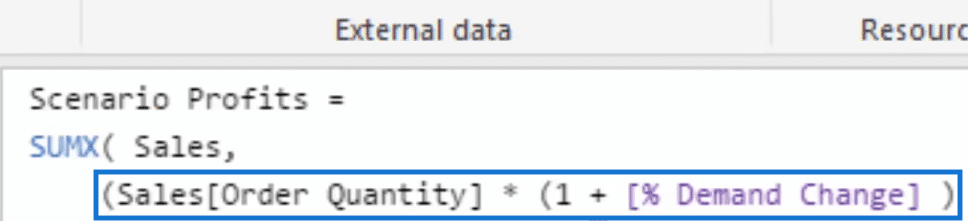
Let us now create a new measure and call it Scenario Profits.
Then let’s add Order Quantity and times it by one plus the Demand Change. What happens here is that when the demand changes, it will shock the quantity up.
Then let’s jump down to another line. We’re going to multiply by the Unit Price times by 1 plus the Price Change. Now, if the price increases, it’s going to shock the unit price.
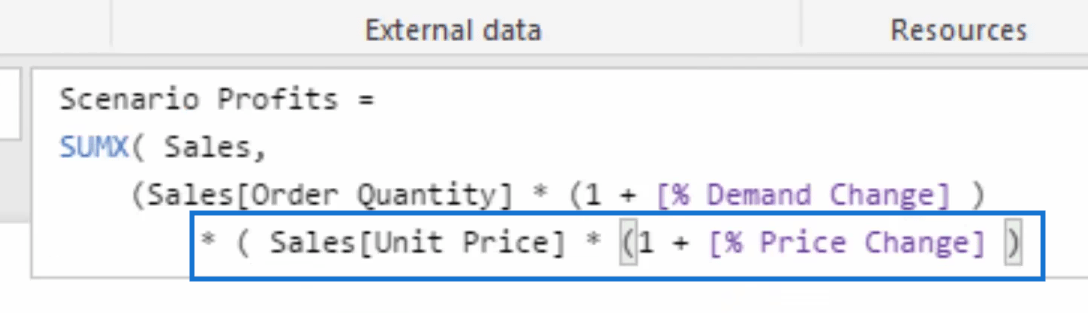
Therefore, changes in price and changes in demand can shock the Total Sales.
But our formula does not stop here. We still need to factor in the cost.
So that would be minus SUMX, then go to the sales table, then Order Quantity times 1 plus the Demand Change and then times the Total Unit Cost times 1 plus the Cost Change.
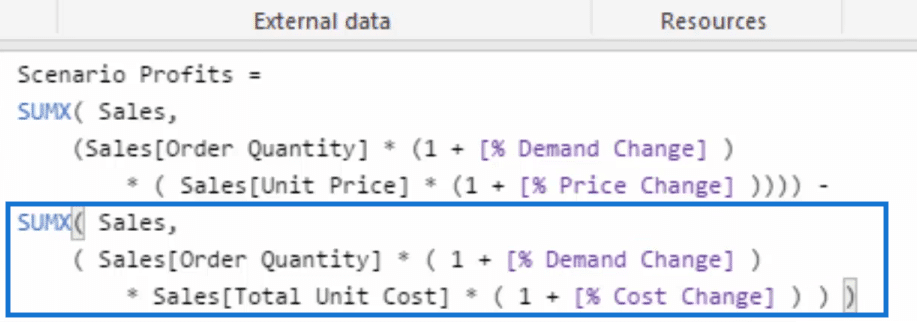
Then we’re going to close it off.
Now let’s see how our Scenario Profits formula works.
Checking The Formula
To double check our formula, let us create a table with the Scenario Profits and the Month & Year.
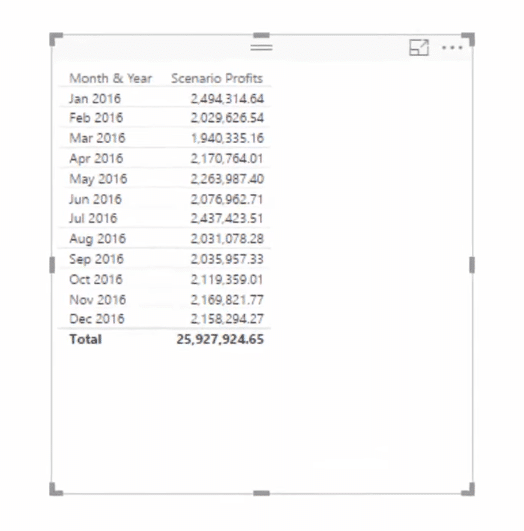
If we select nothing in our slicers, our table will simply show the total profits for 2016. Our table shows only the 2016 figures because only this year is filtered.
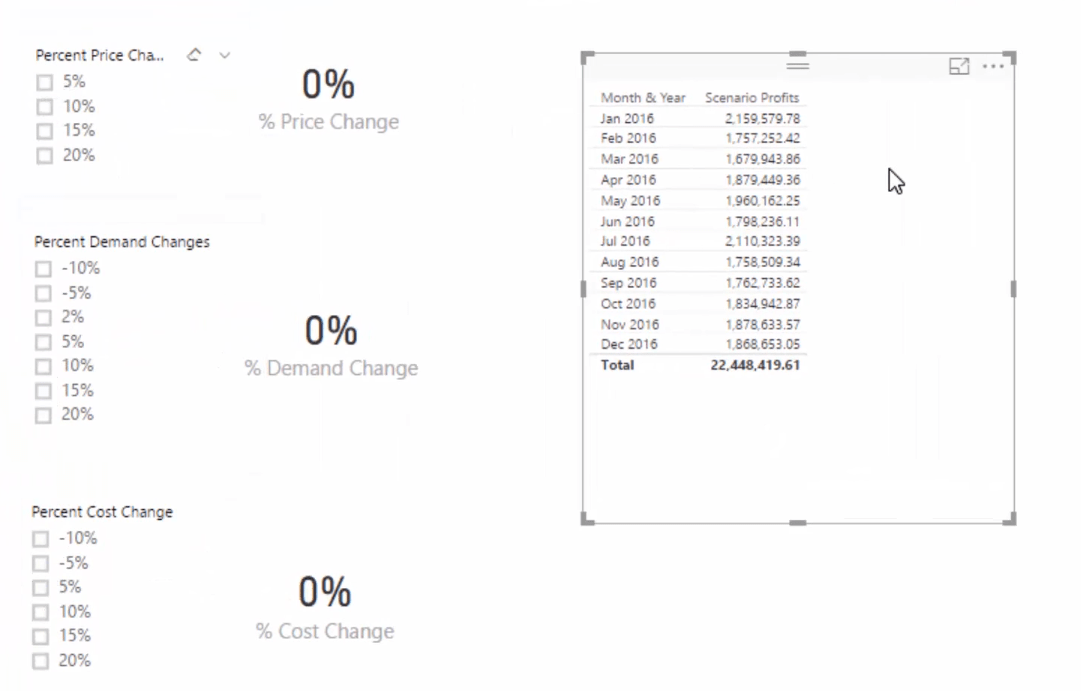
Now, let’s take a look at possible scenarios.
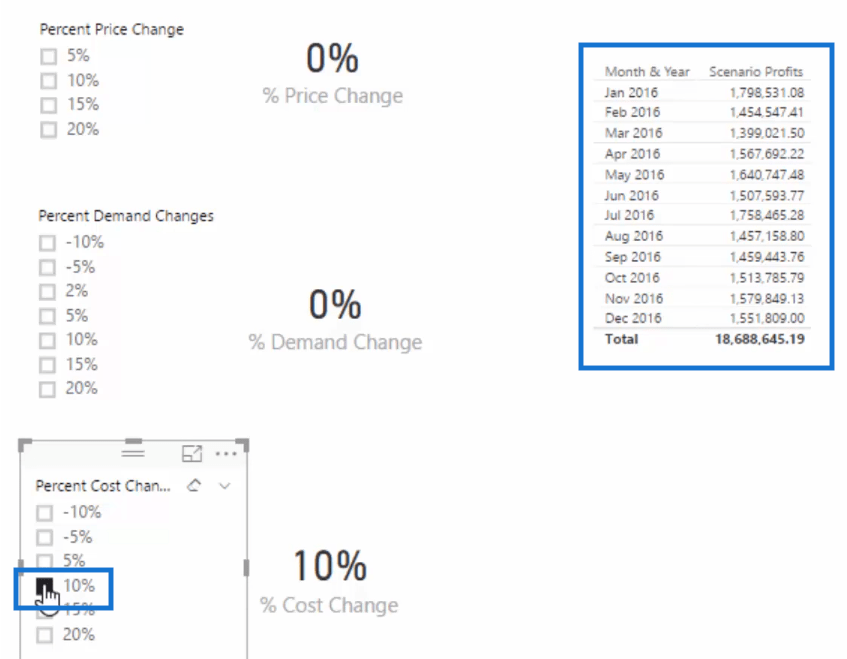
For example, the cost of our raw materials increases by 10%, this is reflected in our Scenario Profits.
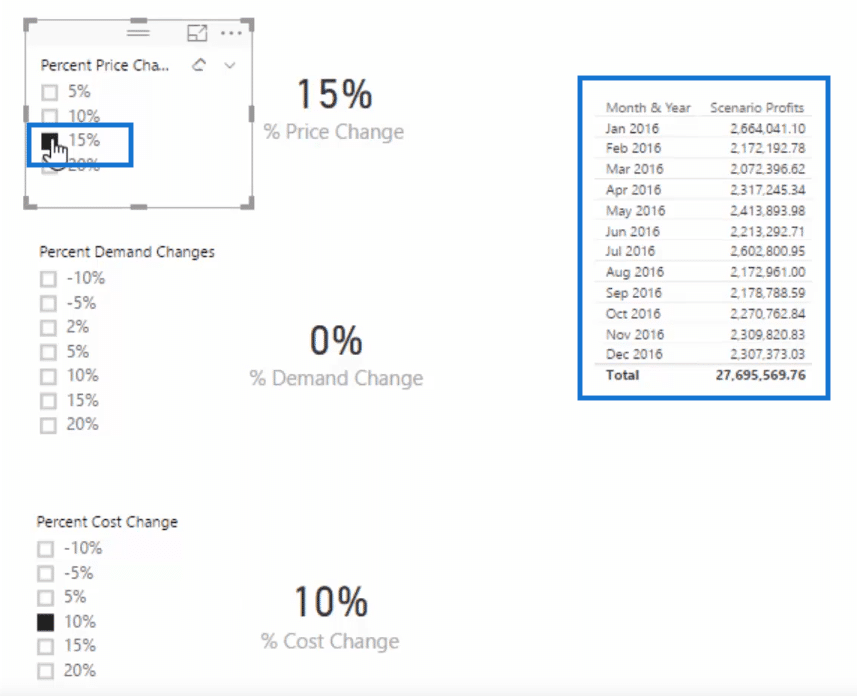
But then we know that this increase in cost is going to affect our price. So let’s say we’re going to increase the price by 15% as a result of that increase in cost.
Again, this change in price is reflected in our Scenario Profits.
But since our price increased, this may then reduce our demand. So, for example, our demand decreases by 5%. Needless to say, our Scenario Profits is also reduced.
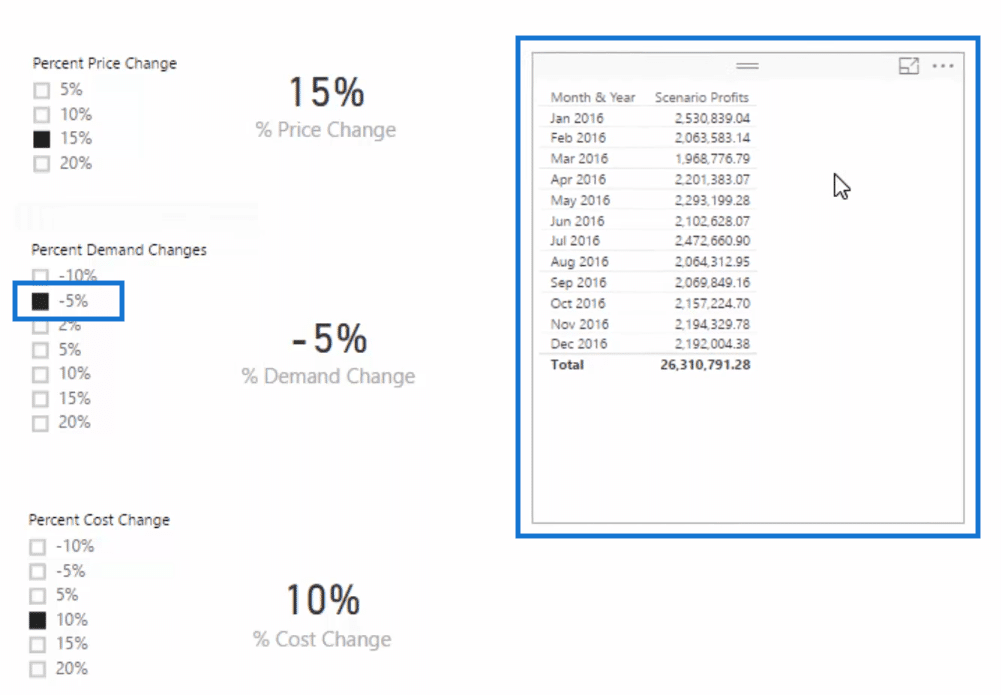
As we have seen, all of the changes in the percent cost, percent price, and percent demand affect the scenario profits because they are brought into the analysis.
***** Related Links *****
Creating Multi Threaded Dynamic Visuals – Advanced Power BI Technique
Using Variables in Power BI – A Detailed Example
Scenario Analysis Techniques Using Multiple ‘What If’ Parameters – Advanced DAX
Conclusion
In this post we have briefly discussed how to create multi-layered scenario analysis in Power BI.
Hopefully you can find the time to really dive into this technique. There is an immense number of applications of this across any data scenario.

Once you can get your mind around how you can integrate measures capturing the scenario parameters into measures that are running calculations across your core data model, then you will see unlimited opportunities to discover predictive insights into the future.
Good luck with this one.
Cheers,
Sam


