Page navigation is important in Power BI reports to leverage performance and user experience. On the other hand, bookmarks let you save the currently configured views and settings in your reports. In this tutorial, I’ll discuss how to get navigation ideas for your Power BI interactive reports. I’ll also explain how to create and manage your bookmarks.
Sample Navigation Idea For Power BI Interactive Reports
Many people are struggling to find creative navigation ideas for Power BI interactive reports. But honestly speaking, you can just browse through various websites and you’ll see that page navigations are everywhere.
In this report that I created, I found this navigation idea through my personal computer.
For example, I tried to put this color in my report.

However, the theme of my report was quite different. So, I blended it with a different color.
In this example, I used the Windows icon in my computer with a screenshot tool.
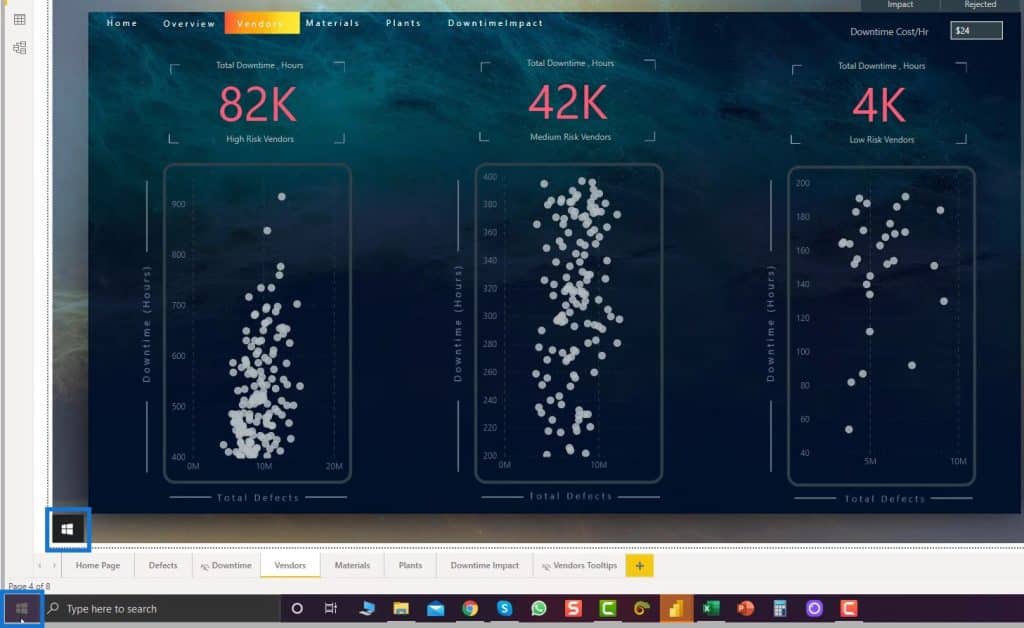
I also captured a screenshot of this blank background.
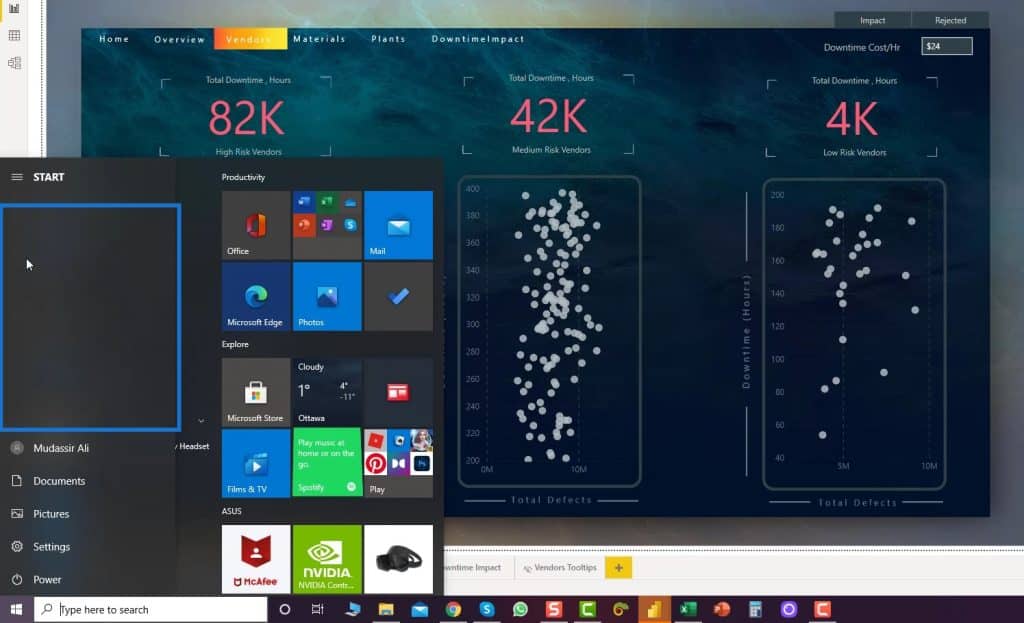
I used this for my navigation and tooltip.
If you want to get some icons for your navigation, you can go to the flaticon website.
From there, you can also edit the icons and change their color by clicking the Edit icon button.
You just have to sign up for this website to modify and download your icon.
If you go to the Enterprise DNA website, you can also find some navigation ideas. One example is this pop-up chatbox. If you want to show a certain insight in your report, you can definitely use this.
Then, if you want to show some key insights, you can use this feed.
Using Headings As Your Navigation In Power BI Reports
Another cool thing you can do is to make your headings as your navigation. For example, I haven’t used any icon here. Instead, I used headings on the report.
If I click on a heading, it will take me to the corresponding page.
Then, if I click 01 on the upper right corner, it will take me back to the homepage.
In this tutorial, I just presented some of the most basic ideas.
The next thing that I’ll be showing is how to create and manage bookmarks in your Power BI interactive reports.
Page Navigation Bookmarks For Power BI Interactive Reports
Bookmarks are used to store the currently configured view of a report page, including filters, slicers, and the state of visuals. You can then refer to that captured state when you select the corresponding bookmark. The easiest bookmark that you can create is page navigation.
1. Adding The Icon
Any image that you will insert in Power BI can now handle bookmarks. For example, I’ll insert an image here.
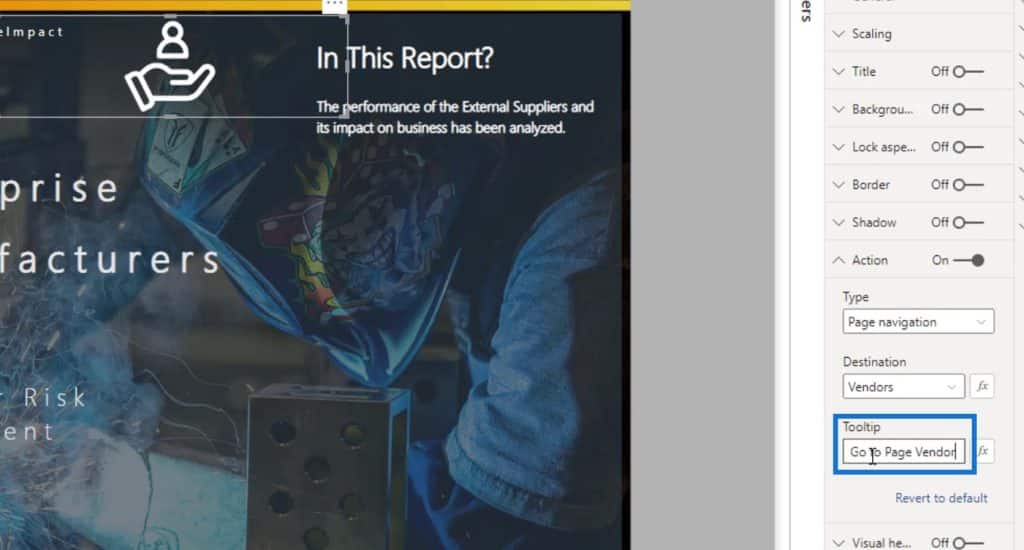
I can create a page navigation with this image by enabling the Action option under the Format image section.
Set the Type field to Page navigation.
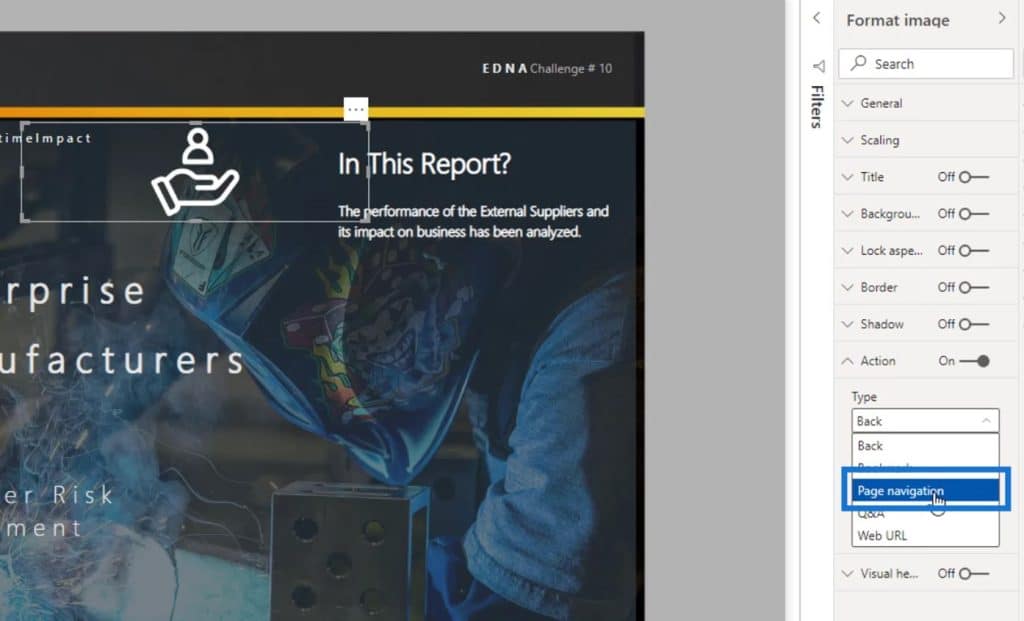
Then, select the destination of this page navigation on the Destination field. For this example, I’ll choose the Vendors page.
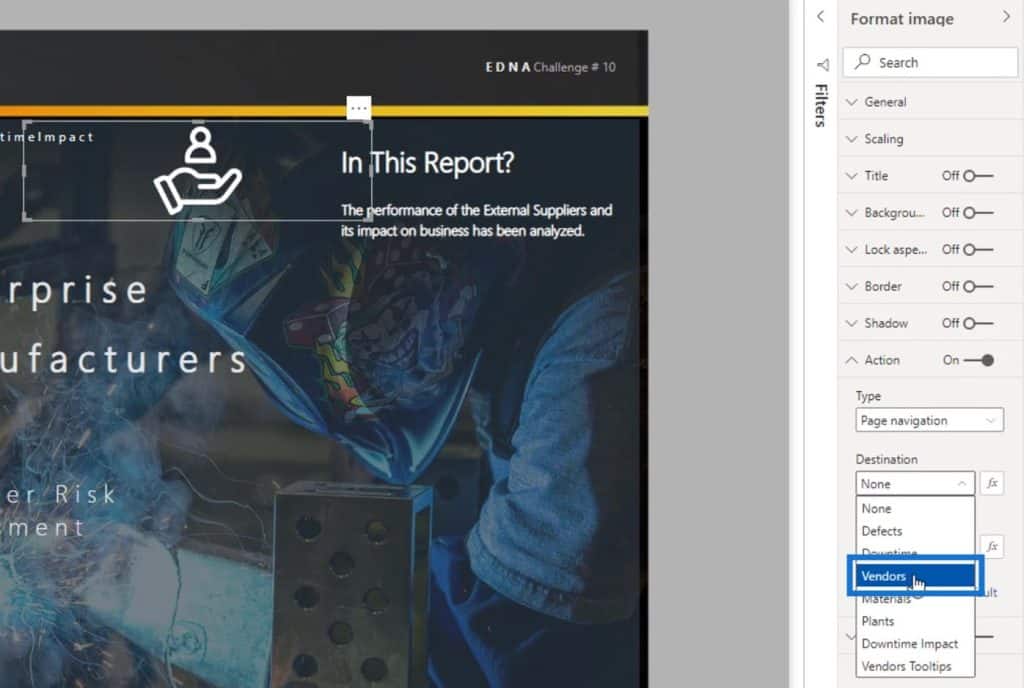
2. Adding A Tooltip
Tooltip is the text that will appear when you hover over a certain item. By default, it will show “CTRL + click here to follow link”.
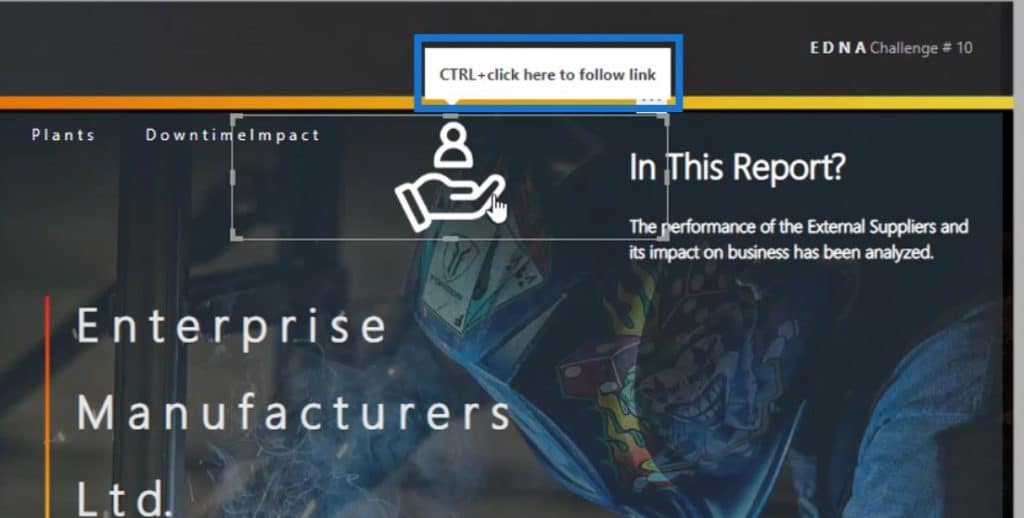
It will be good if we put some indication to our page navigations. This is to let our end users know where this certain navigation will take them.
So, for this example, I’ll type “Go to Page Vendor”.
If I hover over the image icon, it will display that text.
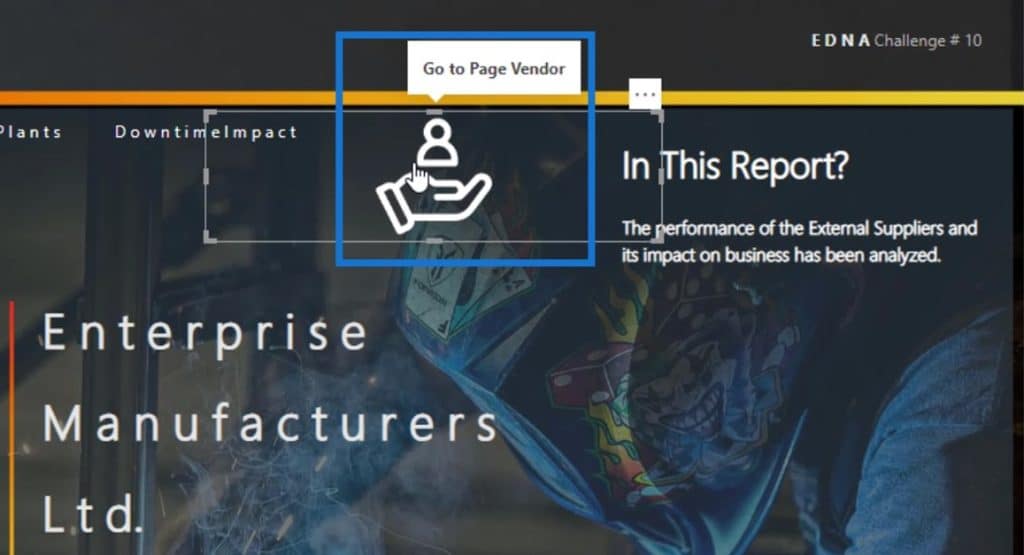
If I click on it, it will then bring me to the Vendors page.
Sample Complex Bookmark For Power BI Interactive Reports
Other bookmarks are quite complex. For example, this Windows icon is for a navigation panel.
If I click on this image, it will display my navigation panel.
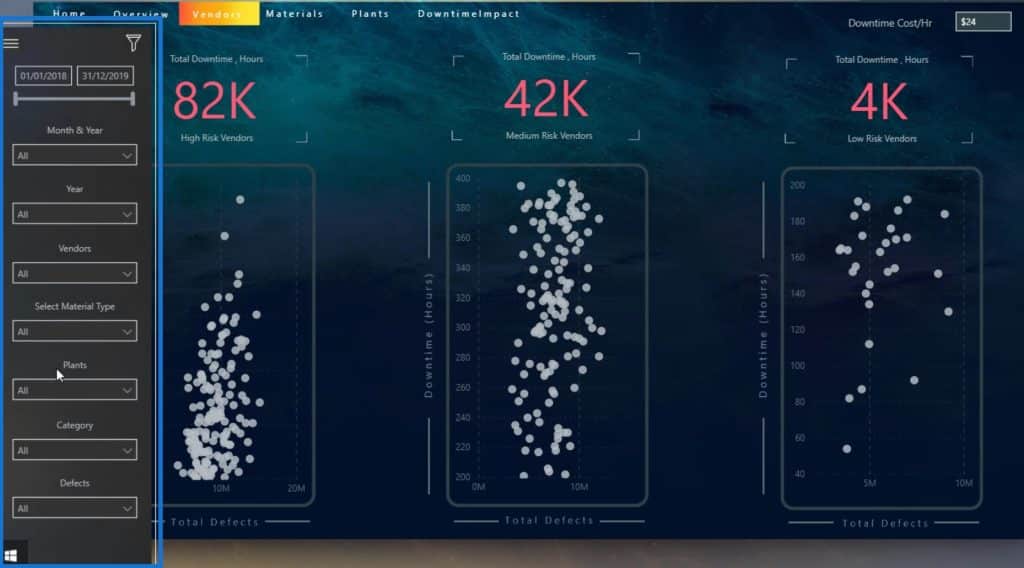
You can effectively manage your bookmarks by going to the View tab, then by clicking the Selection option.

In the Selection pane, you can see the layers or layer order of your bookmarks or navigation.
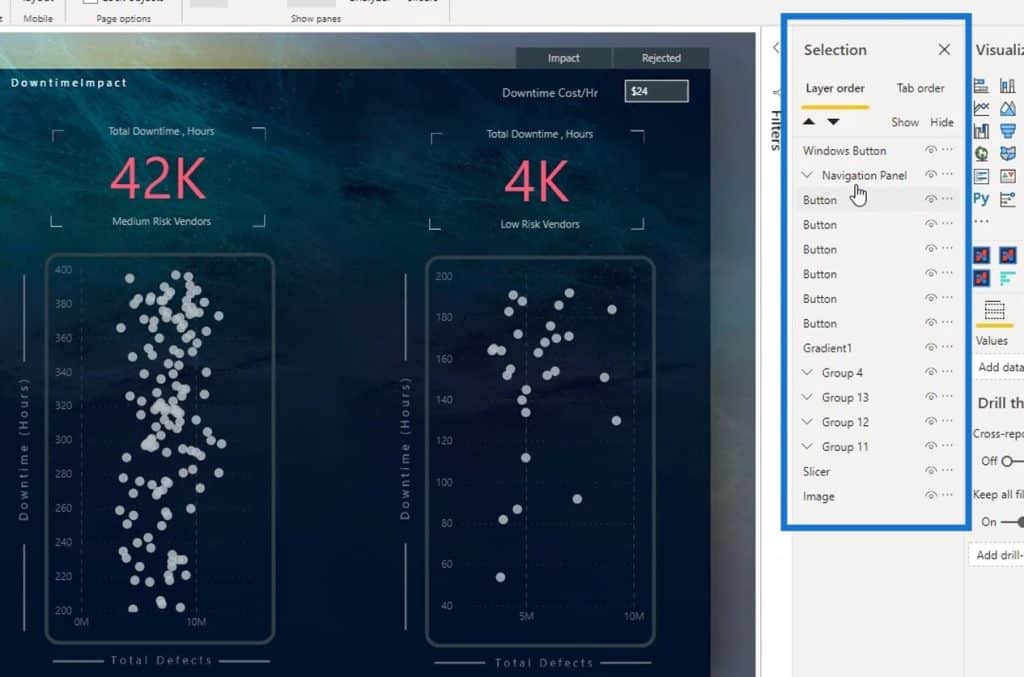
If I click on the Navigation Panel in the Selection pane, it will also select the navigation panel on the report page.
Additionally, I can group and rename the elements/objects of my navigation or bookmarks in the Selection pane.
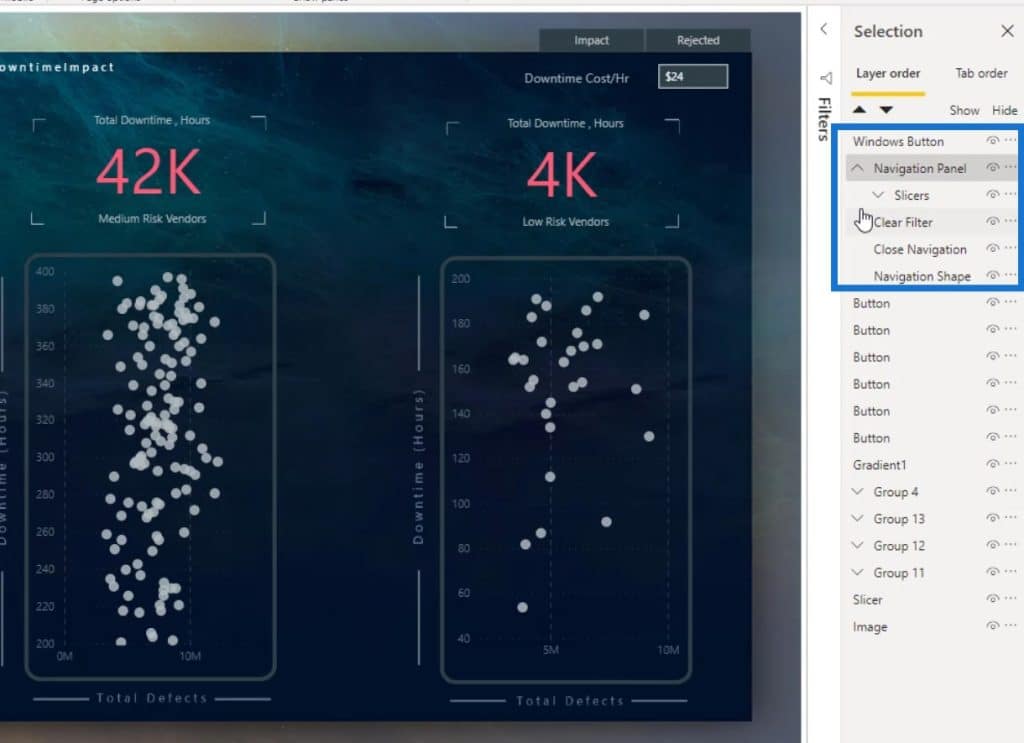
It’s also possible to arrange the visibility of the objects or elements that you want to display. For this example, the Windows button is the image on the report page that displays the Navigation Panel.
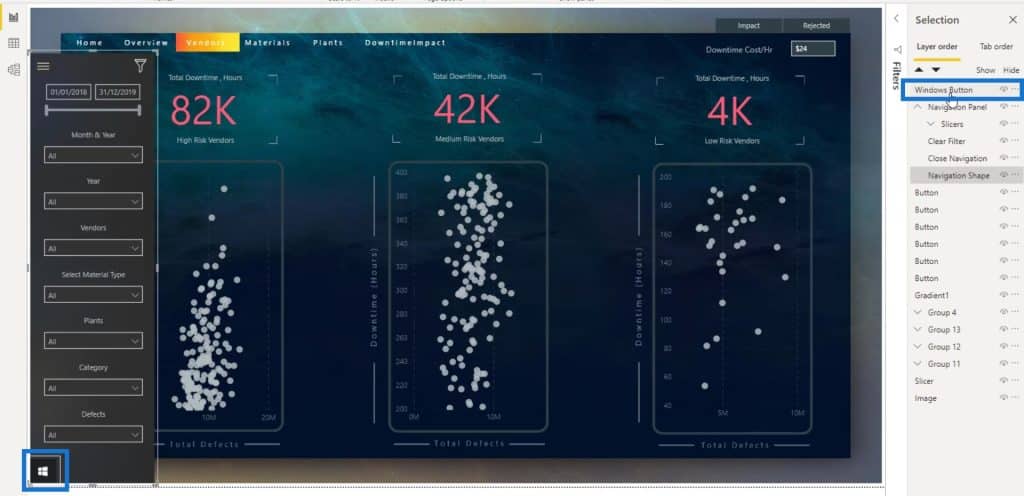
If I drag it below the Navigation Shape layer, you’ll see that it will be hidden. This is because the windows icon is now behind the navigation panel.
Recreating The Navigation Panel
I’ll recreate the navigation pane to help you understand more about the Selection panel and for you to learn how to create complex bookmarks.
I left a copy of these 3 objects here so I won’t need to import them again.
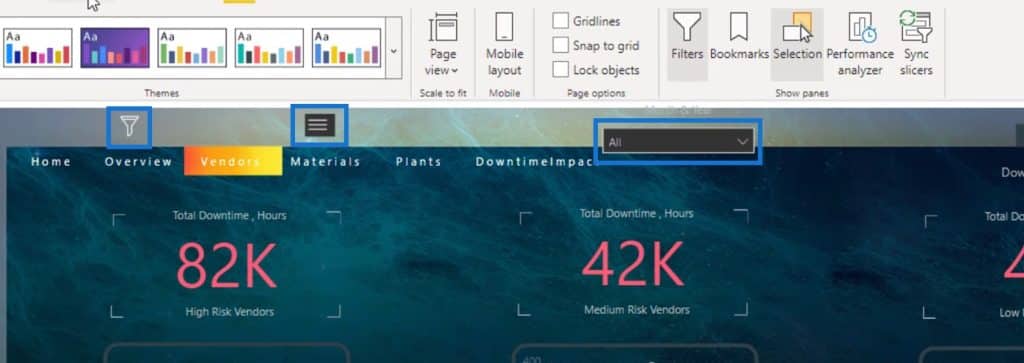
1. Inserting And Modifying The Windows Icon
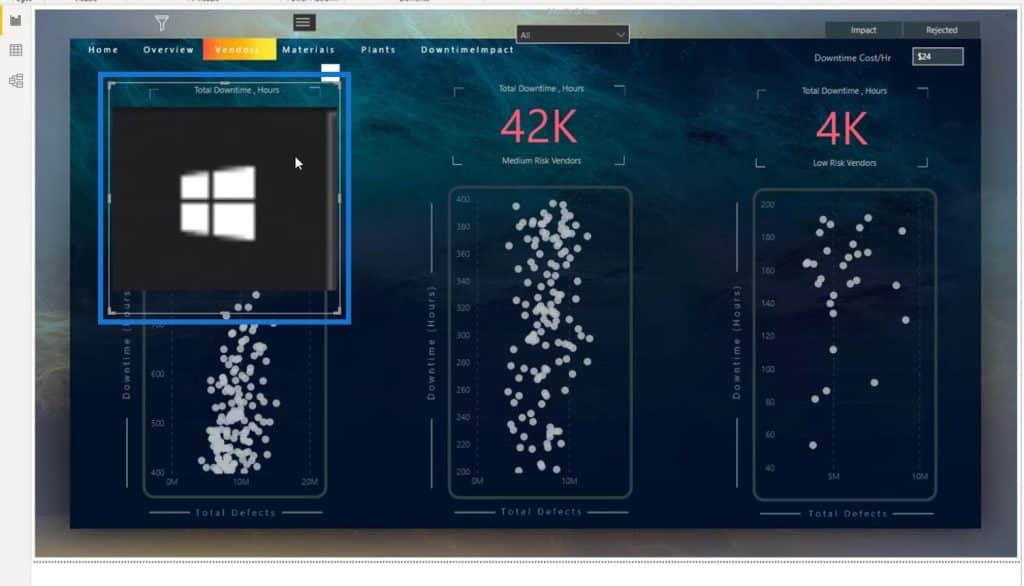
First, I inserted the Windows image.
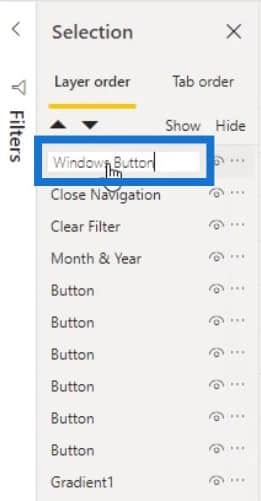
Then, I renamed this image as Windows Button.
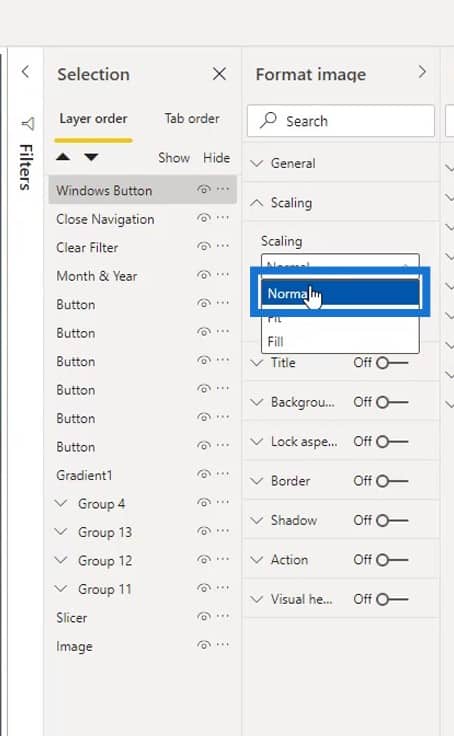
To make it look better, I set the Scaling to Normal.
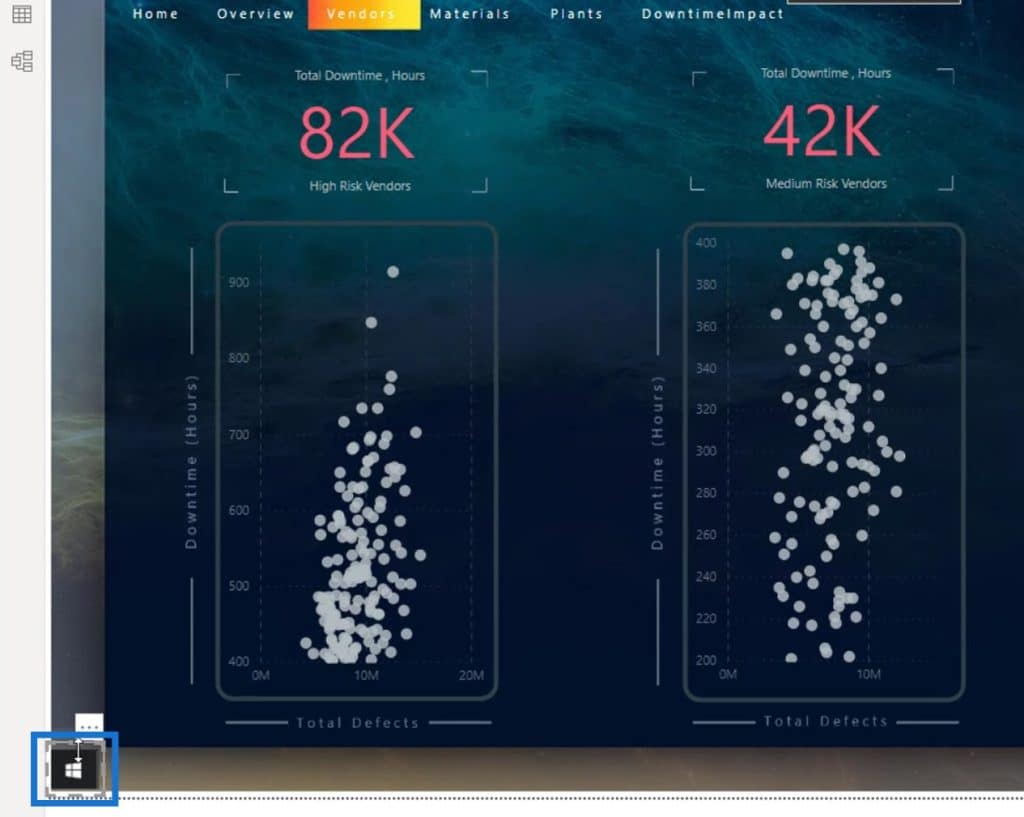
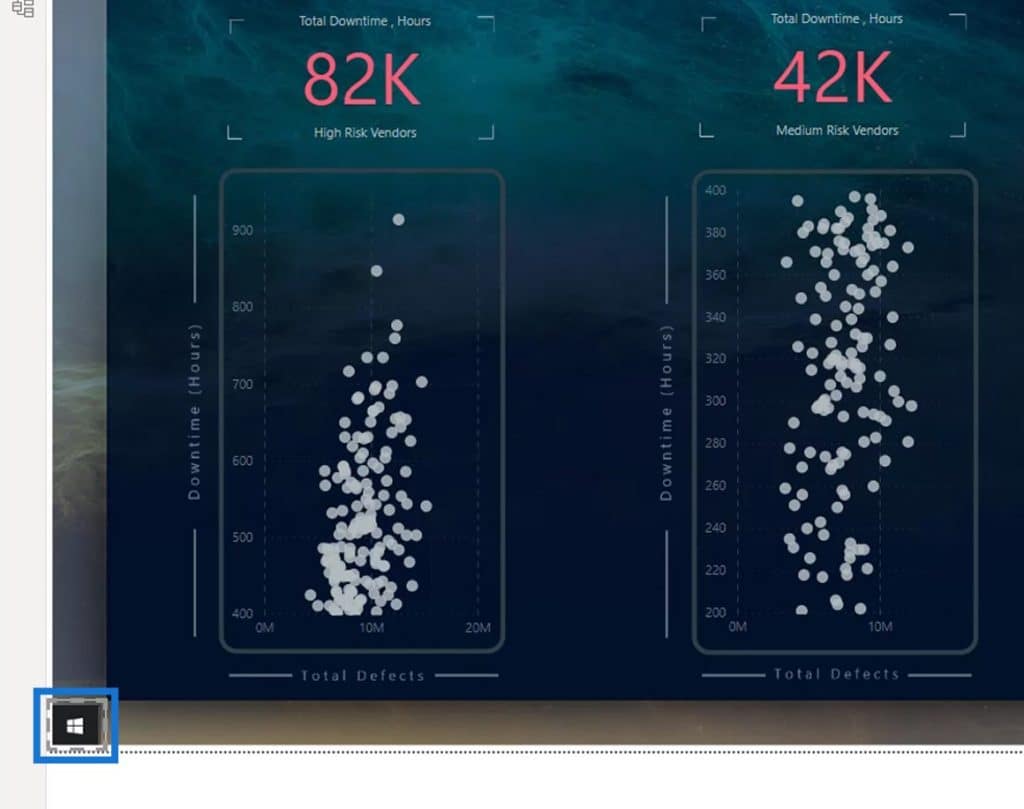
I resized it to make it smaller. Then, I positioned it at the bottom left corner of the page.
I also made this visual header transparent.
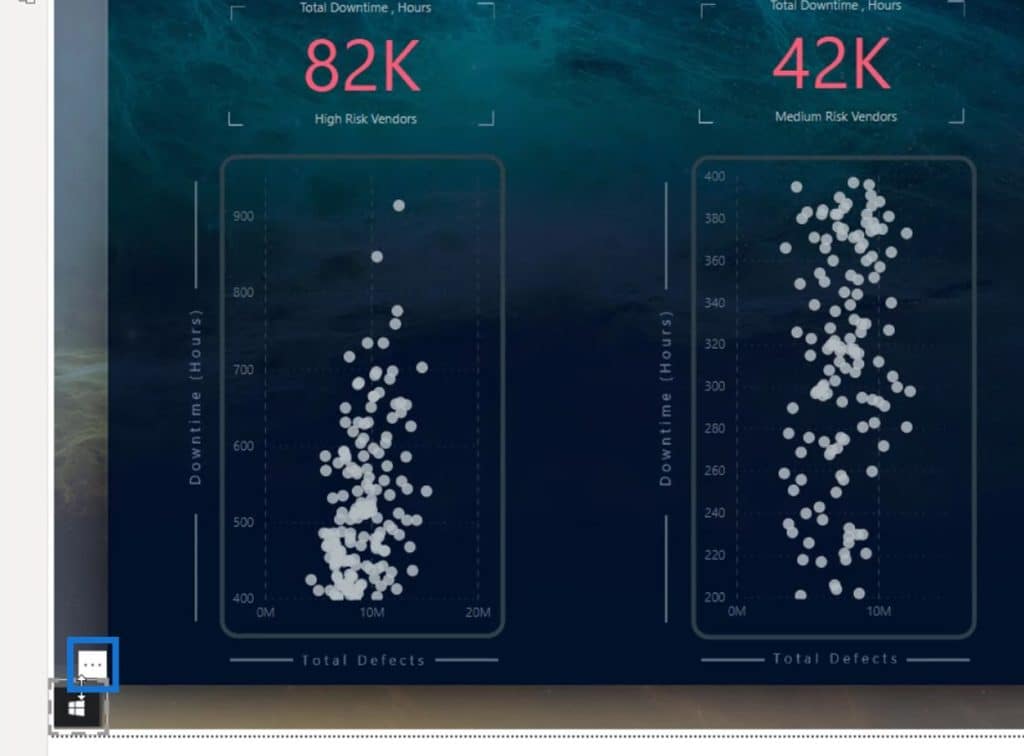
To do that, I enabled this part here.
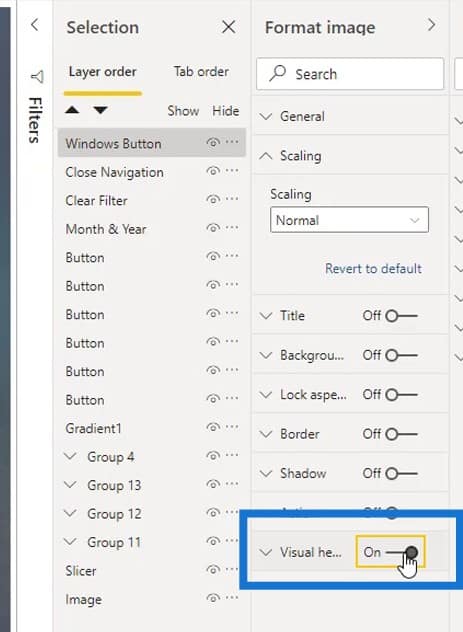
I set the Transparency to 100%, and disabled it again.
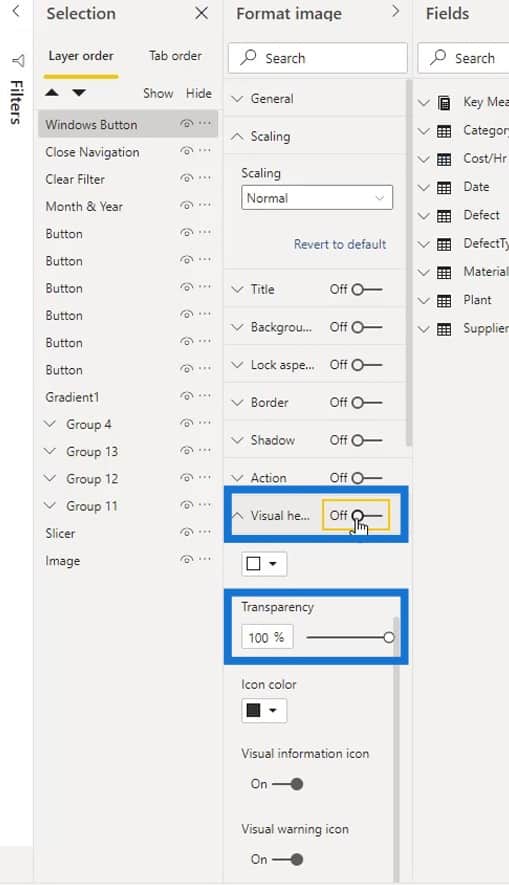
Now, it looks cleaner because the visual header is already hidden.
2. Inserting And Modifying The Background And Other Elements
After that, I inserted the navigation panel background.
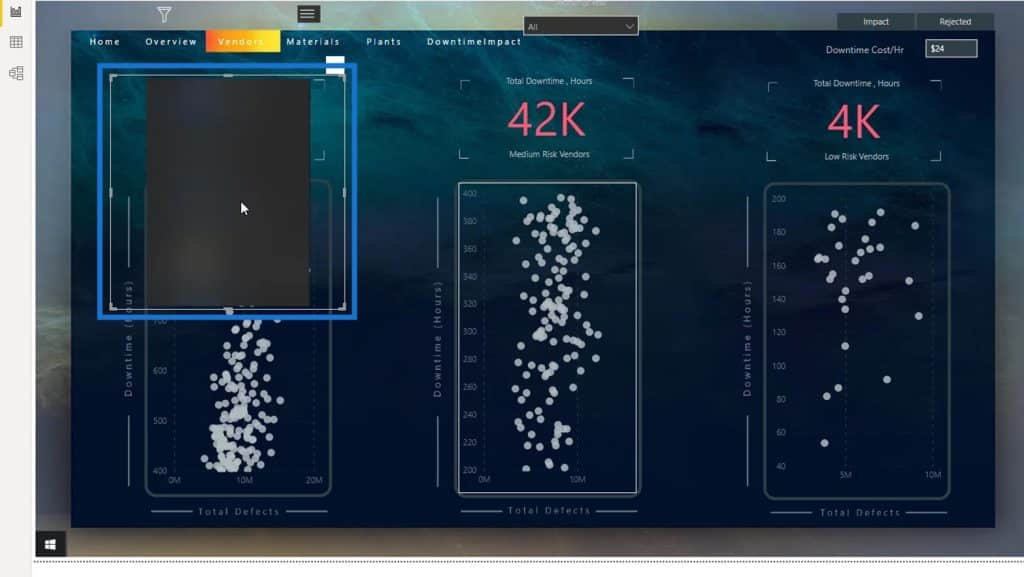
It’s also better to make the visual header transparent. Just enable it here, set the Transparency to 100%, and disable it again.

I chose Fit for the Scaling option.

Then, I resized it.
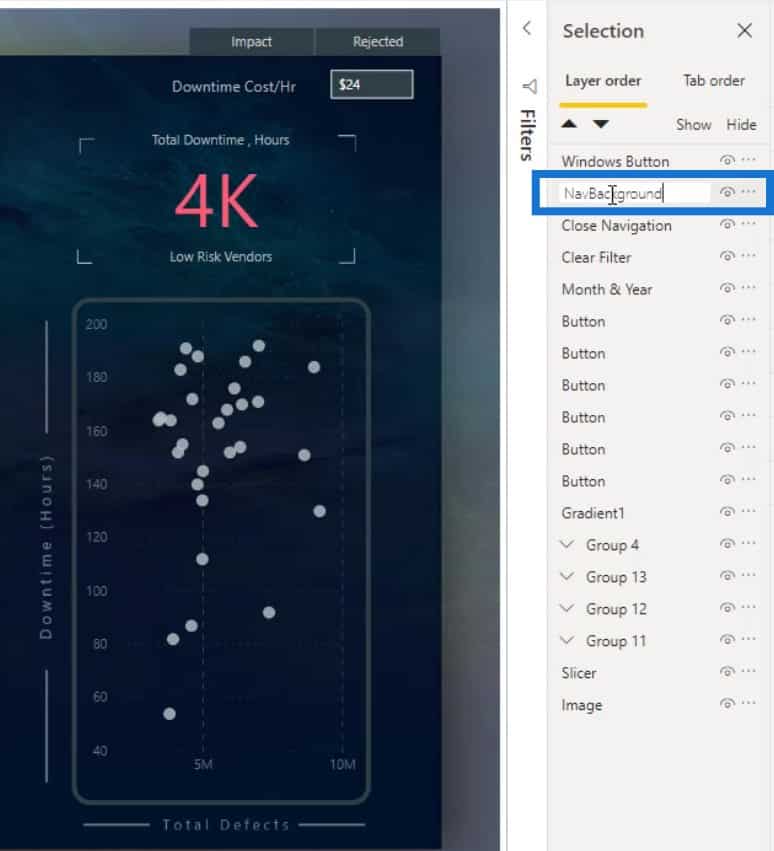
My Windows button is hidden because it is behind the shape. So, in the Selection pane, I dragged the Windows button on top of the Image layer to make it visible.
Then, I renamed the Image layer as NavBackground.
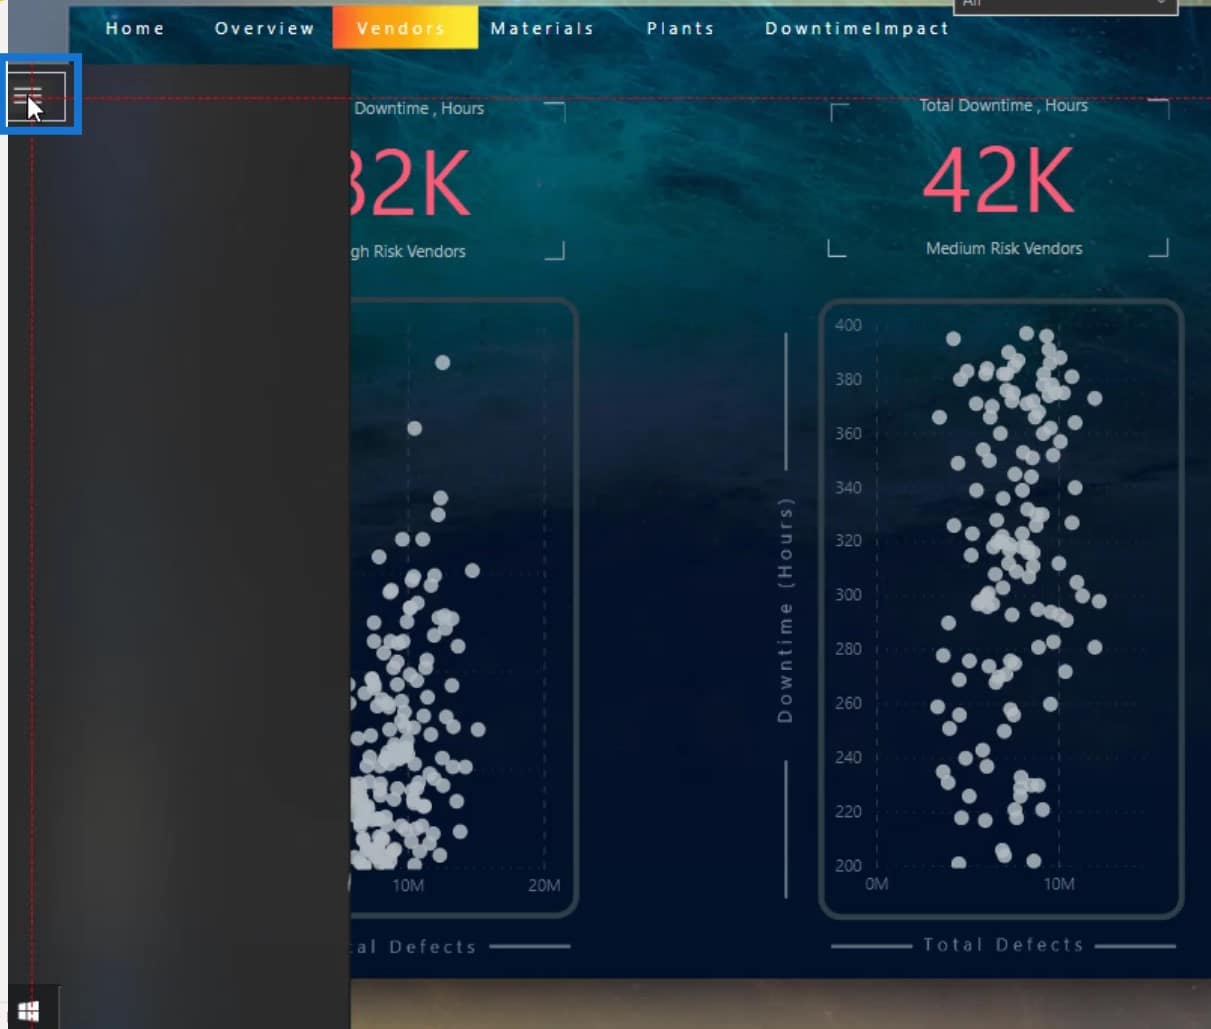
The next thing that I did is to drag this icon here. This will serve as my close icon for the navigation panel.
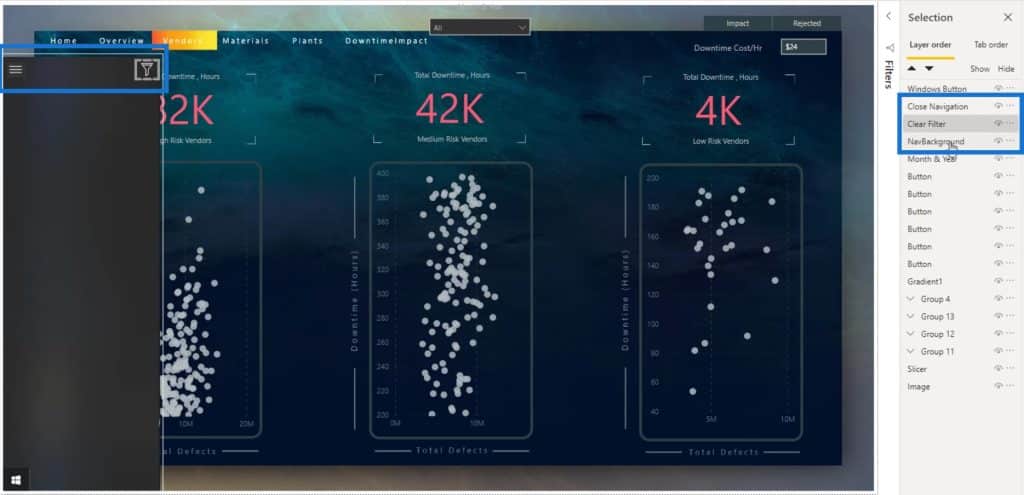
Then, I moved this filter icon here as well.

Both of them are hidden because they are currently behind the NavBackground. I made sure to put them on top of the NavBackground layer.
Then I dragged the slicer here.
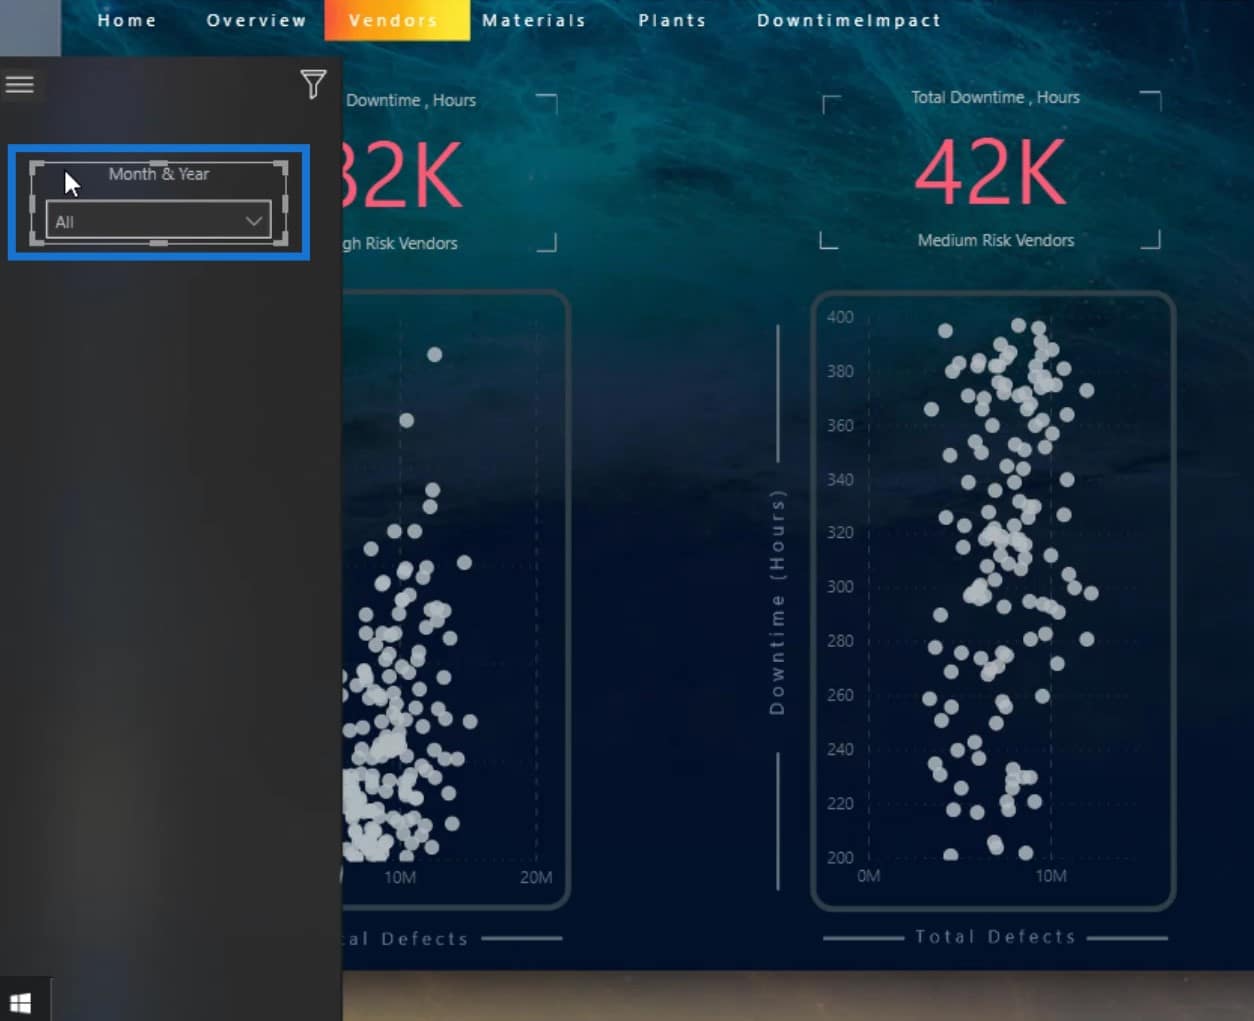
I duplicated it to create a total of 4 slicers.

3. Grouping The Elements
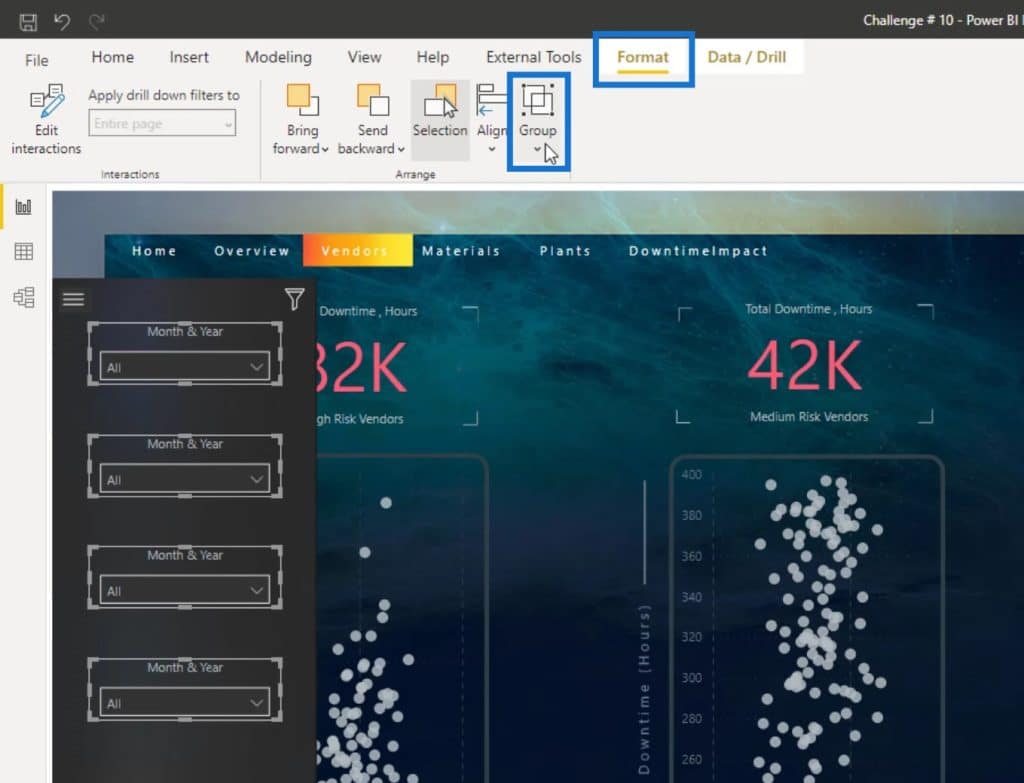
After that, I selected all the slicers and grouped them. When grouping, you can right-click on them and select Group.
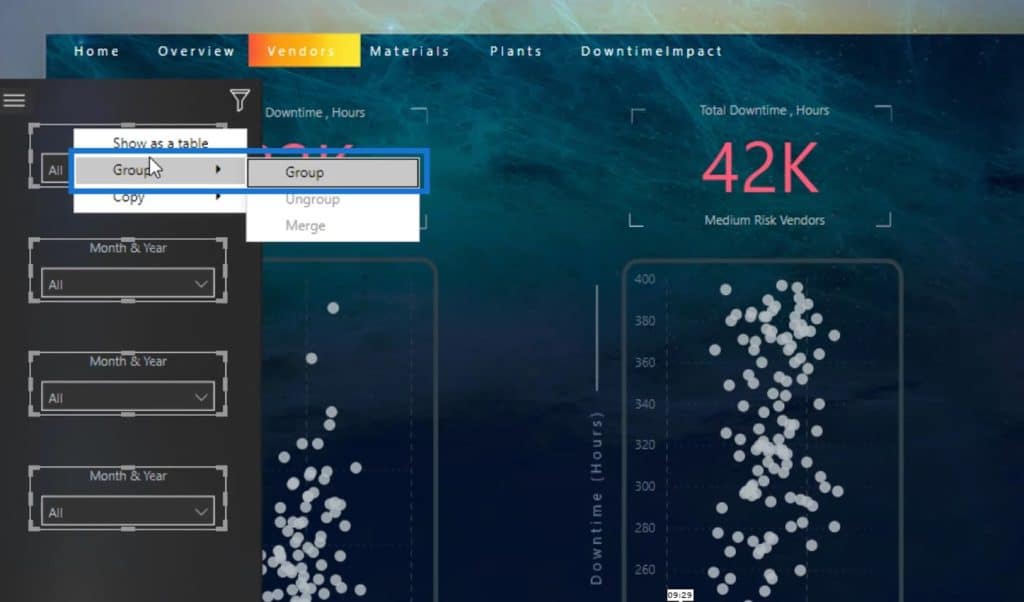
You can also go to the Format tab, then click the Group option.
Then, I renamed the group as Slicers in the Selection pane.
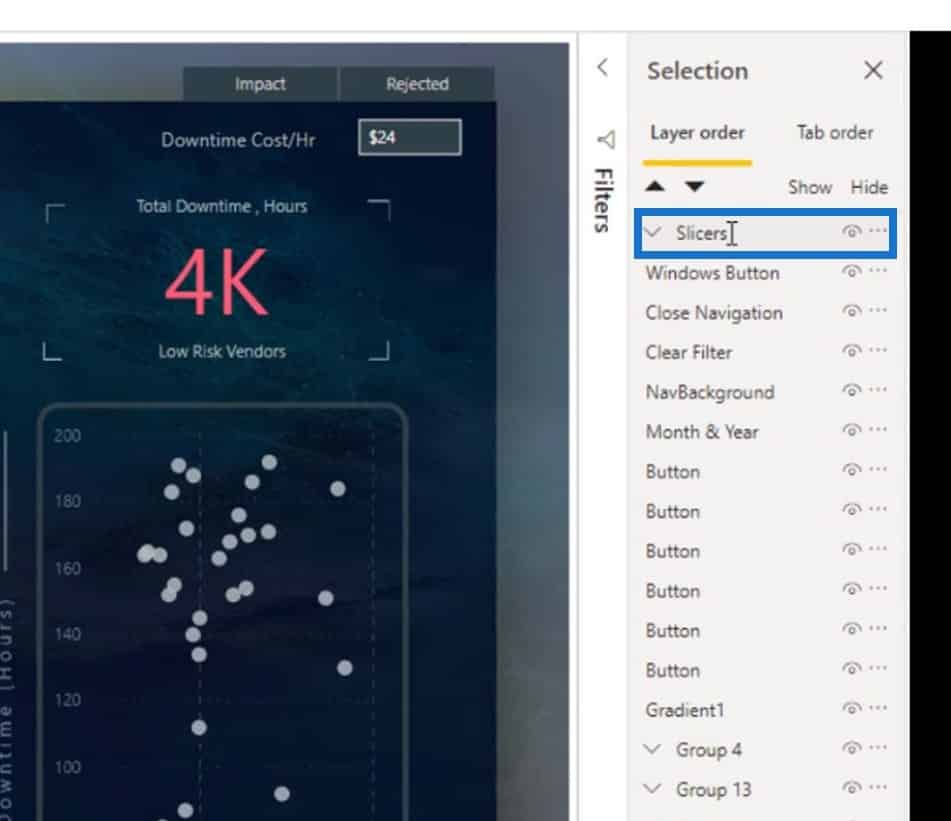
I selected all the items in this navigation pane and grouped them.
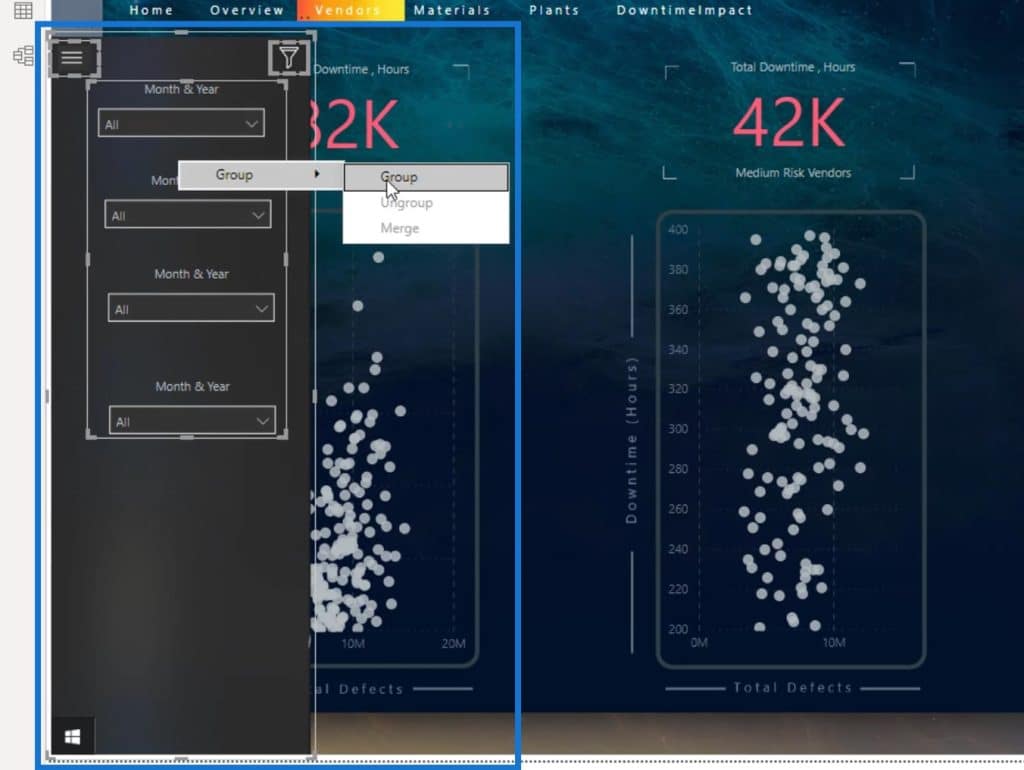
I renamed the group as Navigation Panel.

Then, I dragged the Windows Button layer again on top of the Navigation Panel group to make it visible.
Creating Bookmarks For Power BI Interactive Reports
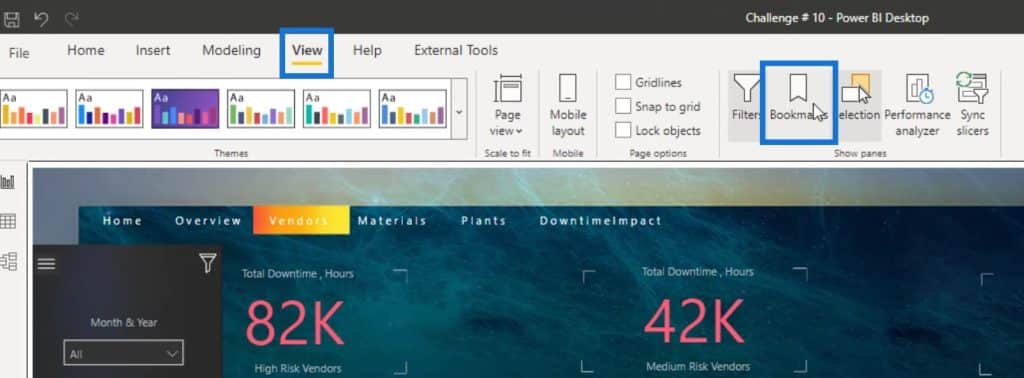
To create bookmarks, just go to the View tab, then click the Bookmarks option.
1. Creating The Bookmark For Showing The Navigation Panel
First, I’ll create a bookmark for the Windows Button layer where it will show the navigation panel by clicking on it.
So, while the Navigation Panel is being displayed, I created a bookmark by clicking on the Add button in the Bookmarks pane.
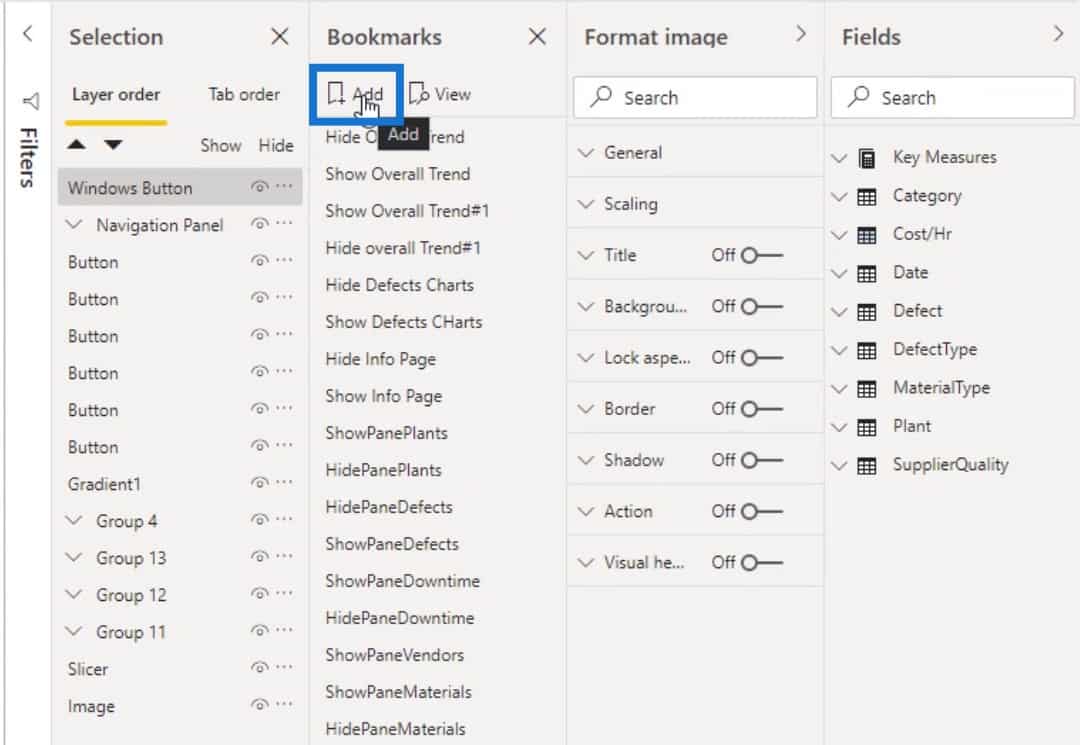
I renamed it as ShowNavPanel (Show Navigation Panel).

Then, I right clicked on it. I don’t have any data right now so I’ll uncheck the Data.

I right clicked on it again, then selected Update.

Now, I also want to create a bookmark for hiding the Navigation Panel. To do that, I’ll hide the Navigation Panel group first by clicking here.

Then, I added another bookmark and named it as HideNavPanel (Hide Navigation Panel).

I right clicked on it and unchecked the Data.

I right clicked on it again and clicked Update.

After that, I need to assign the bookmarks on the Windows button image. To do that, I made sure that it is selected.

Then, I enabled the Action option.

Under the Type selection, I selected Bookmark.

Under the Bookmark selction, I selected the ShowNavPanel bookmark.

For the Tooltip field, I typed “Show NavPanel”.
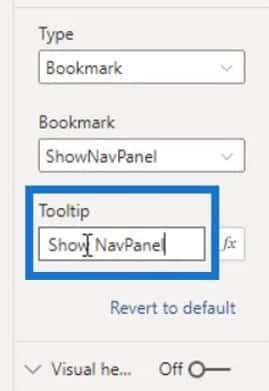
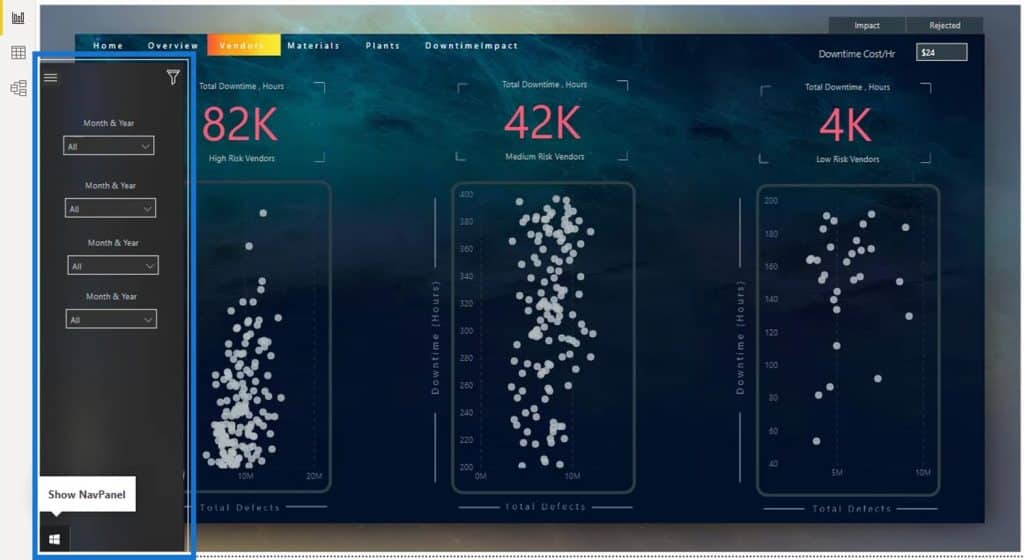
So, when I hover over the Windows Button image, it will show a tooltip that displays “Show NavPanel“.

2. Creating The Bookmark For Hiding The Navigation Panel
Next is to add a bookmark for this icon that will close the Navigation Panel upon clicking it. Again, I made sure that this icon is selected.

Then, I enabled the Action, selected Bookmark under the Type selection, and selected the HideNavPanel.
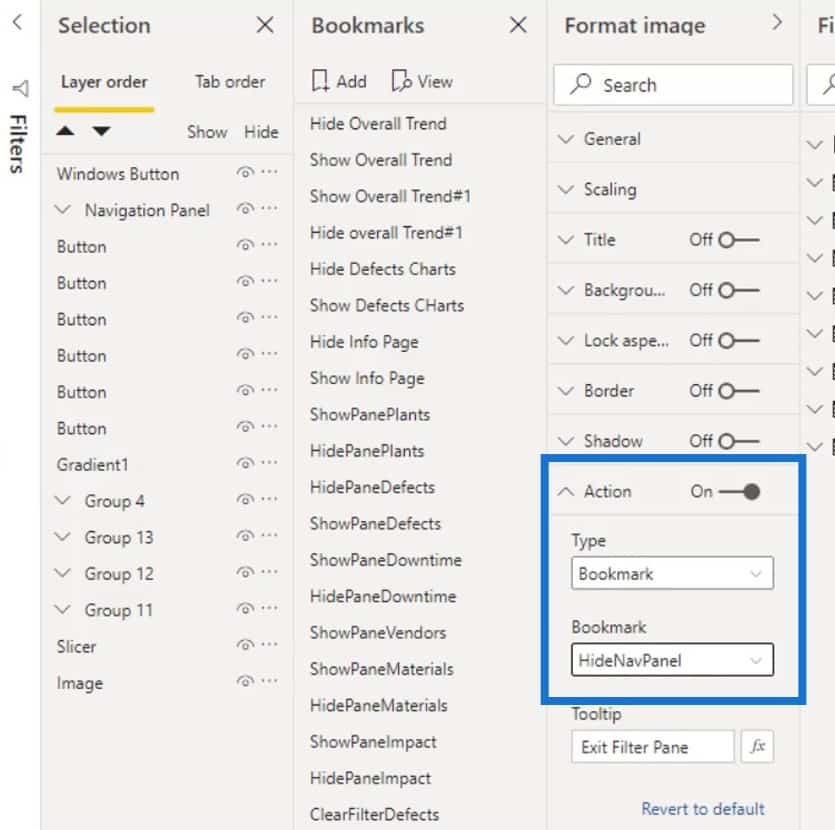
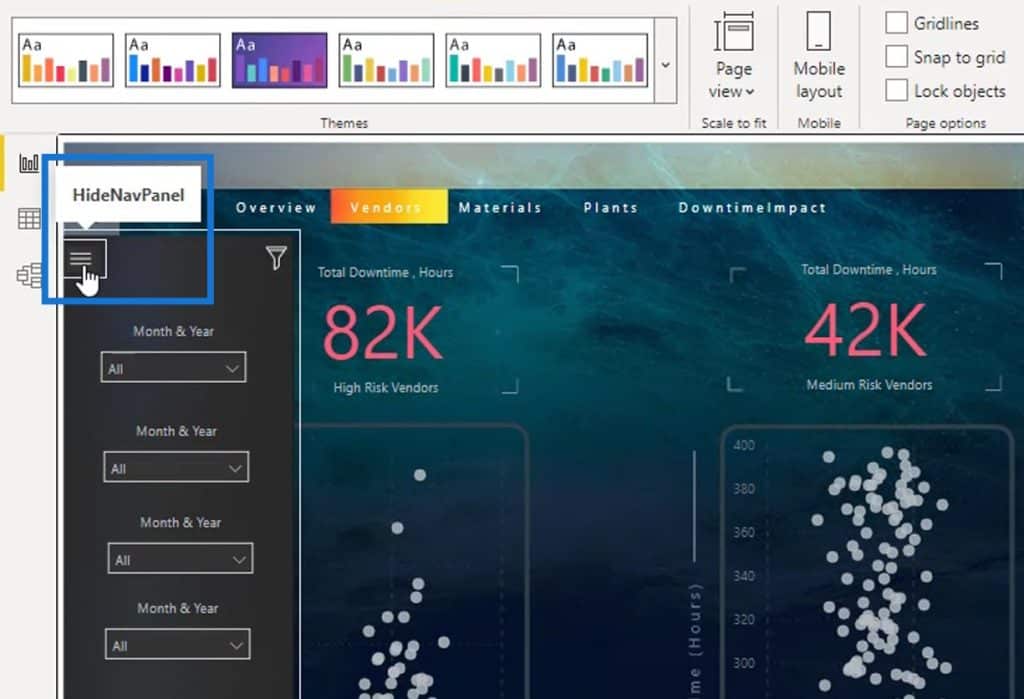
For the Tooltip, I typed HideNavPanel.

Now, if I hover over this icon, it will display “HideNavPanel“.
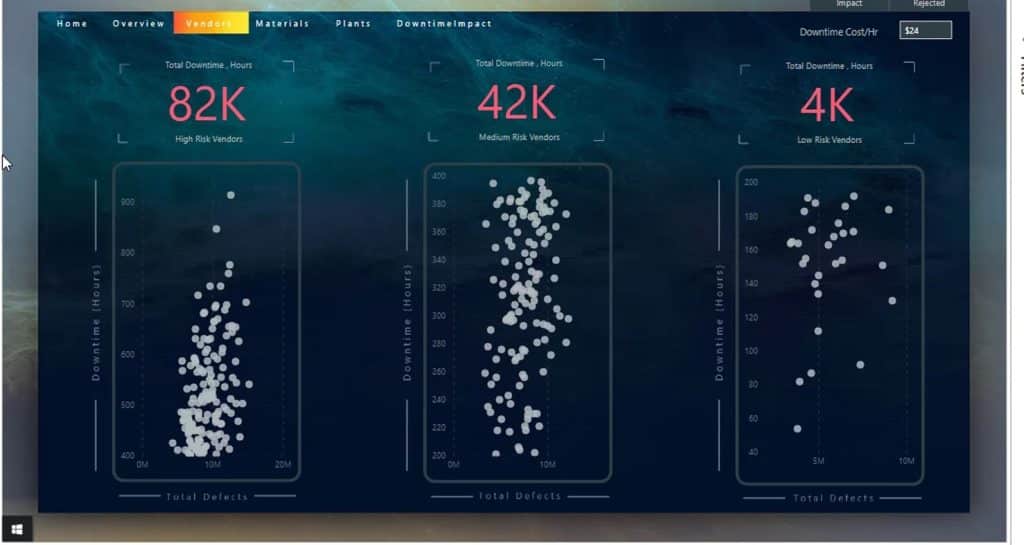
If I click on it, it will hide the navigation panel.
If I click on the Windows button, it will display the navigation panel.
3. Creating The Clear Filter Bookmark
The last thing that I need to do is to create a Clear Filter bookmark for this icon.
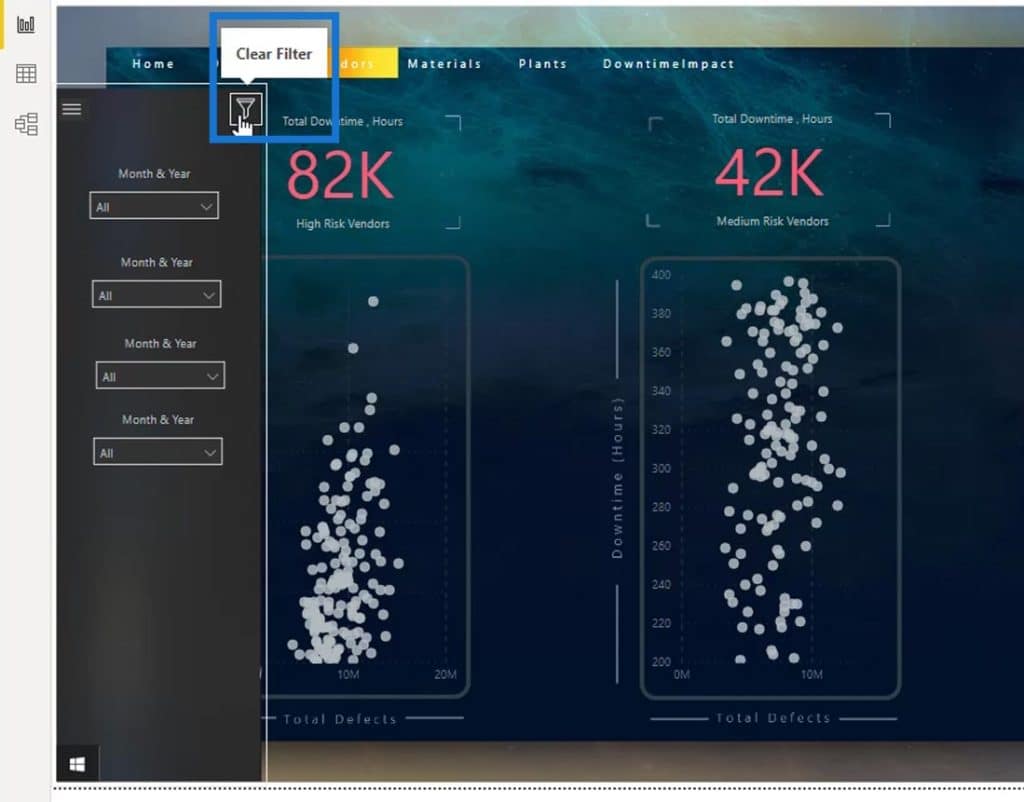
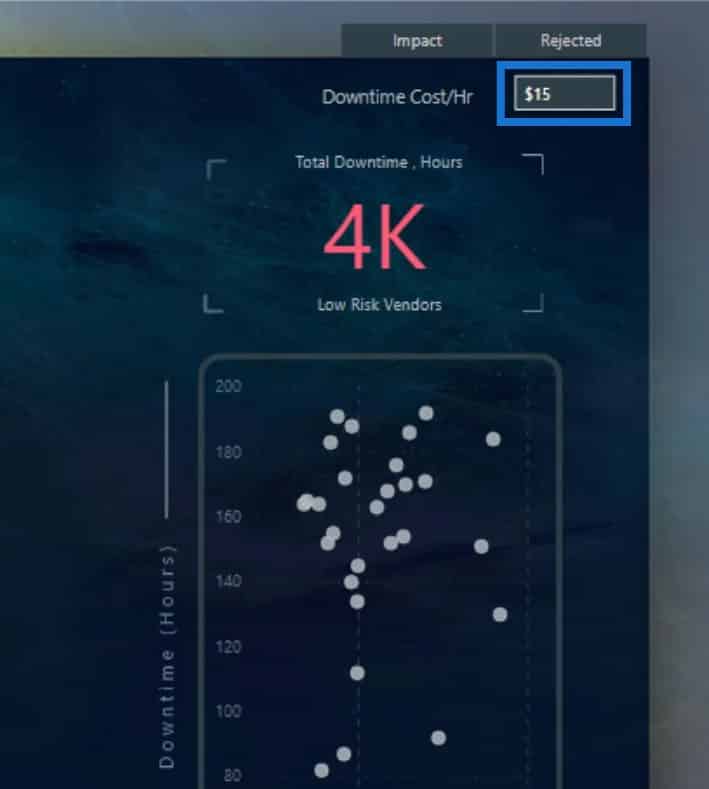
This bookmark will always set the display to the default state that I created in this bookmark. For example, I’ll set $15 as the default for the Downtime Cost/Hr field.

Then, I added a bookmark and named it as ClFilter (Clear Filter).

I right-clicked on it and unchecked Display as I won’t be needing it.

Then I chose Update.

Next is to assign that bookmark on the Filter icon. First, I made sure that the icon is selected.
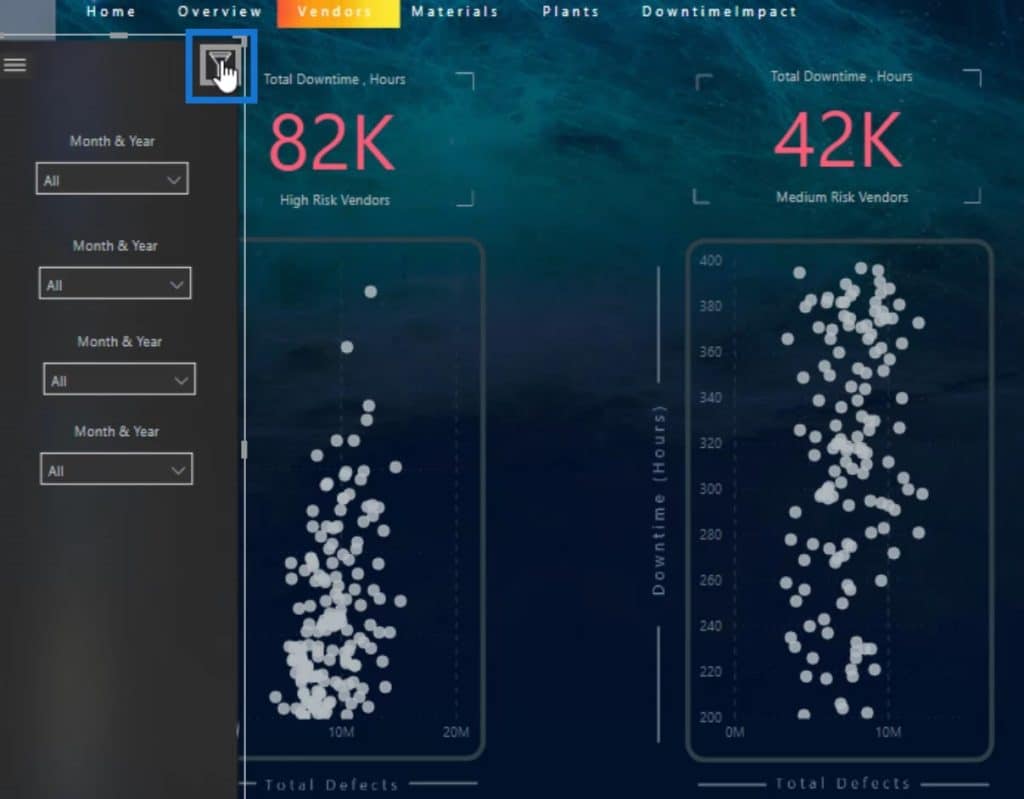
Then, I enabled the Action, made sure that the selected Type is Bookmark, selected the ClFilter under the Bookmark selection, and typed “Clear Filter” for the Tooltip.

Now, let’s enter $24 here.

Then let’s click on the Clear Filter Icon.
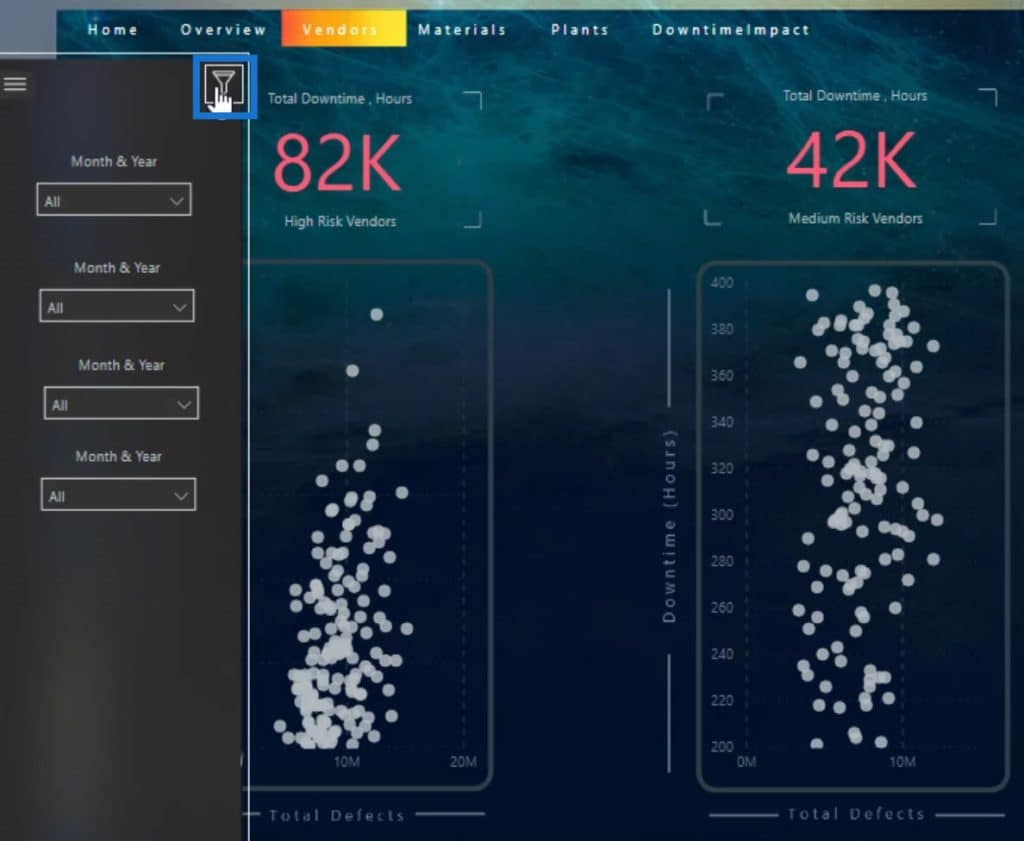
As you can see, it brought back the default state that I set which is $15.
This is how you can easily create and manage your bookmarks in your report.
***** Related Links *****
Power BI Applications & Brilliant Navigation Ideas
Bookmarks In Power BI – Grouping by Report Page
Interactive Reports In Power BI | Enterprise DNA Tutorial
Conclusion
To sum up, there are lots of cool things you can do without having to spend a lot of time on your navigation. In case you want more navigation ideas, you can go back to the different Power BI challenges. We’ve had more than 10 challenges so far in Enterprise DNA forum.
You’ve also learned how easy it is to create bookmarks for your Power BI reports. You can efficiently manage them by naming the images, icons, and slicers.
Check out the links below for more examples and related content.
Cheers!
Mudassir


