It’s the goal of every organization to see their business become successful. That said, understanding customer behavior deeply is one of the elements you can leverage for increased business success. One way to do this is by knowing your customers’ last purchase date in Power BI. You may watch the full video of this tutorial at the bottom of this blog.
In this blog post, I am going to demonstrate how you can work out how many days it has been since a customer last purchased from you.
This is very important from a sales, marketing, and promotional point of view because gaining such insight can help you strategize around your marketing initiatives.
For instance, if a customer buys from you every two weeks, you can use email marketing strategies to send offers at times which will most likely lead to a sale and ultimately increase your revenue.
If you have a CRM system in place, you would want to know if a customer is actively buying from you. They might have gone to a competitor or they might be considering taking the business elsewhere. You want to know these things in real-time.
By understanding this metric and learning about your customer behavior, you are likely to make better decisions that will ultimately improve the sales and services you’ll be offering to your client base.
I’ll show you how to analytically think about this in Power BI. Plus, how to solve it, implement the right DAX formula, and then visualize it in a compelling way.
Determining How Many Days Since Last Purchase
Before we proceed, let’s take a look at the underlying table. This is where we’ll get all the information we’ll need, including the Purchase Date of our customers.

1. Date of Last Purchase
The specific insight we’re going to look at is how many days since the last purchase a customer has made. We have to walk through a few steps in order to find out.
In this table, we get to see the Customer Name, Date of Last Purchase, and Days Since Last Purchase fields.

The first thing we need to do is to work out when was our customers’ last purchase. We do this by creating a new measure using this formula:

Once we apply this formula, we will see that the customers have been filtered, and all that’s left in the sales table are the dates of the customers’ last purchase.

2. Last Purchase Date
The next thing we need to do is work out the last purchase date in Power BI for every customer.
We can work it out by creating a new measure in Power BI using this formula: MAXX(ALL (Sales), Sales[Purchase Date]).

So for this demo data set, you’ll see that the Last Purchase Date in this particular case is January 6, 2018.

From here, we can now work out the days since the last purchase since we have the individual Last Purchase Date of each customer.
3. Days Since Last Purchase
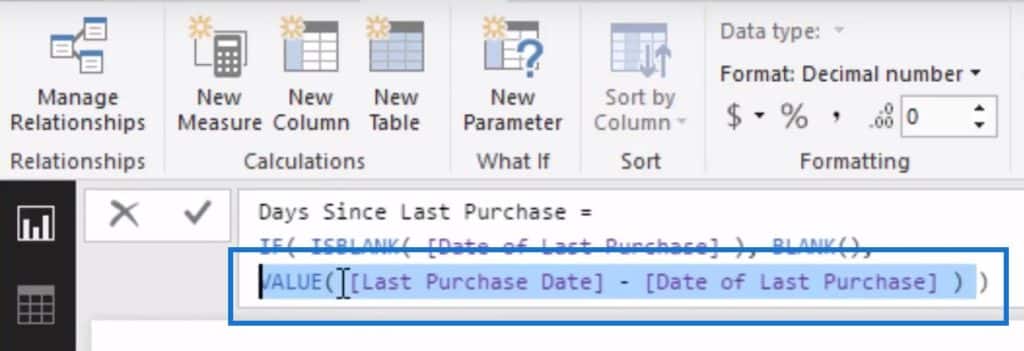
To get the Days Since Last Purchase, all we have to do is deduct the Date of Last Purchase from the Last Purchase Date. We do this by creating a measure using this formula:

If we subtract a date from a date, it will return a date format. Therefore, we use VALUE so we can turn the text value into a number.

Let’s say we click on the Days Since Last Purchase Date and this is the formula I use, and the IF portion is left blank.

When I go to the Total Sales by State graph and click on Florida, it will return the entire customer list even though some of them never bought in Florida.

We definitely don’t want a result that shows customers even if they did not make a purchase in Florida. The way we do that is by using logic in our model.

So once we use this logic and click on Florida, it will make a lot more sense now when we look at the sales table. We can now see a list of customers from Florida as well as their Dates of Last Purchase.

4. Using A Threshold
Another option you can use to create a new measure is by using a threshold.
Let’s say we want to have a list of customers who have breached the 300-day threshold. We can come up with a customer list by using this formula:

You can then create a chart that will showcase the customers that are above this 300-day threshold.

Marketing Using The Data
By coming up with formulas from the purchase date in Power BI, we can use the data we gathered from a marketing or a customer outreach perspective.
For example, we can add some specific marketing or advertising to these customers. If they haven’t been onboard with us for a very long time, maybe there are some really special offers that we can send to them via email.
***** Related Links *****
Show Results Up To Current Date Or A Specific Date In Power BI
Calculate The Difference In Days Between Purchases Or Events In Power BI Using DAX
Customer Trend Analysis in Power BI Using DAX
Conclusion
It is amazing how you can quickly branch out into these fantastic insights using Power BI. With the data you have gathered, you can create an insight and then use it to implement your marketing strategies.
This blog post shows just one way to predict customer behavior. To learn other business analytics techniques that you can utilize, check out the module below from Enterprise DNA On-demand.
All the best!
Sam.


