I want to show you how I used Power BI bookmarks in one of the Power BI challenges that we’re having on the Enterprise DNA forum. You may watch the full video of this tutorial at the bottom of this blog.
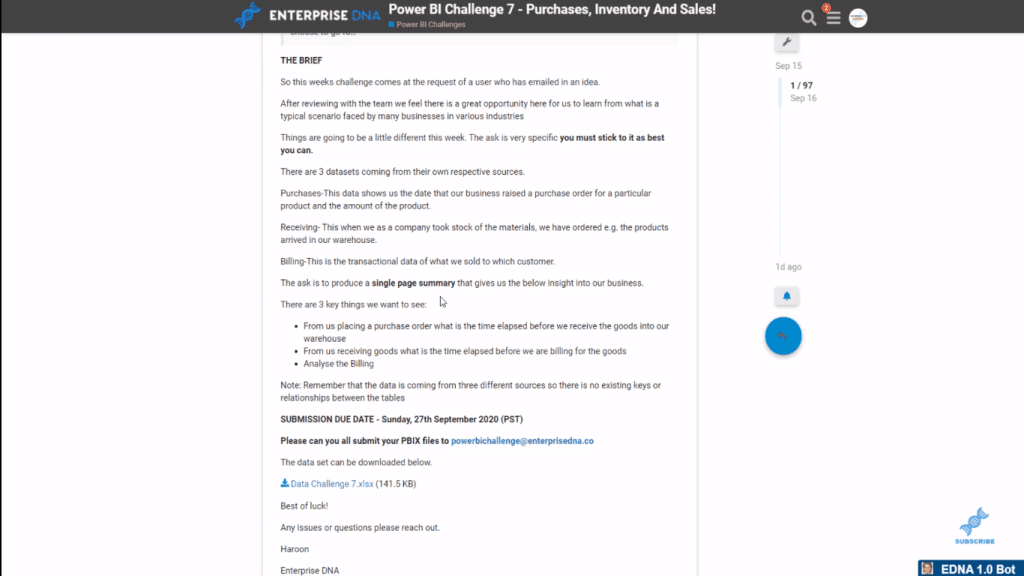
The challenge involved some different things on purchases, receiving and billing for a company. We’re supposed to come up with a one-page or a single page summary to give us the feedback that we wanted for this challenge.
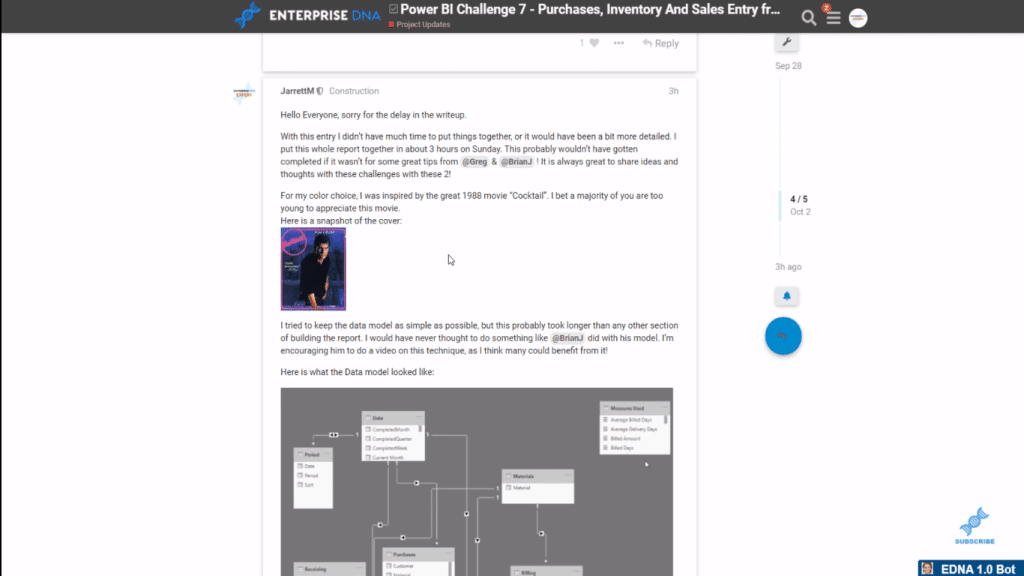
This is my writeup for the challenge. I got my inspiration for this color theme from the movie Cocktail from 1988 with the young Tom Cruise.
Now I’ll show you how I came up with the Power BI bookmarks and their functionality for this challenge.
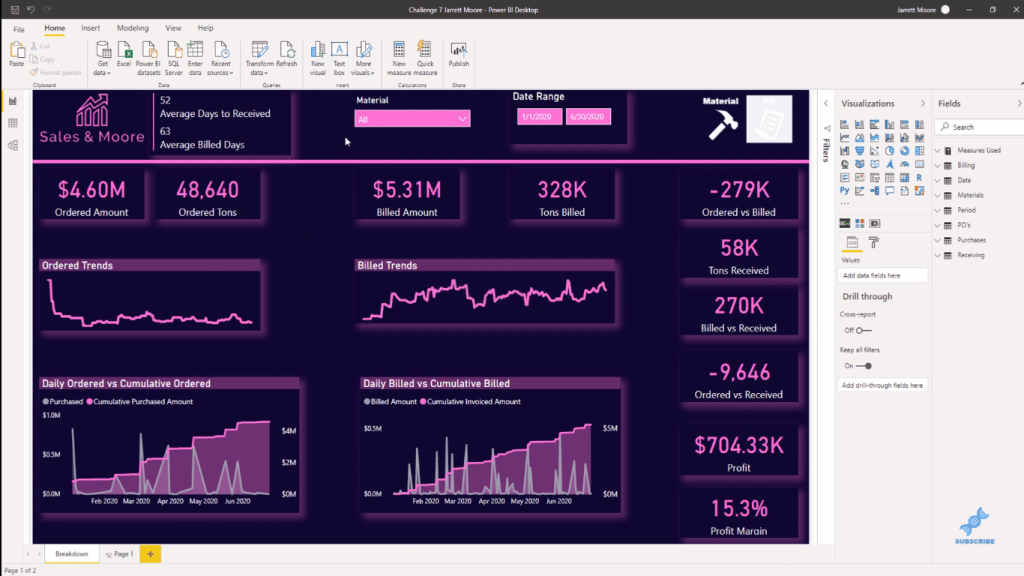
Power BI Bookmarks Functionality
Most of the time, people will use bookmarks and create separate pages to implement this strategy. But what I do is I just create and hide different things using the Selection pain in the Power BI Desktop.
When I highlight over this icon, you can see that we have this Material view.

We have the Material slicer to give us all the information on the materials.

Then, if I hold down the control key and left-click on the mouse, this will take us over to the Purchase Order view. If I want to go back to the materials, all I do is hold down the control key again and left-click on the mouse.

In the Power BI service, if you have access to the report, all you would do is just click on the icon to switch you back from the different views. But inside the Power BI desktop, we have to use the control key and the left click of the mouse.
Where To Get Icons For The Power BI Bookmarks
I get my icons from the site, iconsdb.com, and I look up white icons. This is where I find all of the white icons that I use on most of my reports.
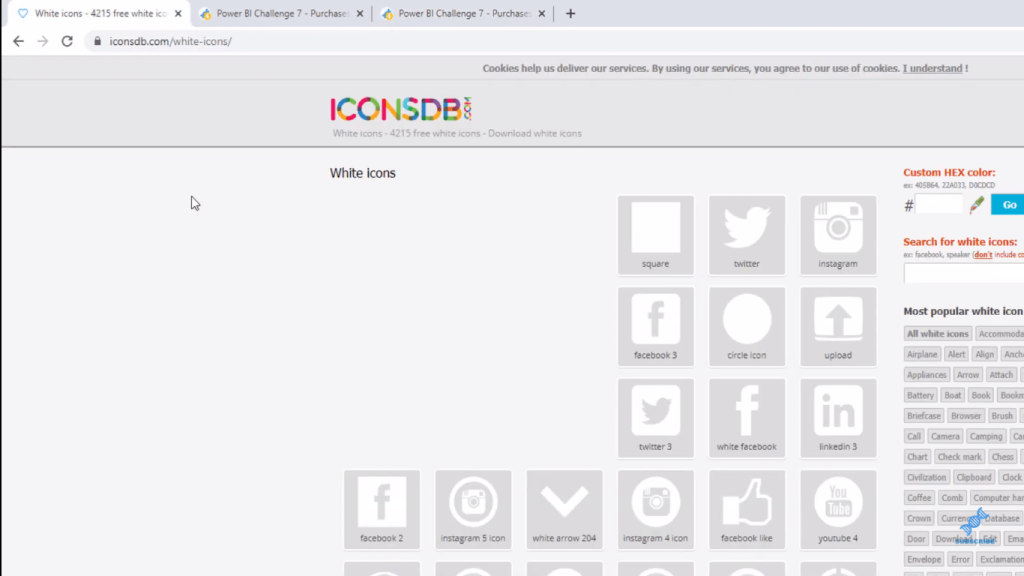
All you would do is go over here and do a search for this entry.
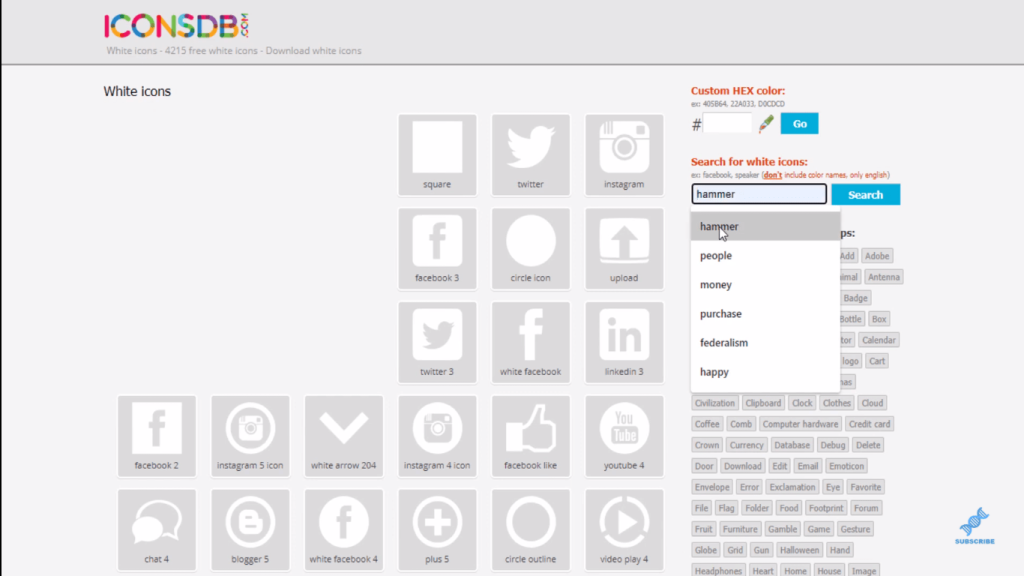
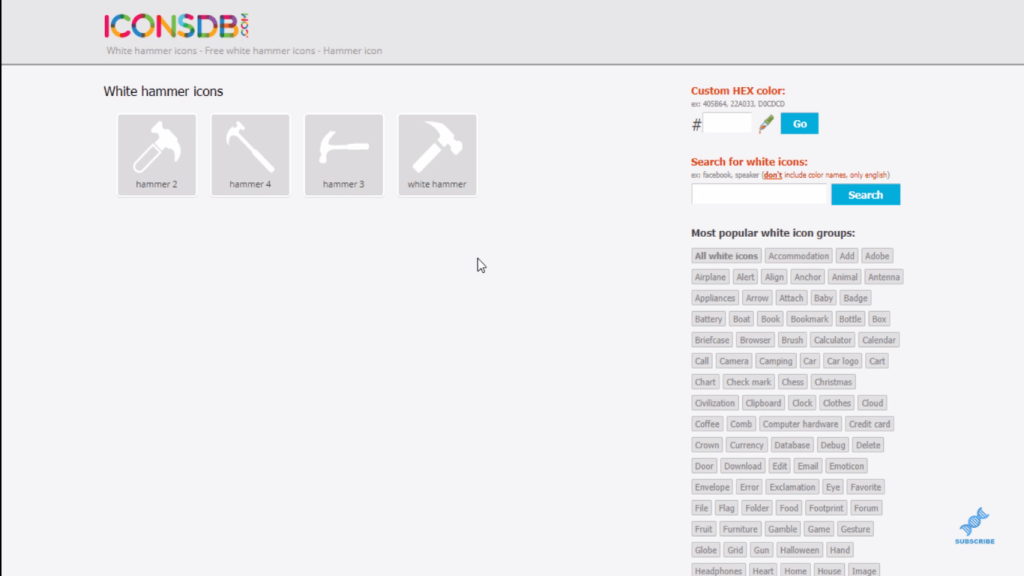
I searched for “hammer” (this is what I use for my Materials logos). Once I click search, you’ll get the results. You can then download the logos or icons that you choose in the appropriate format that you want and save it to a file.
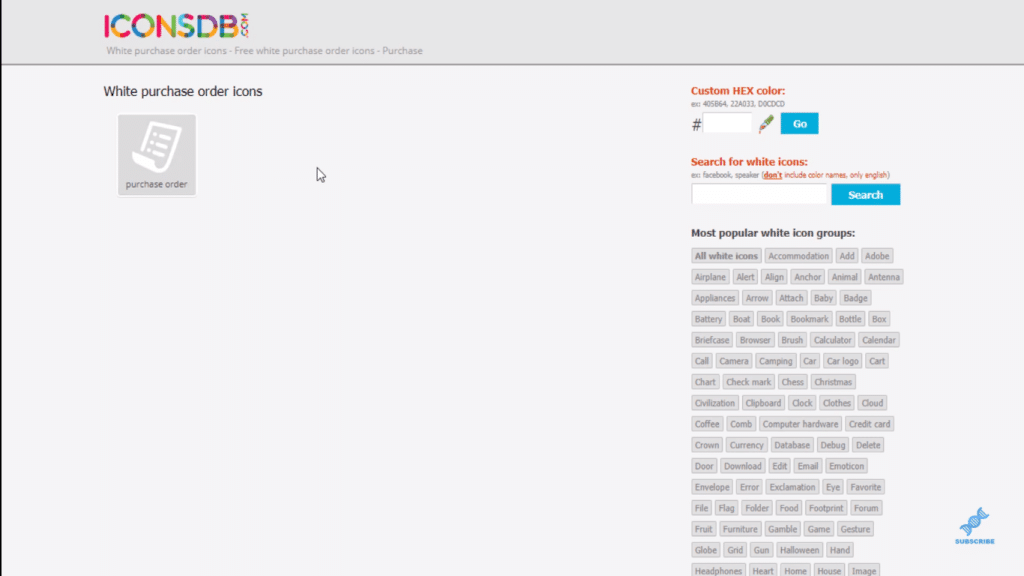
The other icon that I used in this particular report was a purchase order.
Inserting Icons Into The Report
Going back to the Power BI desktop, I have this page that I’ve hidden.

You can see that I’ve inserted the images or icons into the desktop here.
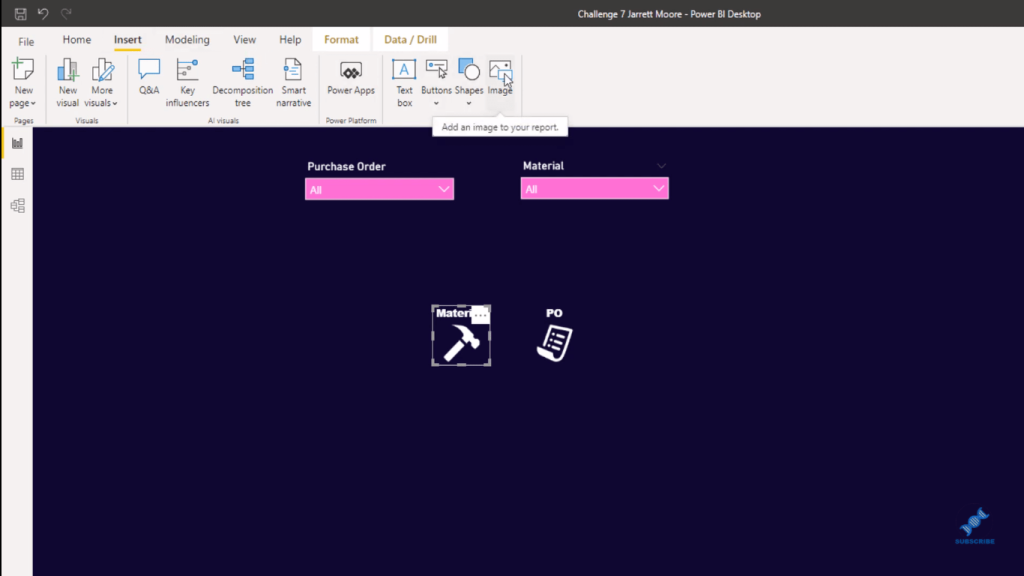
Then I went in for each of them. I click on the icon and made some changes like the title and the font so that it appears the way that I wanted it to.

Once I am satisfied with how they look, I hold down both of the icons and copy and paste them. I then bring the copied icons below the original ones.

Then, I create that background for the image, which is sort of whited out. To do that, I go to Background and adjust the Transparency in about 7%.

From this point, I grab my screen capture tool, which is called Snagit.
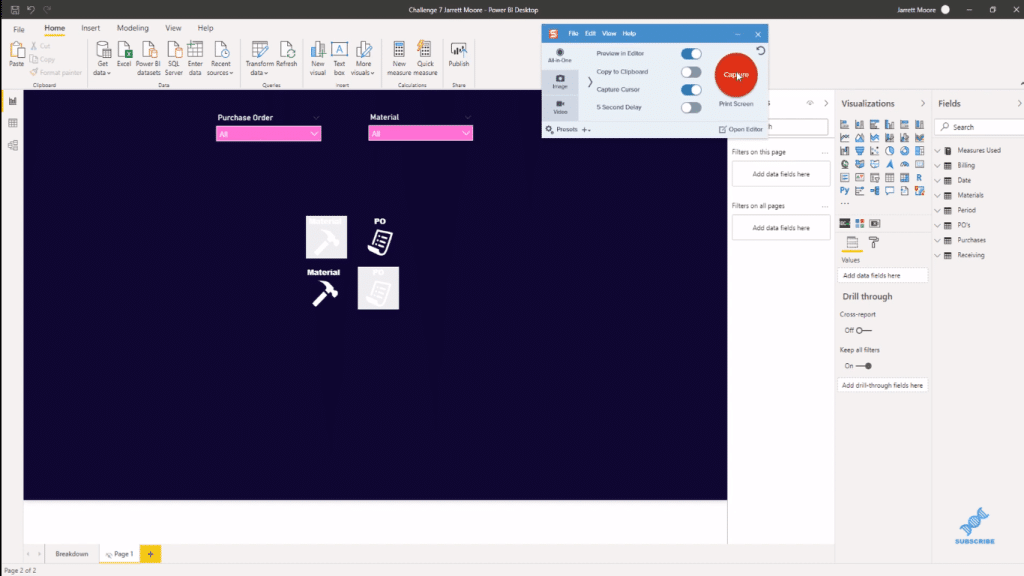
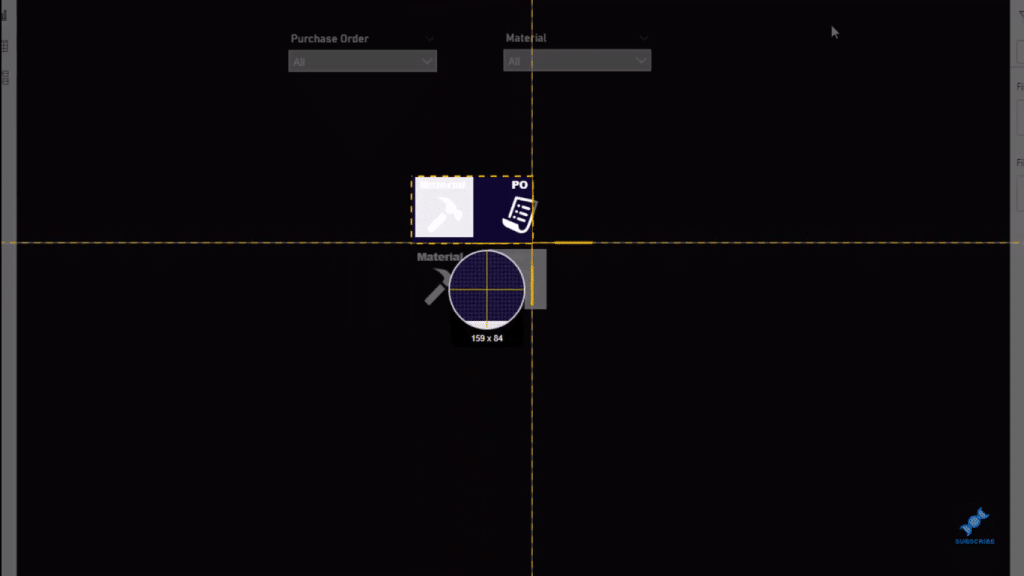
I click the capture button here and capture each one of these.
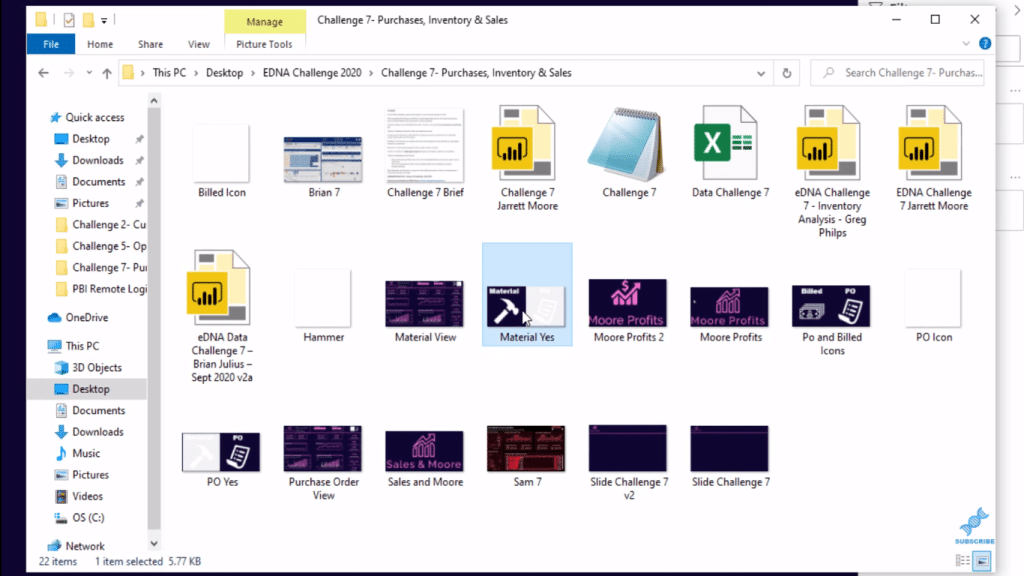
I then open up where that file is saved.
Next, I insert those images or icons by clicking on Images in the Insert tab.

I then resize the images by clicking on each of them and go over to the General section to change the width and height.

The next thing I do here is get rid of the other icons since we already have the pictures established.

After that, we have our two images here and I just kept the slicers at the top. That way we can toggle between them once I get the bookmarks set up.
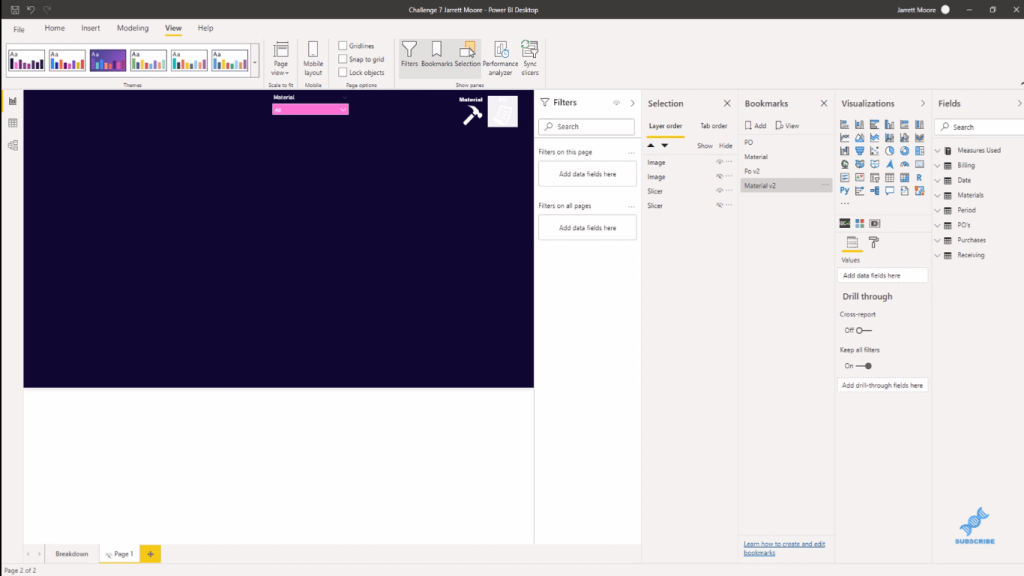
Now I go to the main ribbon and to the View tab and open up the Bookmarks tab. You can see here that we have the original one that I had set up on the report page. I just called it PO and the Material. Now I’ll show you how to set up two new ones here.

Setting Up The Power BI Bookmarks
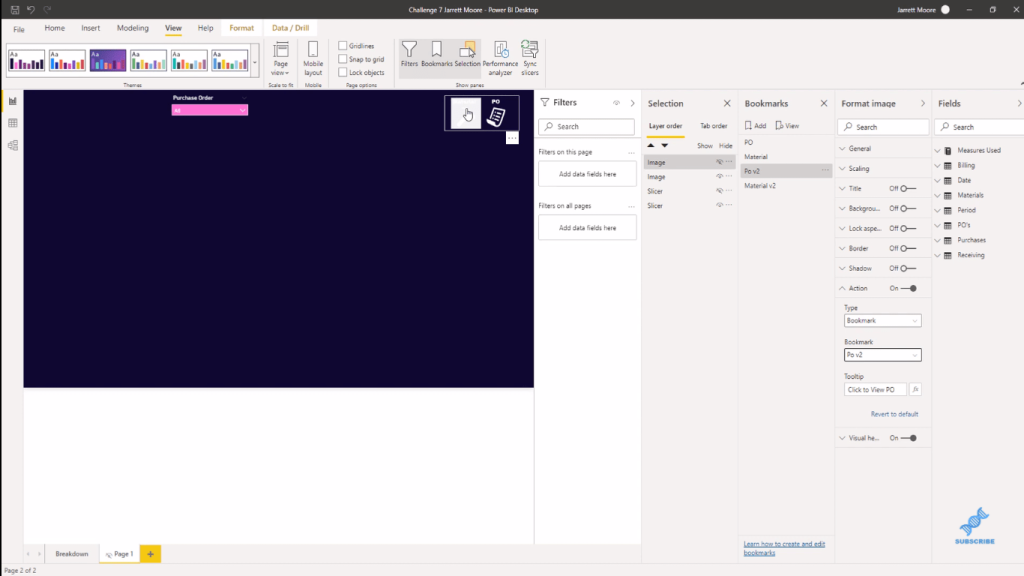
To create a new bookmark, I just click on the Add button and I’ll call this PO v2 (version 2). And the other one I’ll it Material v2 (version 2).

Once we have the Power BI bookmarks established, I click back on the PO version first and open the Selection pane.

From here, since we’re on the PO view (PO v2), we’re going to hide it by clicking on that hide (eye) button right there. And we’re going to hide the Materials as well by clicking on the slicer and hide it. Then, click on Update on the bookmark.

Then, I would do the same to the Material view (Material v2).
Creating The Bookmark Functionality
The next and final steps that we need to do is create the functionality to where we can click between each of these icons in different views.
To do that, I click the icon and go over to the Action tab, click Bookmark for Type and choose the bookmark (PO v2, Material v2). Then, under Tooltip, you can write something like a comment wherein when somebody highlights or puts their mouse over this icon, they can see this, “Click to View” sort of instruction. Once that’s done, don’t forget to update the bookmark.

So now if we’re on the Material tab once I click on the icon with the left-click on the mouse, it takes me to the PO version without any problems. If I want to go back to the Material view, I click on the icon again, and it takes me back to the Material view.
***** Related Links *****
Reporting In Power BI: How To Create Information Boxes
How To Add Custom Power BI Icons Into Your Reports
Creating A Visual Tooltip In Power BI
Conclusion
This is a great way to utilize the Power BI bookmarks and enhance the effectivity and efficiency of your reports. This technique could really make a difference in your consumer/user experience.
I hope you find this tutorial helpful. Watch the full video tutorial below and check out the links for more Power BI content like this.
Cheers!
Jarrett


