
I’ve become a big fan of using custom Power BI icons in my reports, as I think it just adds a real sense of professionalism to them that is difficult to get elsewhere with any visuals. You may watch the full video of this tutorial at the bottom of this blog.
I wanted to show you here how I do it because I get a lot of questions about it. The great thing is it’s easy and there’s so much variety out there that you can almost get any Power BI icons you could ever imagine.

The Custom Power BI Icons I Used & Where I Got Them
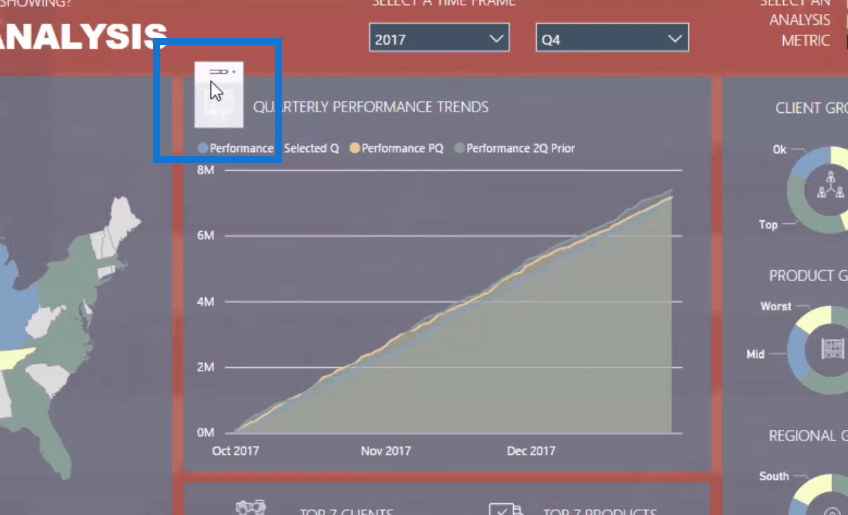
In this tutorial, we’re looking at a dashboard that I used in one of my webinars, and here you can see how I’ve used custom icons. I’ve used them inside the charts and in the title.
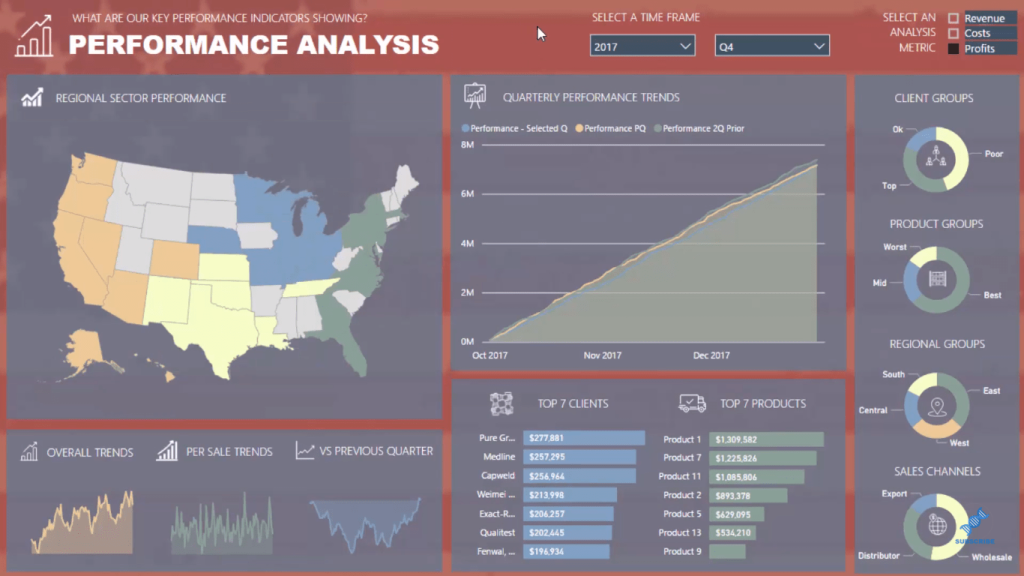
I can include these icons by utilizing an image.
I have a number of these just in a folder icon vectors. The white ones are quite hard to see here since they’re inside the folders, but you can get them in any color.
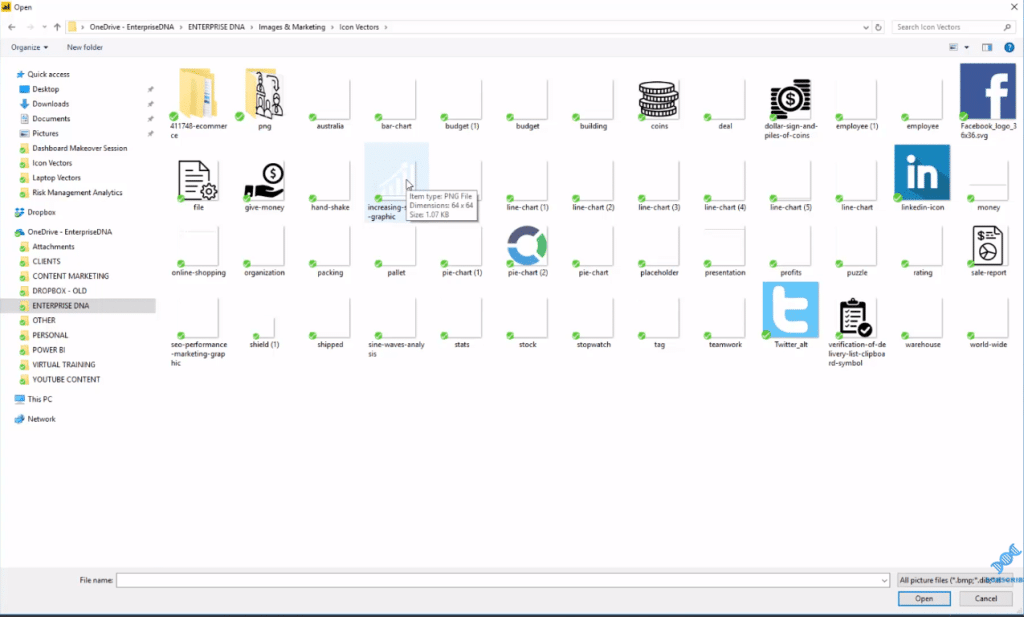
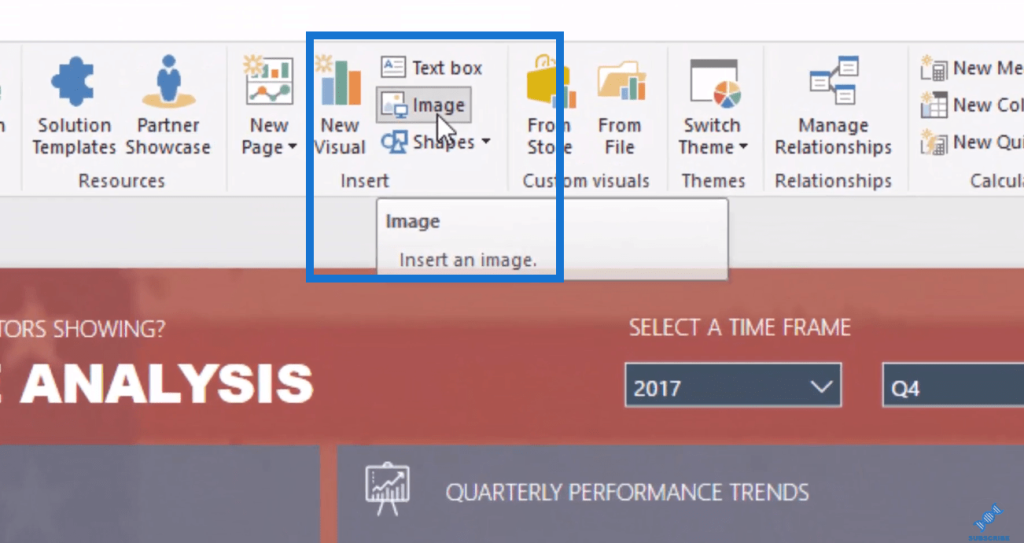
Then, all we have to do is bring in the icon of choice by clicking on it, and simply re-position it as we desire.

I use a website called FLATICON. You may need to sign up to use the service, but it’s actually not that expensive. I develop a lot of reports, so it’s well worth it for me.
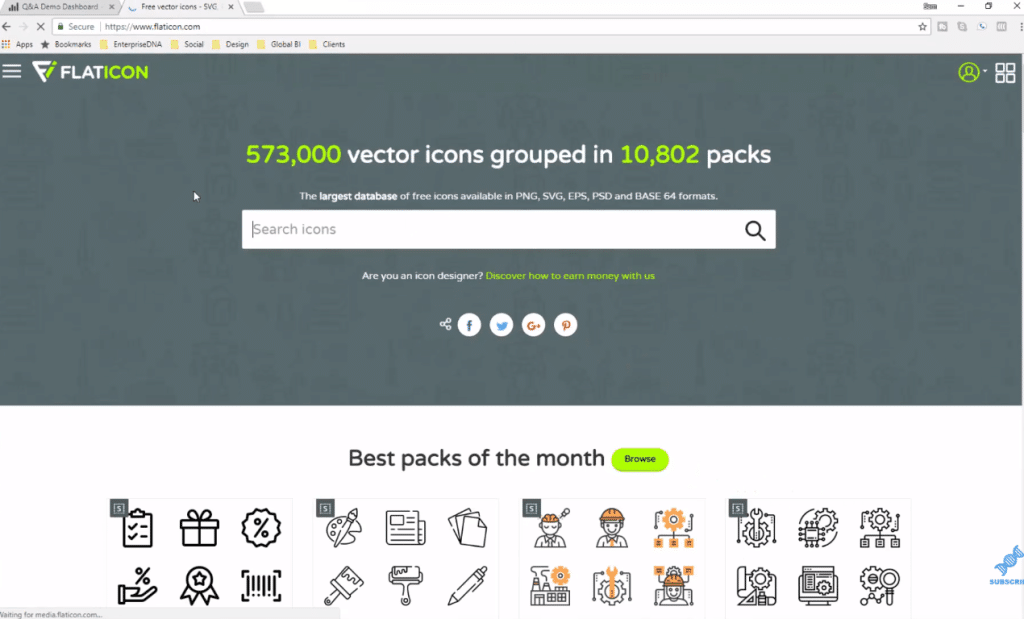
All you have to do is type in what kind of icons you need in the search bar, and then you will get many different options that you can download and use. This example shows us icons for line charts.
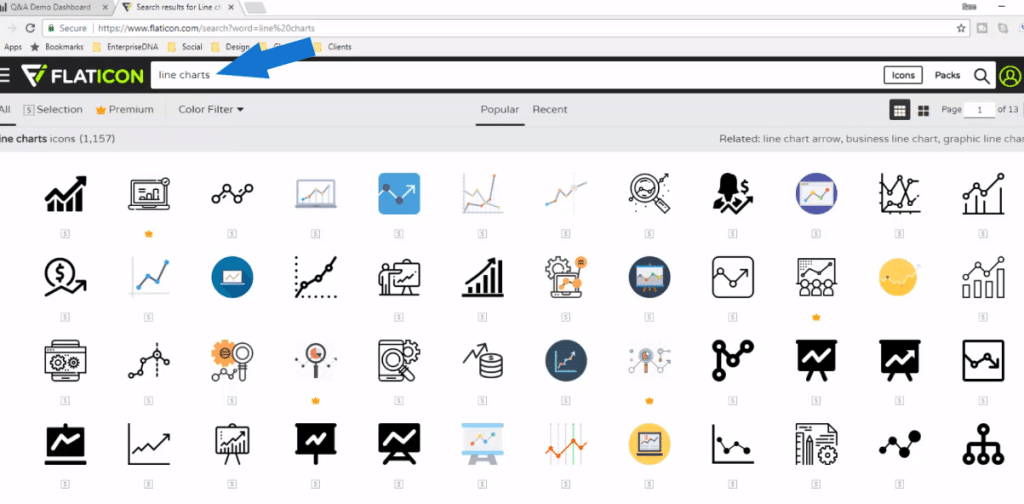
There’s about 500,000 vector icons that you can get from here. This is just one place though that I get custom icons from for my Power BI reports, but you can always get these icons from many other websites.

Bringing In The Custom Power BI Icons
Once you’ve chosen an icon, it’s just easy to bring it in. One thing I would also recommend when adding these icons is that you bring them in after you’ve finished your visuals. Create your report like so:

And then position the power bi icons as finishing touches.
Resize them as you desire and then lock it in there. I think it’s best to do these sorts of changes and additions at the end of your reports. Get the functionality all sorted out first, and then put the finishing touches on at the end. These icons could really make your visuals look a bit more professional.
***** Related Links *****
How To Create Compelling Reports & Dashboards In Power BI
Using Great Color Schemes In Your Power BI Data Visualization
Data Visualization with Power BI: How To Add Commentary to Your Reports in a Dynamic Way
Conclusion
This is just what I have been using recently, so I’m happy to recommend it, but I’m sure that through Google, you can also find many options.
From there, all you have to do is incorporate an image to your Power BI reports, using the icons you select.
Good luck implementing these custom power bi icons!
Sam


