
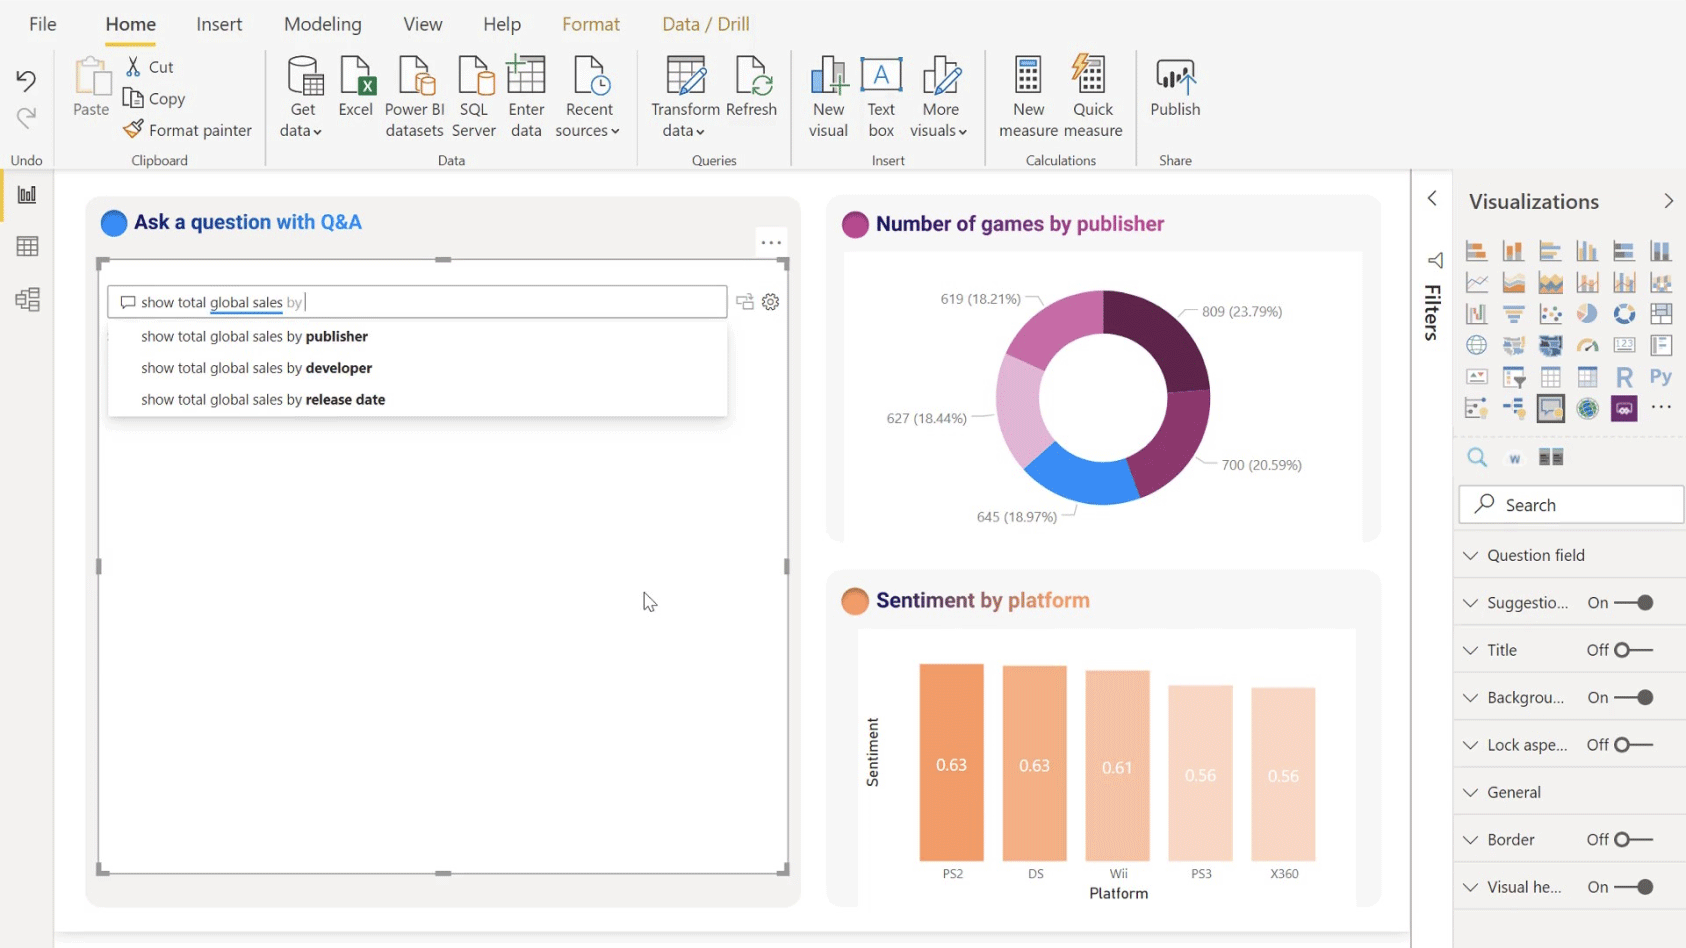
Power BI has established itself as a powerful business analytics platform, offering a wide range of features and capabilities to simplify data visualization and predictive analysis.
However, there is no ‘one-size-fits-all’ solution when it comes to choosing the right business intelligence tool, and you might find Power BI not quite meeting your specific requirements.
Luckily, some strong alternatives to Power BI are available in the market, catering to different needs and preferences.

The Top 5 Power BI alternatives are:
- Tableau
- Qlik Sense
- Sisense
- Zoho Analytics
- Google Data Studio
This article will tell you everything you need to know about these alternatives and stack them up against the powerful Power BI.
Let’s jump in!
Top 5 Power BI Alternatives

1. Tableau
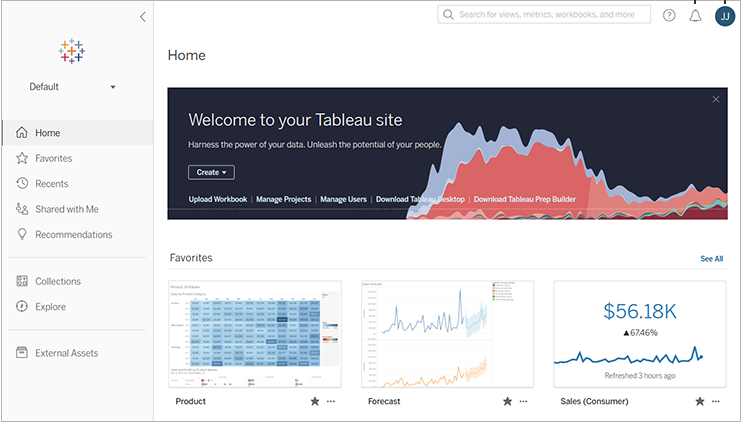
Arguably the most popular of Microsoft Power BI alternatives, Tableau is a dynamic and popular data visualization tool with robust features for creating interactive and shareable dashboards.
It’s well-suited for users who want to analyze and present data in an easily understandable format without having to deal with a steep learning curve.
Tableau Cost
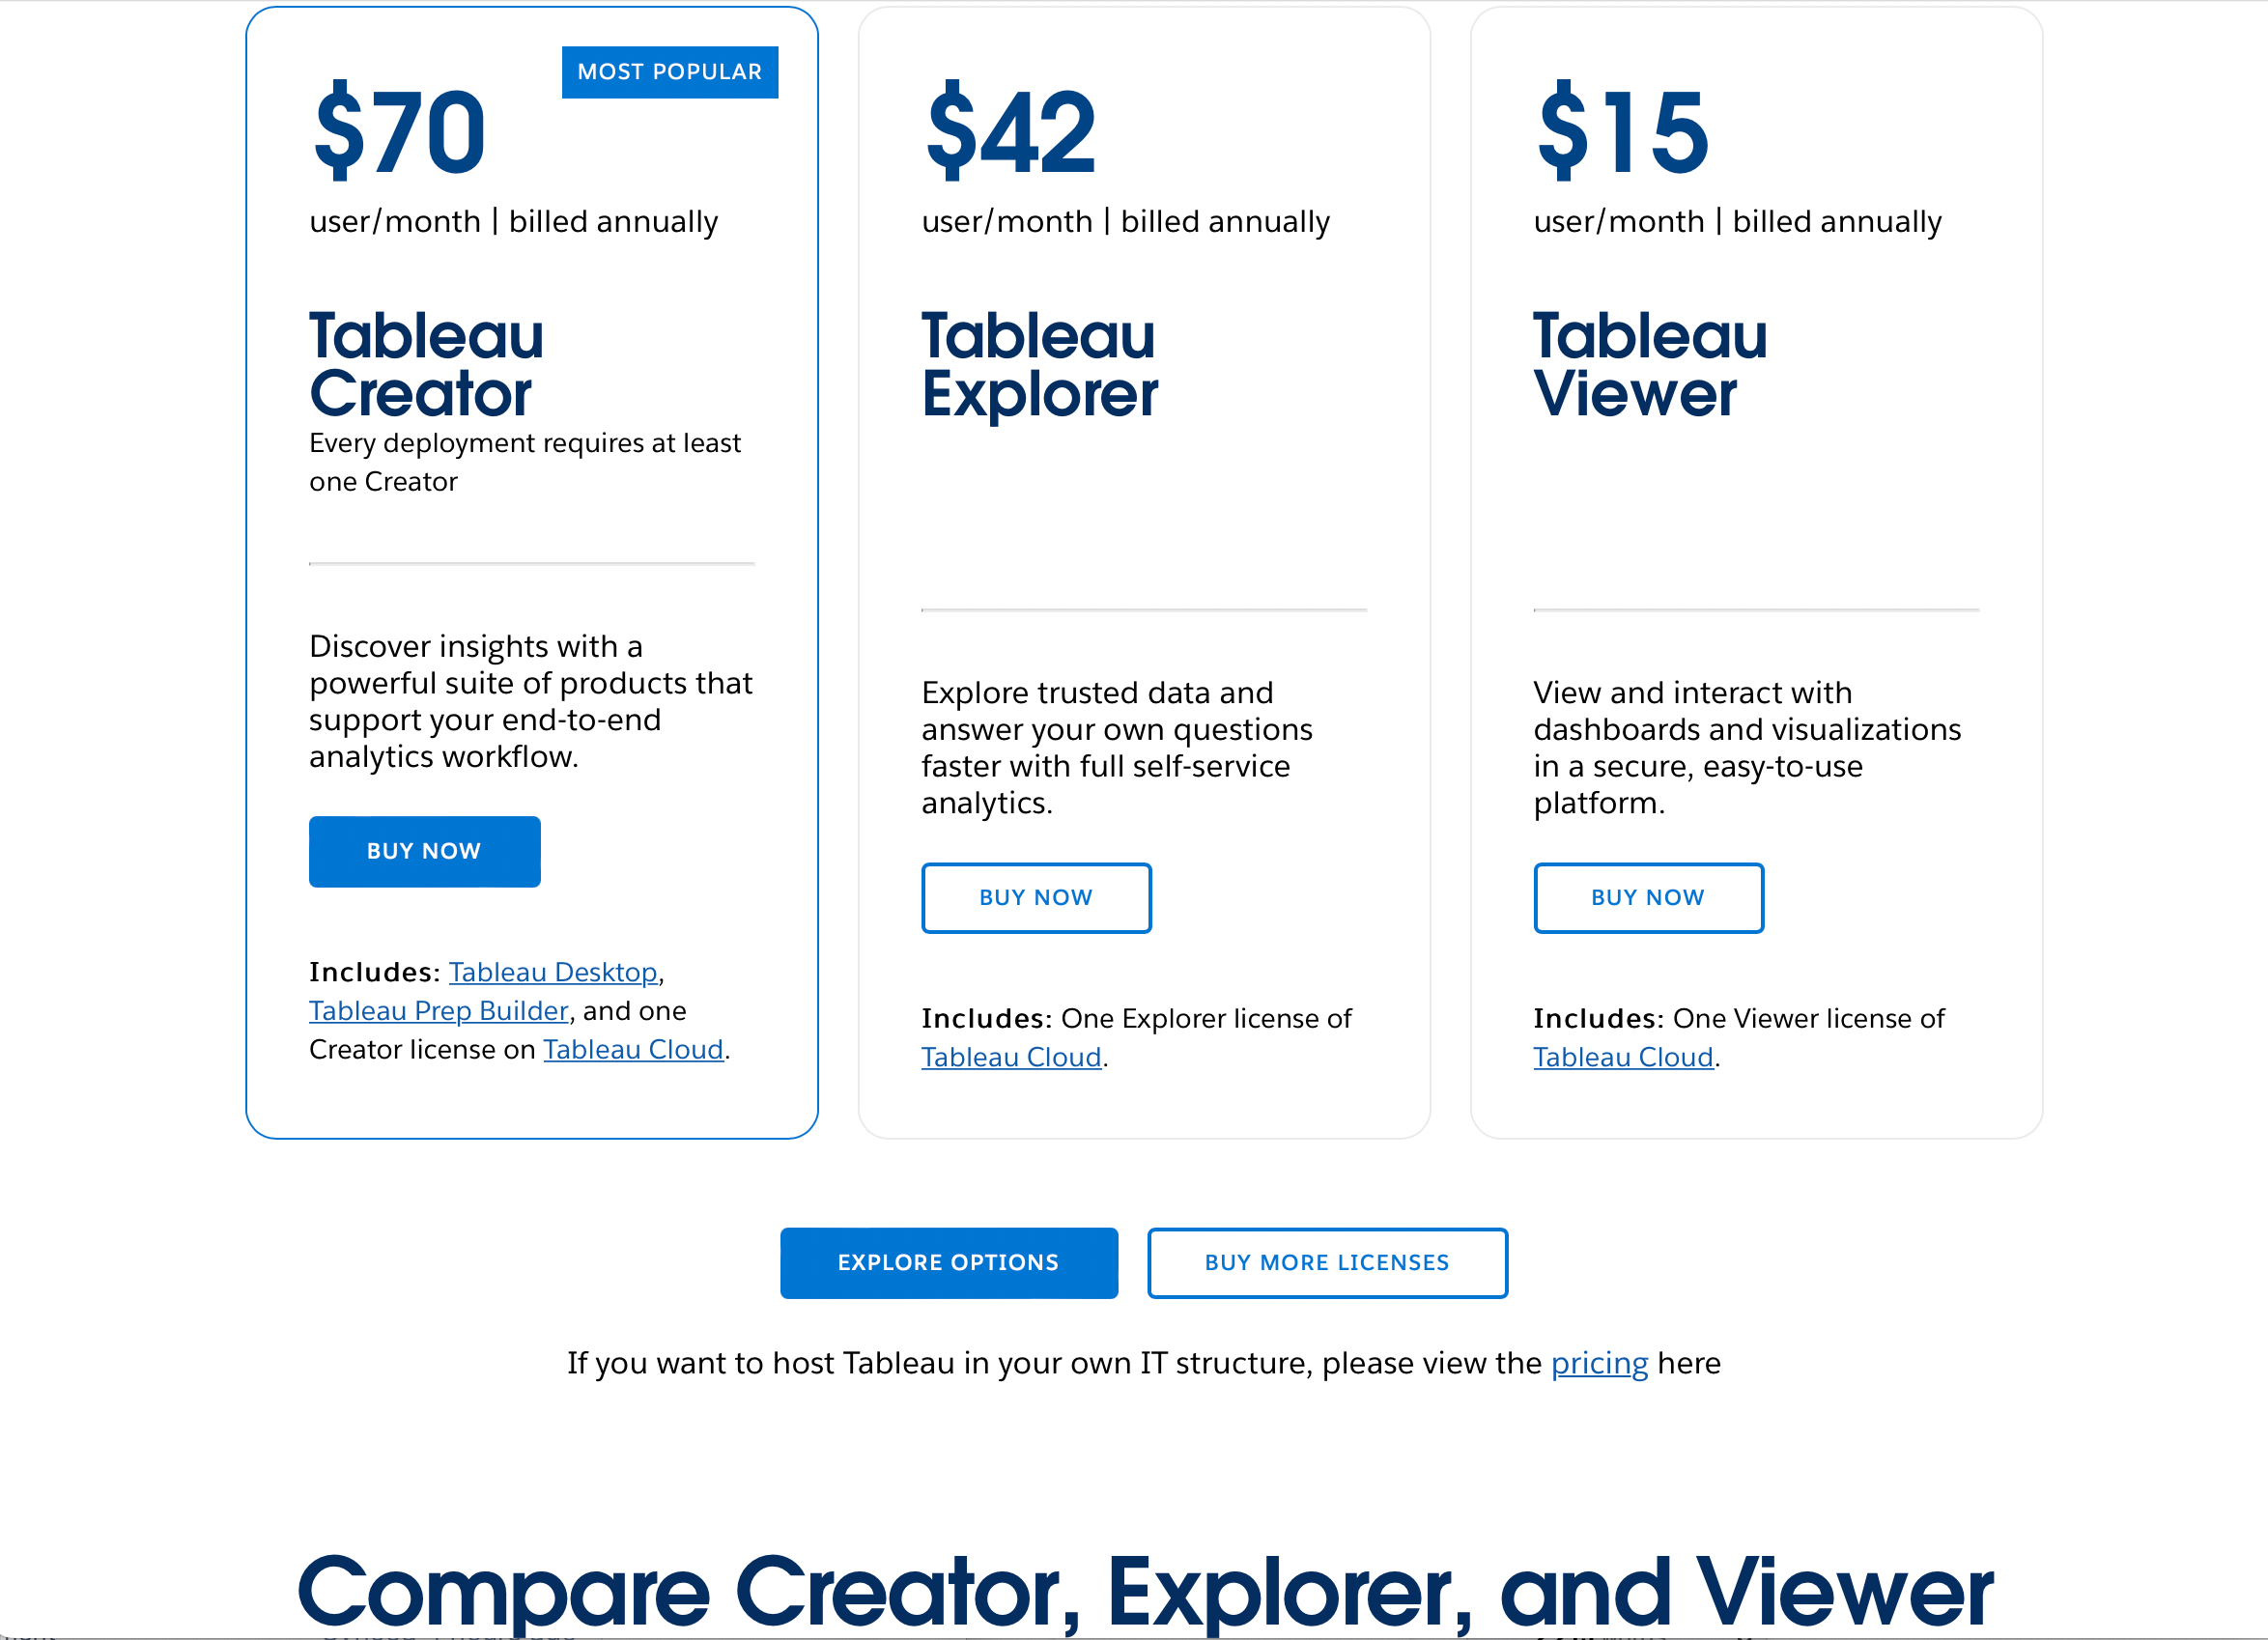
Tableau offers a free plan and multiple paid plans.

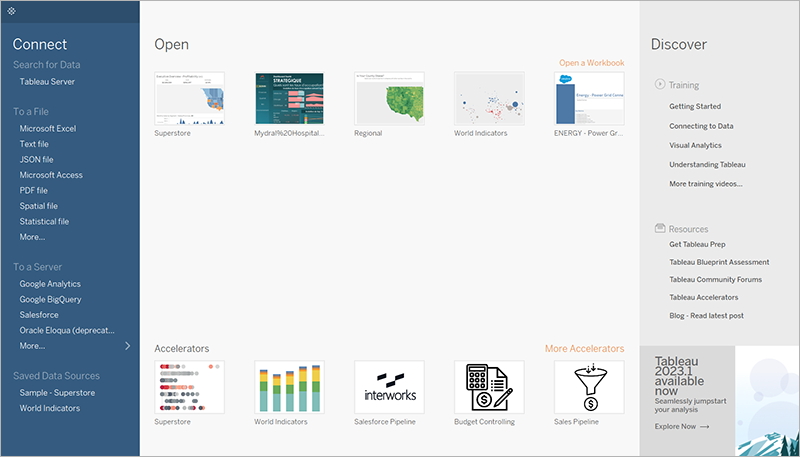
For free access, you can use Tableau Public, which allows users to connect to limited data sources, create visualizations, and share their work with the public.
For individuals, Tableau also offers a Tableau Creator paid plan costing $70 per user/month.
Alternatively, for businesses, the program offers 3 paid plans:
- Tableau Viewer costs $15 per user/month
- Tableau Explorer costs $42 per user/month
- Tableau Creator costs $70 per user/month
Key Tableau Features
Key features for Tableau include:
- User-Friendly Interface: Tableau’s intuitive and user-friendly interface makes it accessible to a wide range of users, regardless of their technical expertise.
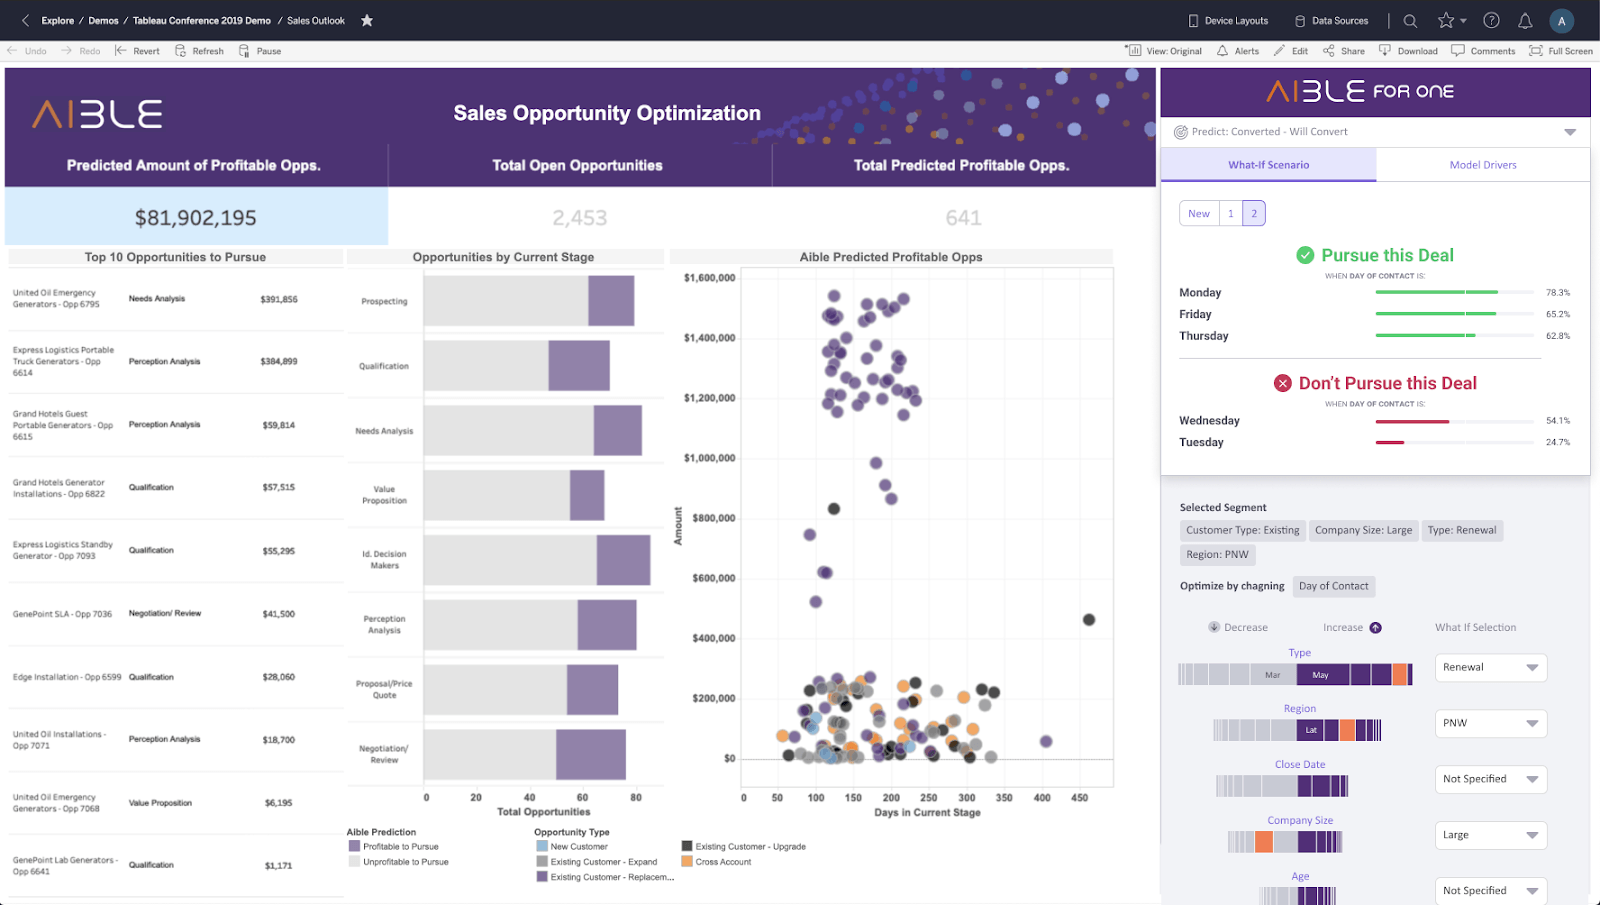
- Interactive Visualizations: The platform offers rich data visualization features, including interactive dashboards, animations, data mining, and geospatial mapping. You can easily create dashboards with complex visualizations.
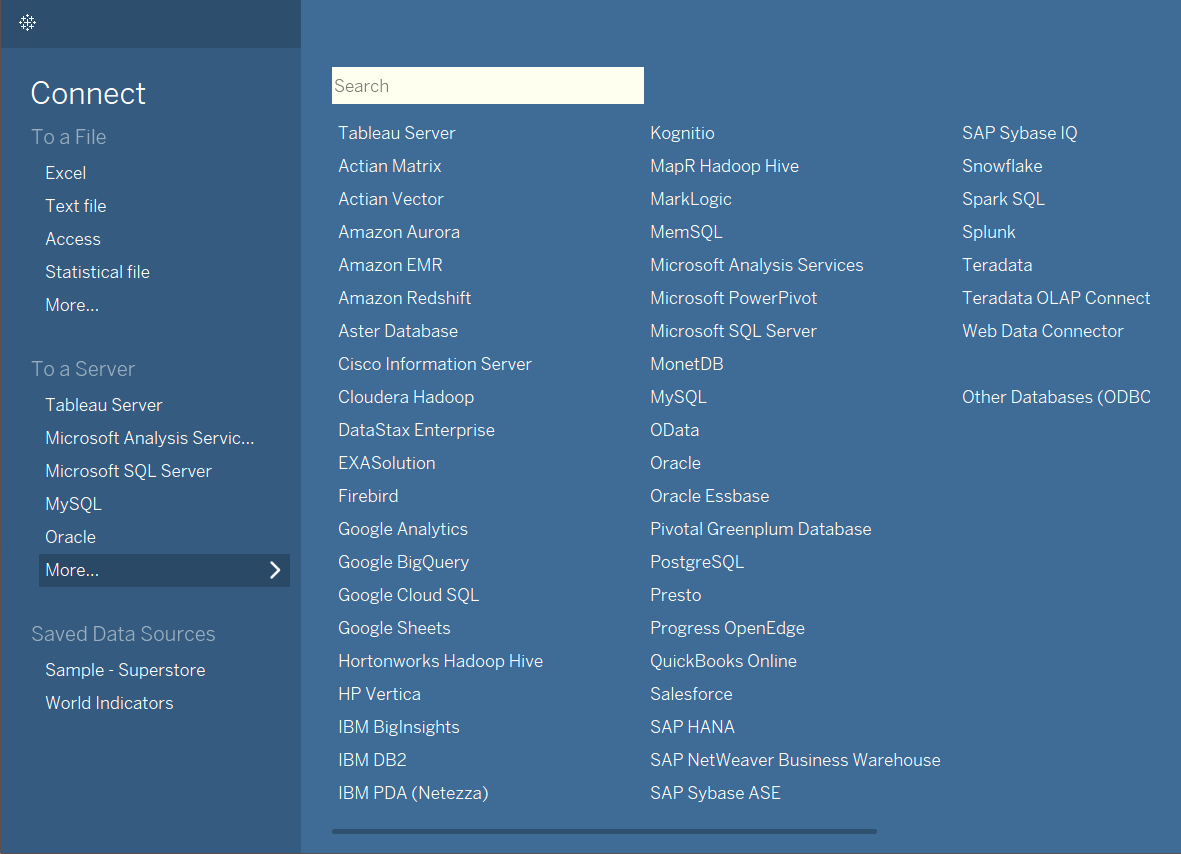
- Data Source Variety: It supports over 70 native data connectors and data warehouses and offers web data connectors to access data from web services.
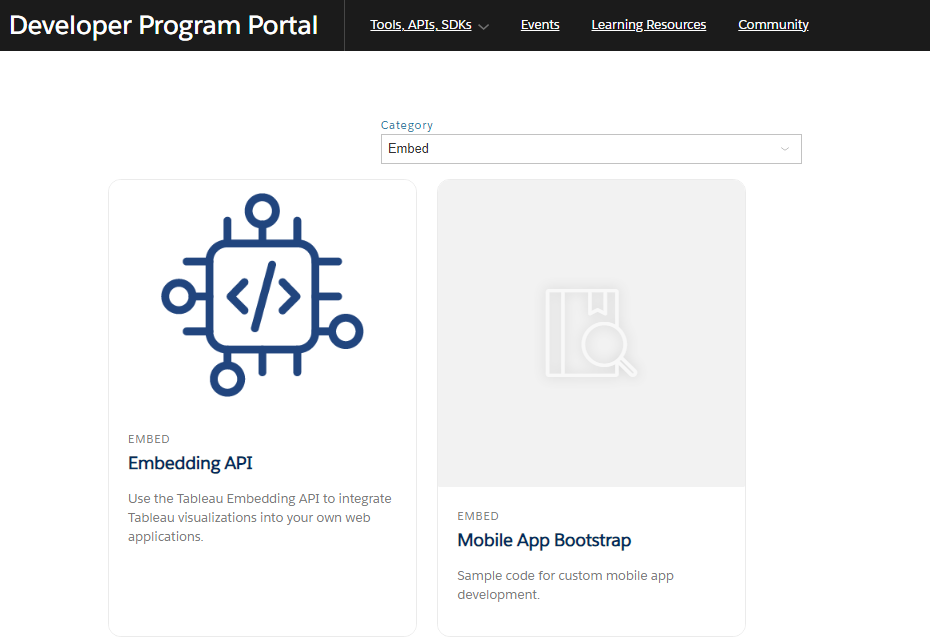
- Embedded Analytics: Tableau provides embedded analytics using Tableau’s JavaScript or REST APIs, allowing developers to integrate visualizations and dashboards into existing web applications.
- Scalability: Tableau can handle large datasets and complex data models without sacrificing performance. It’s also ideal if you want to automate workflows.
- Sharing and Collaboration: The platform offers Tableau Server and Tableau Online for effective collaboration and sharing of dashboards.
In addition to this, it offers seamless integration, customized reports, and data across the organization.
With all these valuable features, let’s look at how Tableau stacks up against Power BI.
Tableau vs. Power BI
Power BI Benefits
Both Power BI and Tableau are powerful and popular tools.
Here is where Power BI beats Tableau:
- Integration with Microsoft products: As a Microsoft product, Power BI easily integrates with other Microsoft products like SharePoint and Excel.
- Easy to use: Power BI has a more user-friendly interface than Tableau and is easier for those with little technical knowledge.
- Better handling of large data: Power BI can handle and process large data while Tableau has been known to have some difficulty handling large data sets.
Tableau Benefits
Here is where Tableau beats Power BI:
- Better customization options: With Tableau you are afforded better customization options for your reports and dashboard.
- Data source flexibility: Tableau allows you to connect to a lot more data sources than Power BI.
If Tableau is not a great fit for your business needs, consider this next option below.
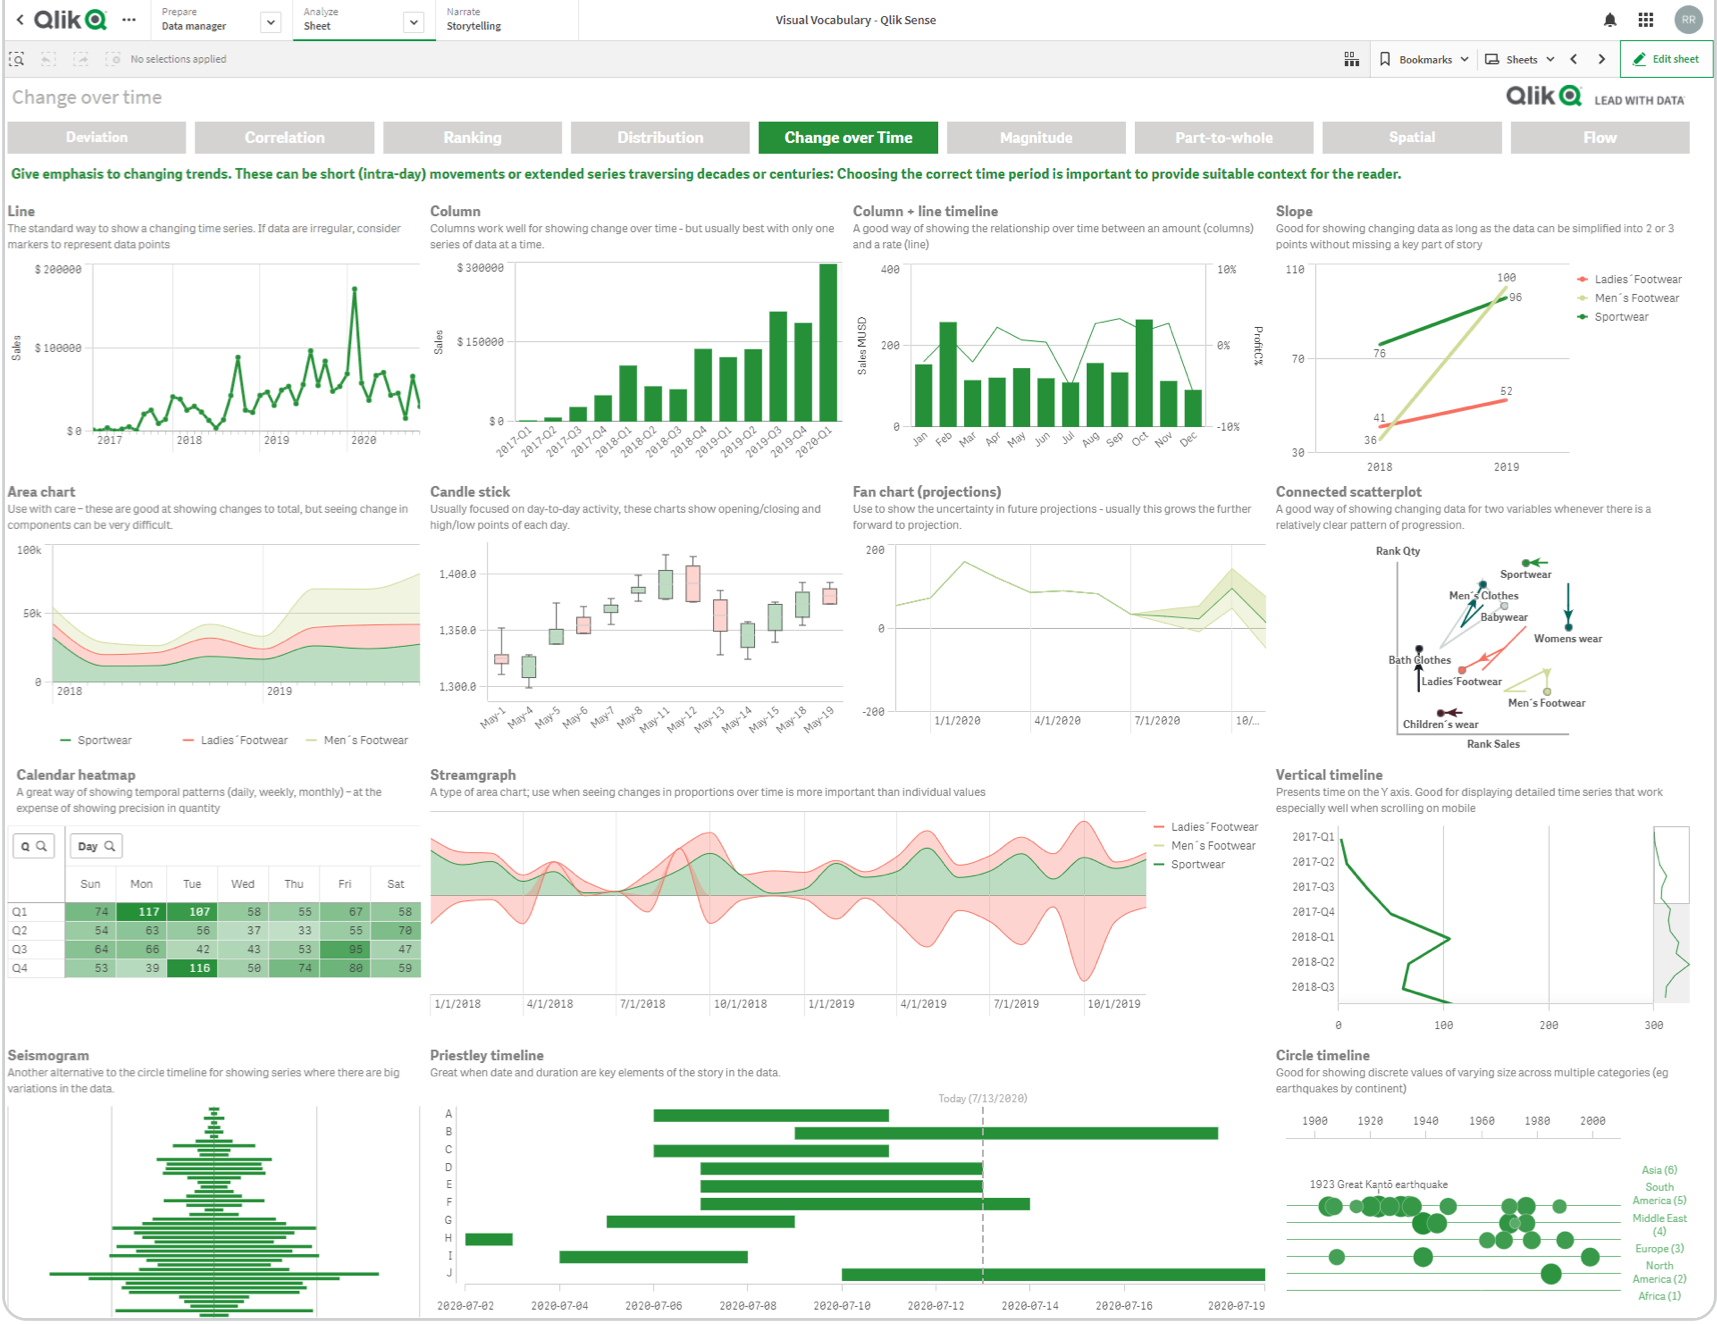
2. Qlik Sense
Qlik Sense offers a self-service visual analytics and business intelligence platform with dashboards, data exploration, embedded analytics, and more.
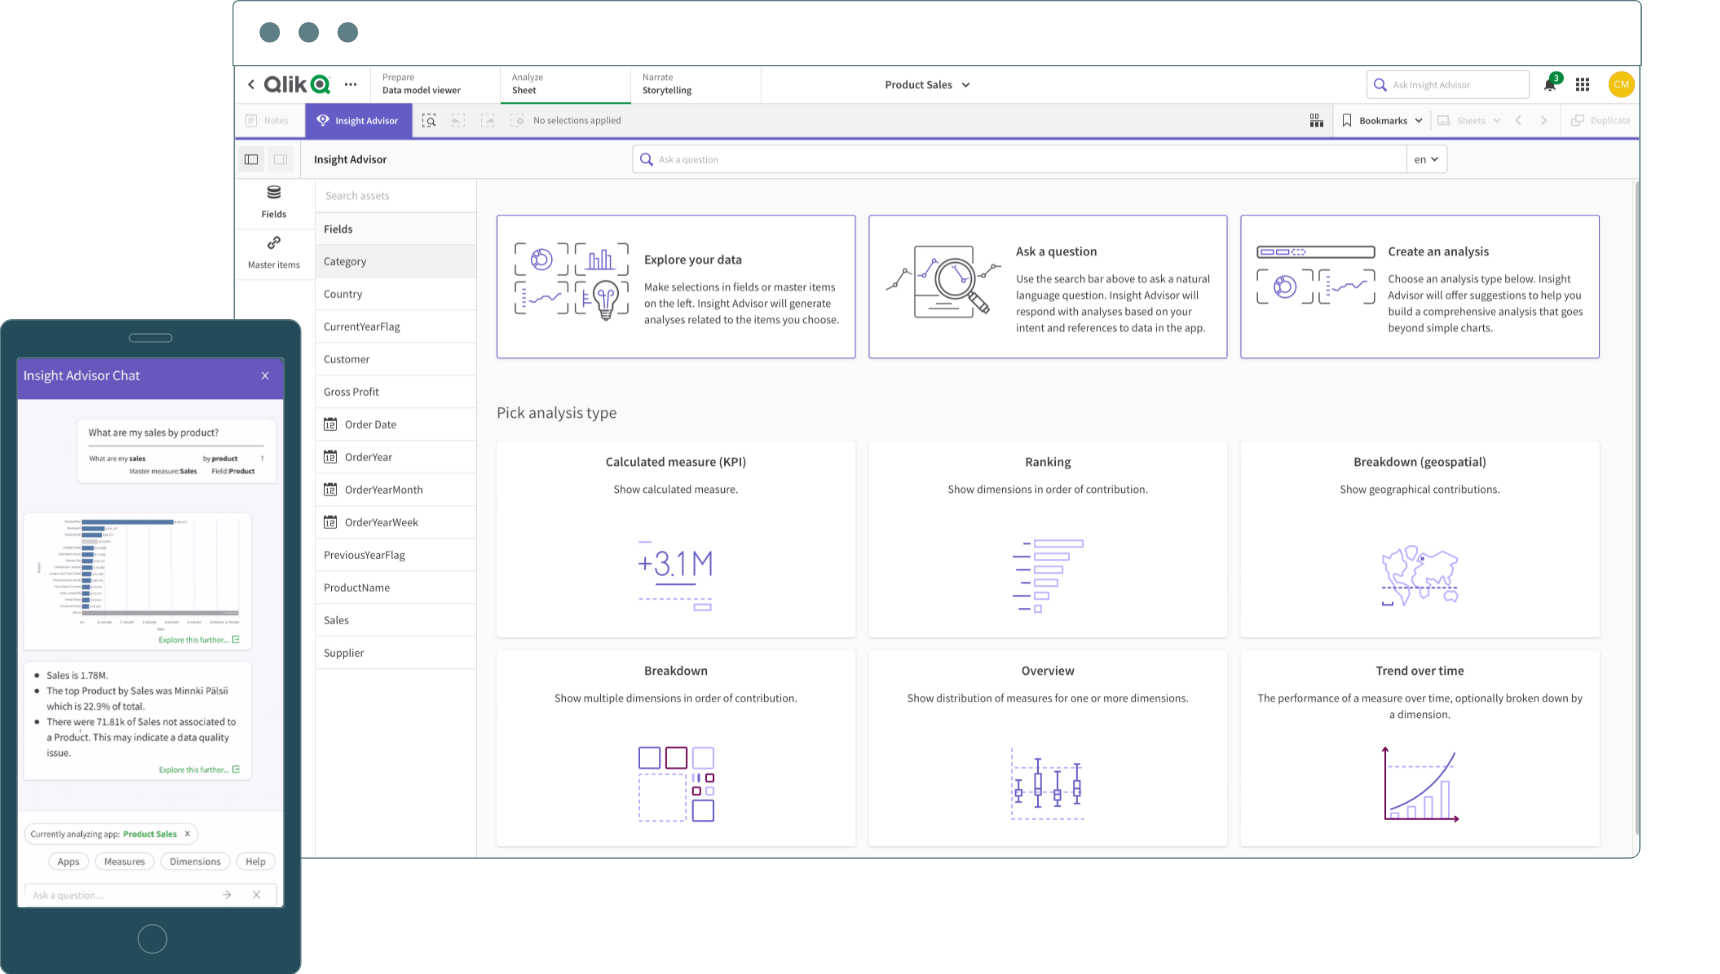
It comes with built-in AI and machine learning capabilities that provide suggestions on the best data visualization options.
Qlik Sense Cost
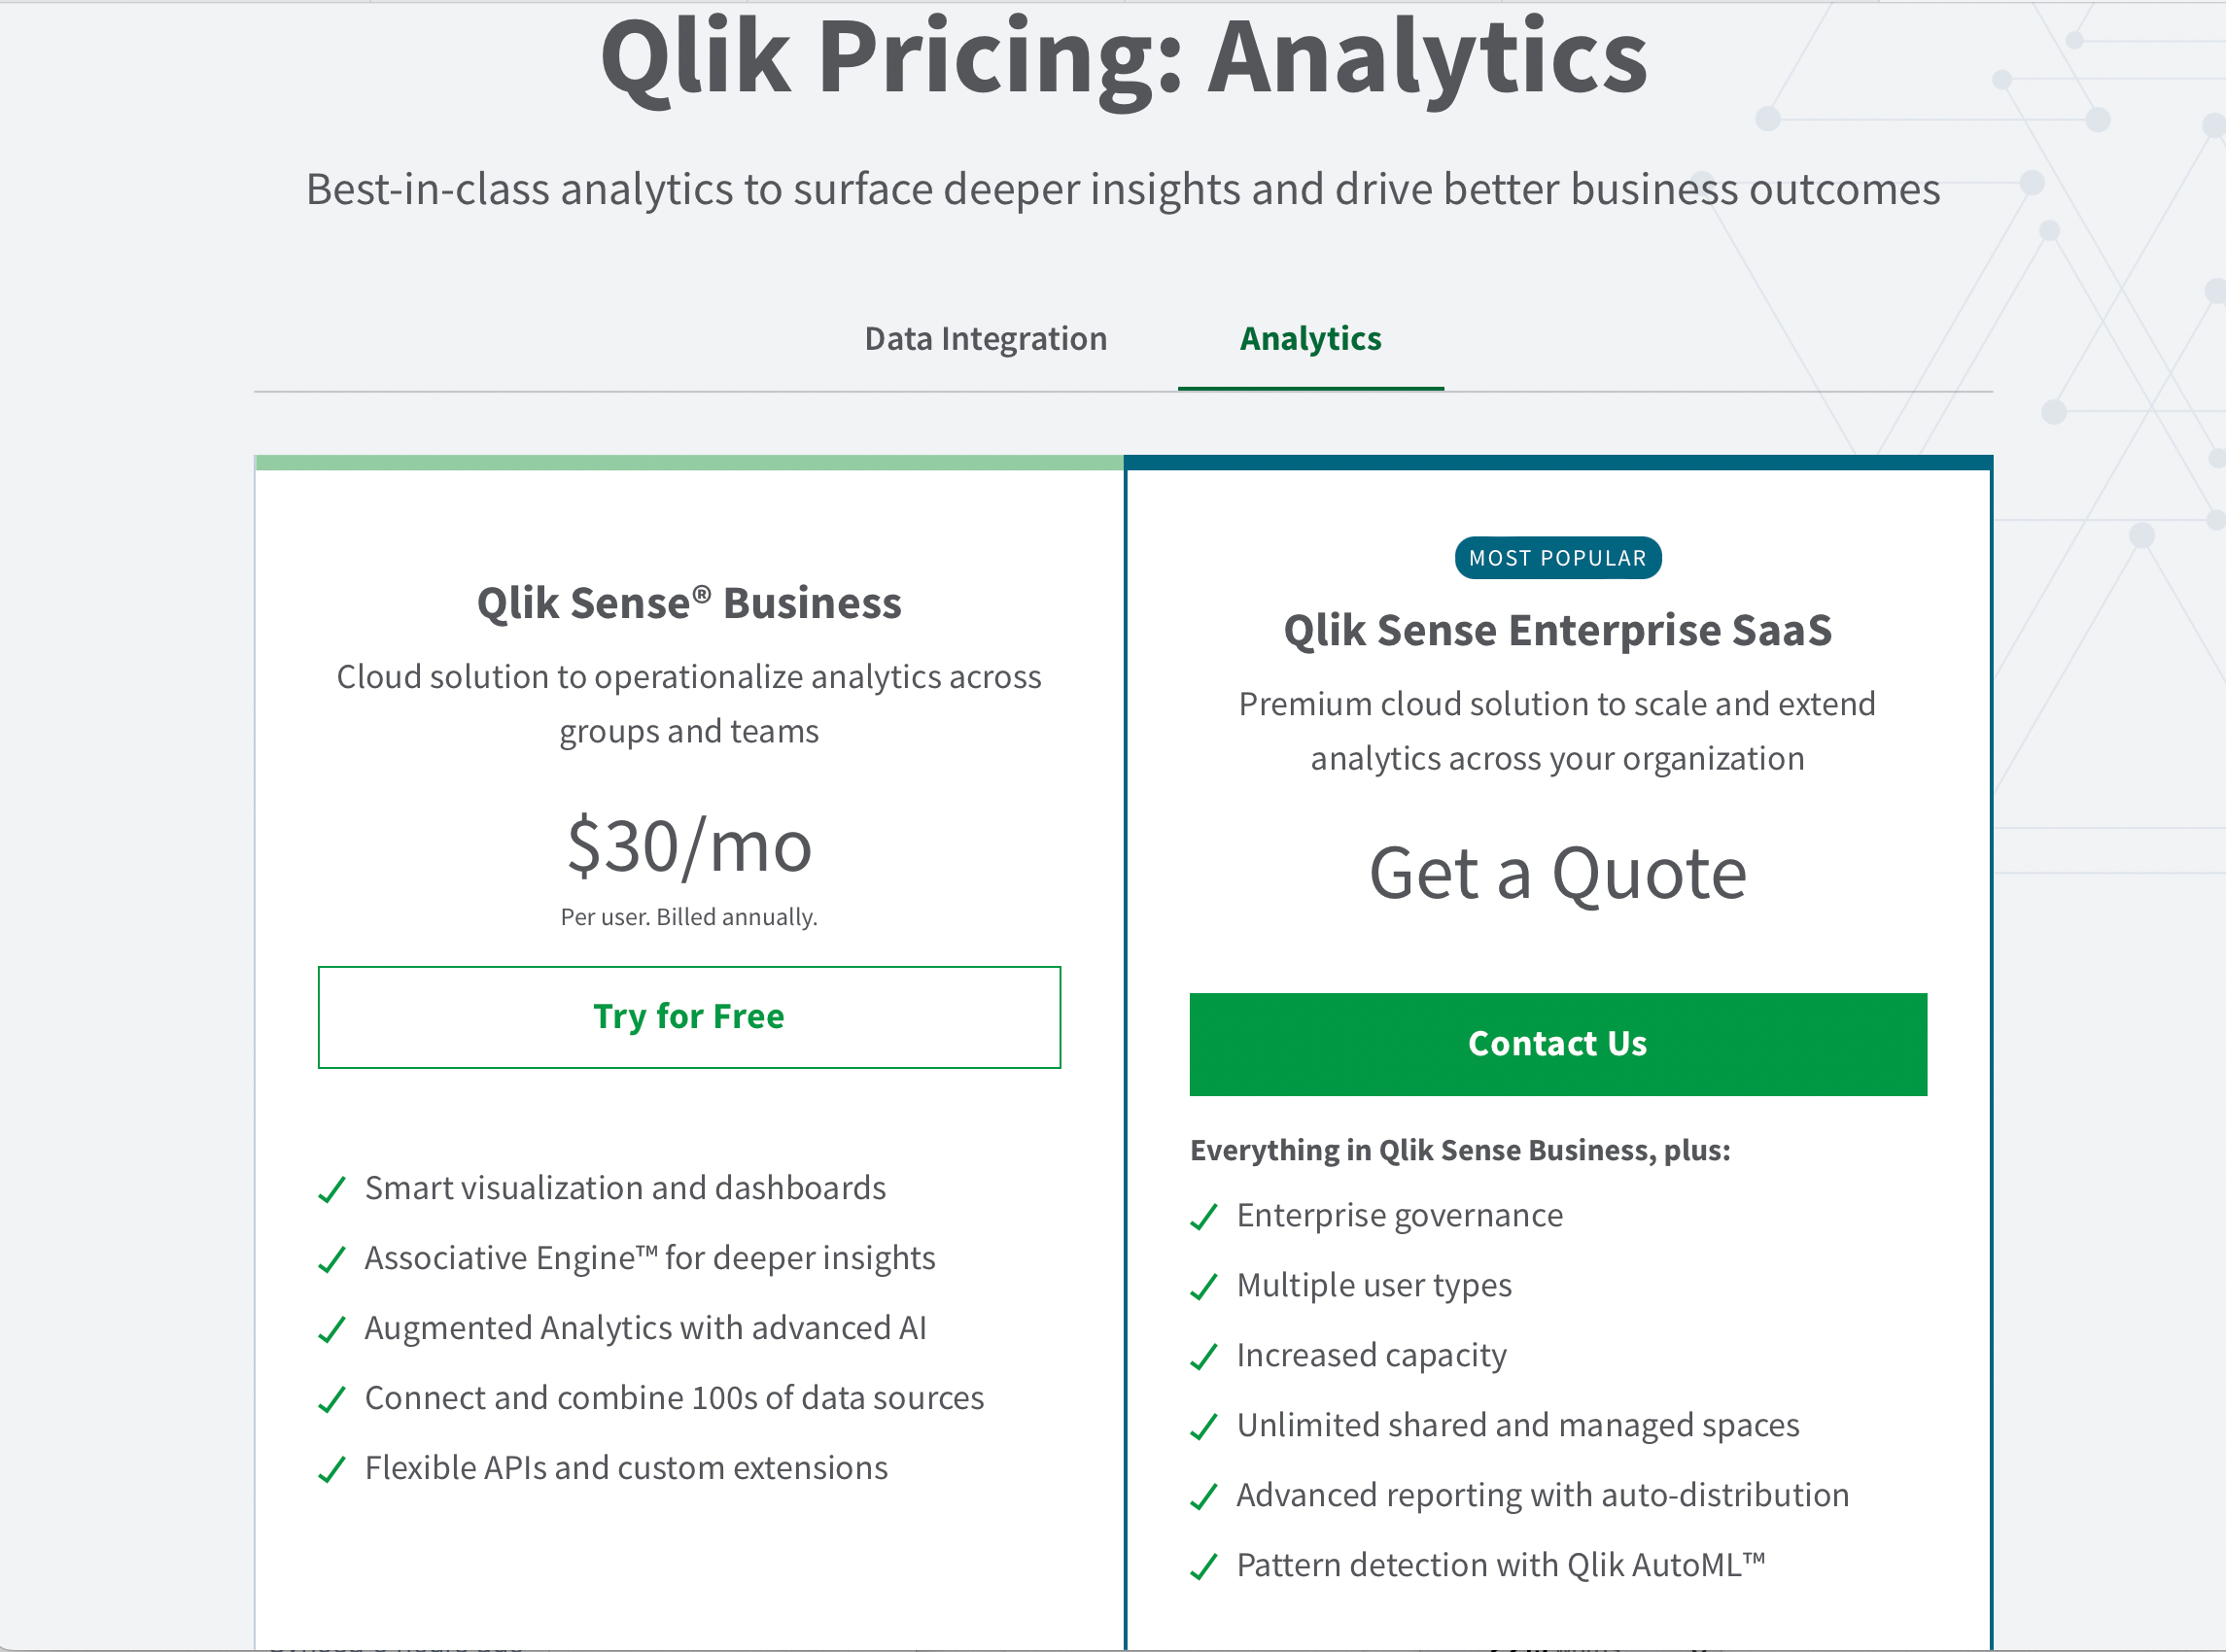
Qlik Sense offers two paid plans:
- Qlik Sense Business costs $30 per user/month. You can access a free trial (30 days) to try this plan before paying for the subscription.
- Qlik Sense Enterprise SaaS is meant for enterprise operations. For pricing, you must request a quote from the Qlik team.
Qlik Sense Key Features
Qlik Sense’s key features include:
- Associative Data Model: Qlik Sense’s unique associative model allows users to explore data without predefined paths or hierarchies.
- User-Friendly Interface: The platform’s user-friendly interface enables users to create visualizations and dashboards with no coding or technical skills required. This ensures it is accessible to a wide range of users.
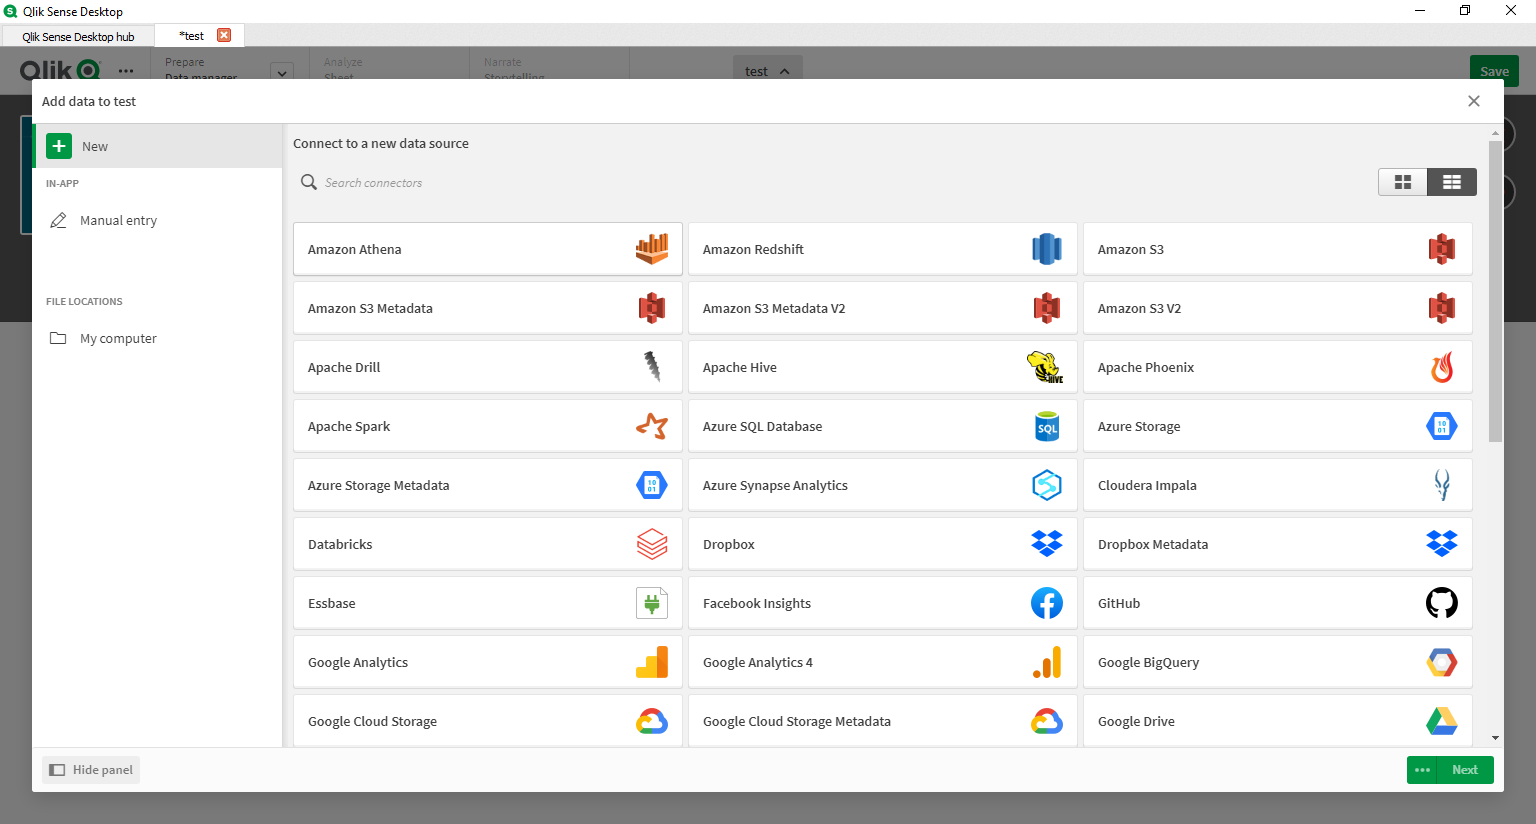
- Data Connectivity: Qlik Sense can connect to a variety of data sources, including databases, spreadsheets, cloud services, and web APIs.
- Interactive Visualizations: Qlik Sense focuses on interactive data discovery and analysis through its associative engine. It offers a variety of visualizations, including maps, histograms, and scatter plots.
- Smart Search: Using Qlik Sense’s powerful search functionality, you can type in keywords or questions to instantly find relevant data points.
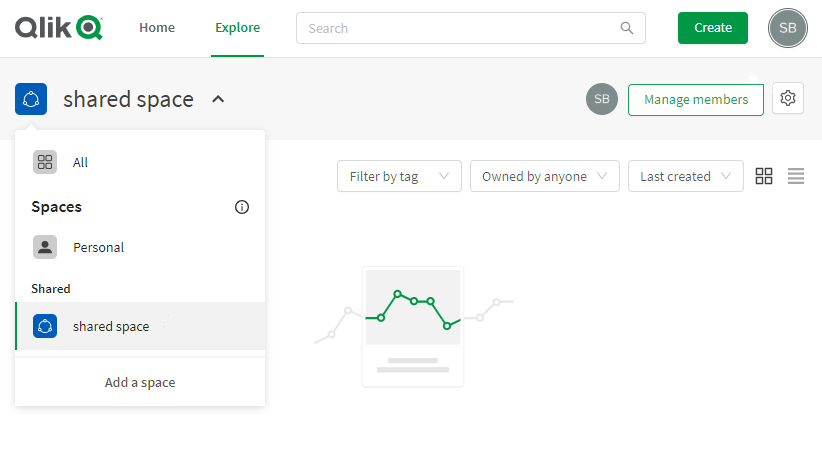
- Collaboration: Qlik Sense offers sharing and collaboration features, allowing users to publish and share their visualizations and dashboards with colleagues, clients, or stakeholders.
Now let’s look at how Qlik Sense stacks up against Power BI.
Qlik Sense vs. Power BI
Power BI Benefits
- Affordable: Power BI offers a limited free plan and more affordable paid plans. Qlik Sense also requires you to get a quote for its Enterprise SaaS plan.
- Easy to use: As a popular tool with a user-friendly interface, users generally find Power BI easier to navigate. Excel users in particular enjoy Power BI because of its simple learning curve.
- Easy installation: Power BI installation is easy while Qlik Sense installation can be complicated and may require an expert.

Qlik Sense Benefits
- Mobile accessibility: Qlik Sense offers better features and capabilities on mobile devices than Power BI.
- Better drill down and around features: Qlik Sense’s drill down and around features are more advanced when compared to Power BI’s.
As you consider Qlik Sense, take a look at yet another alternative below.

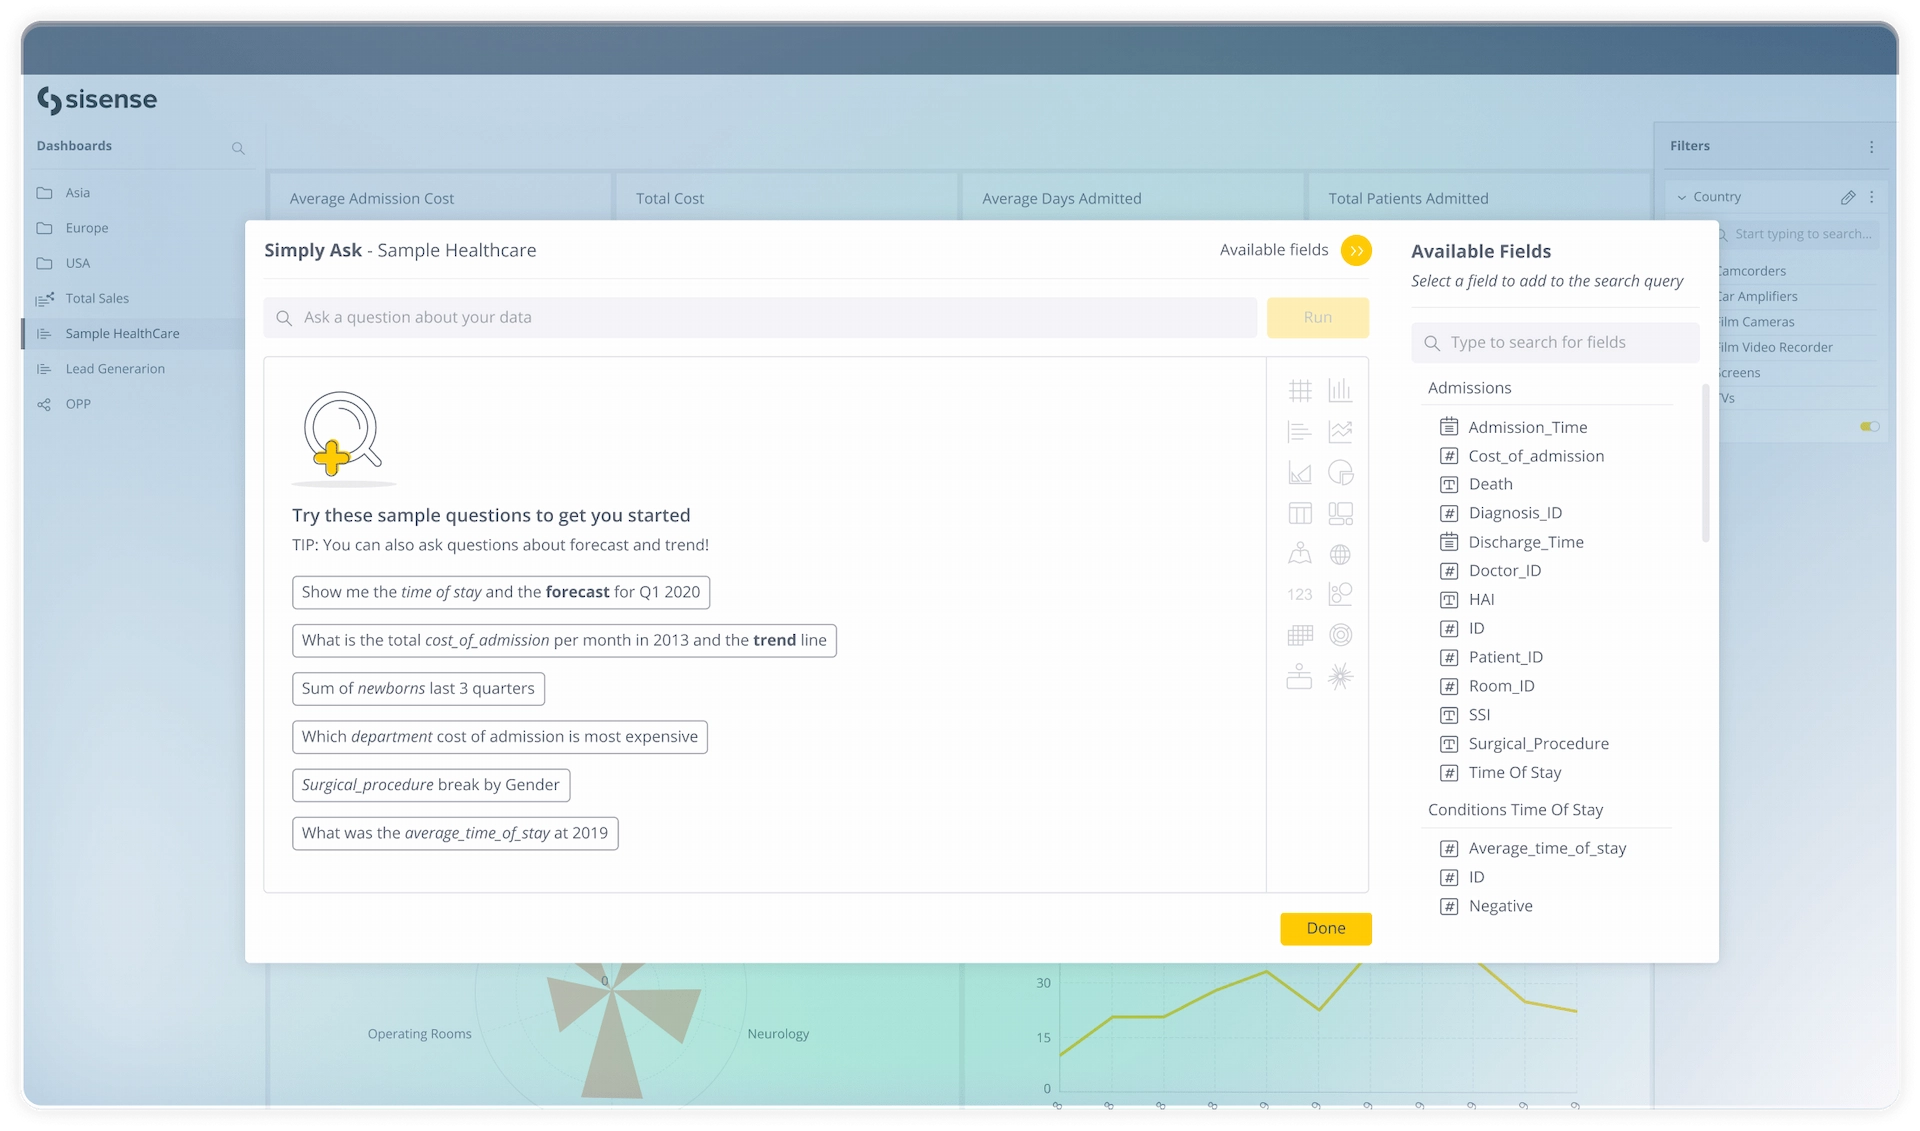
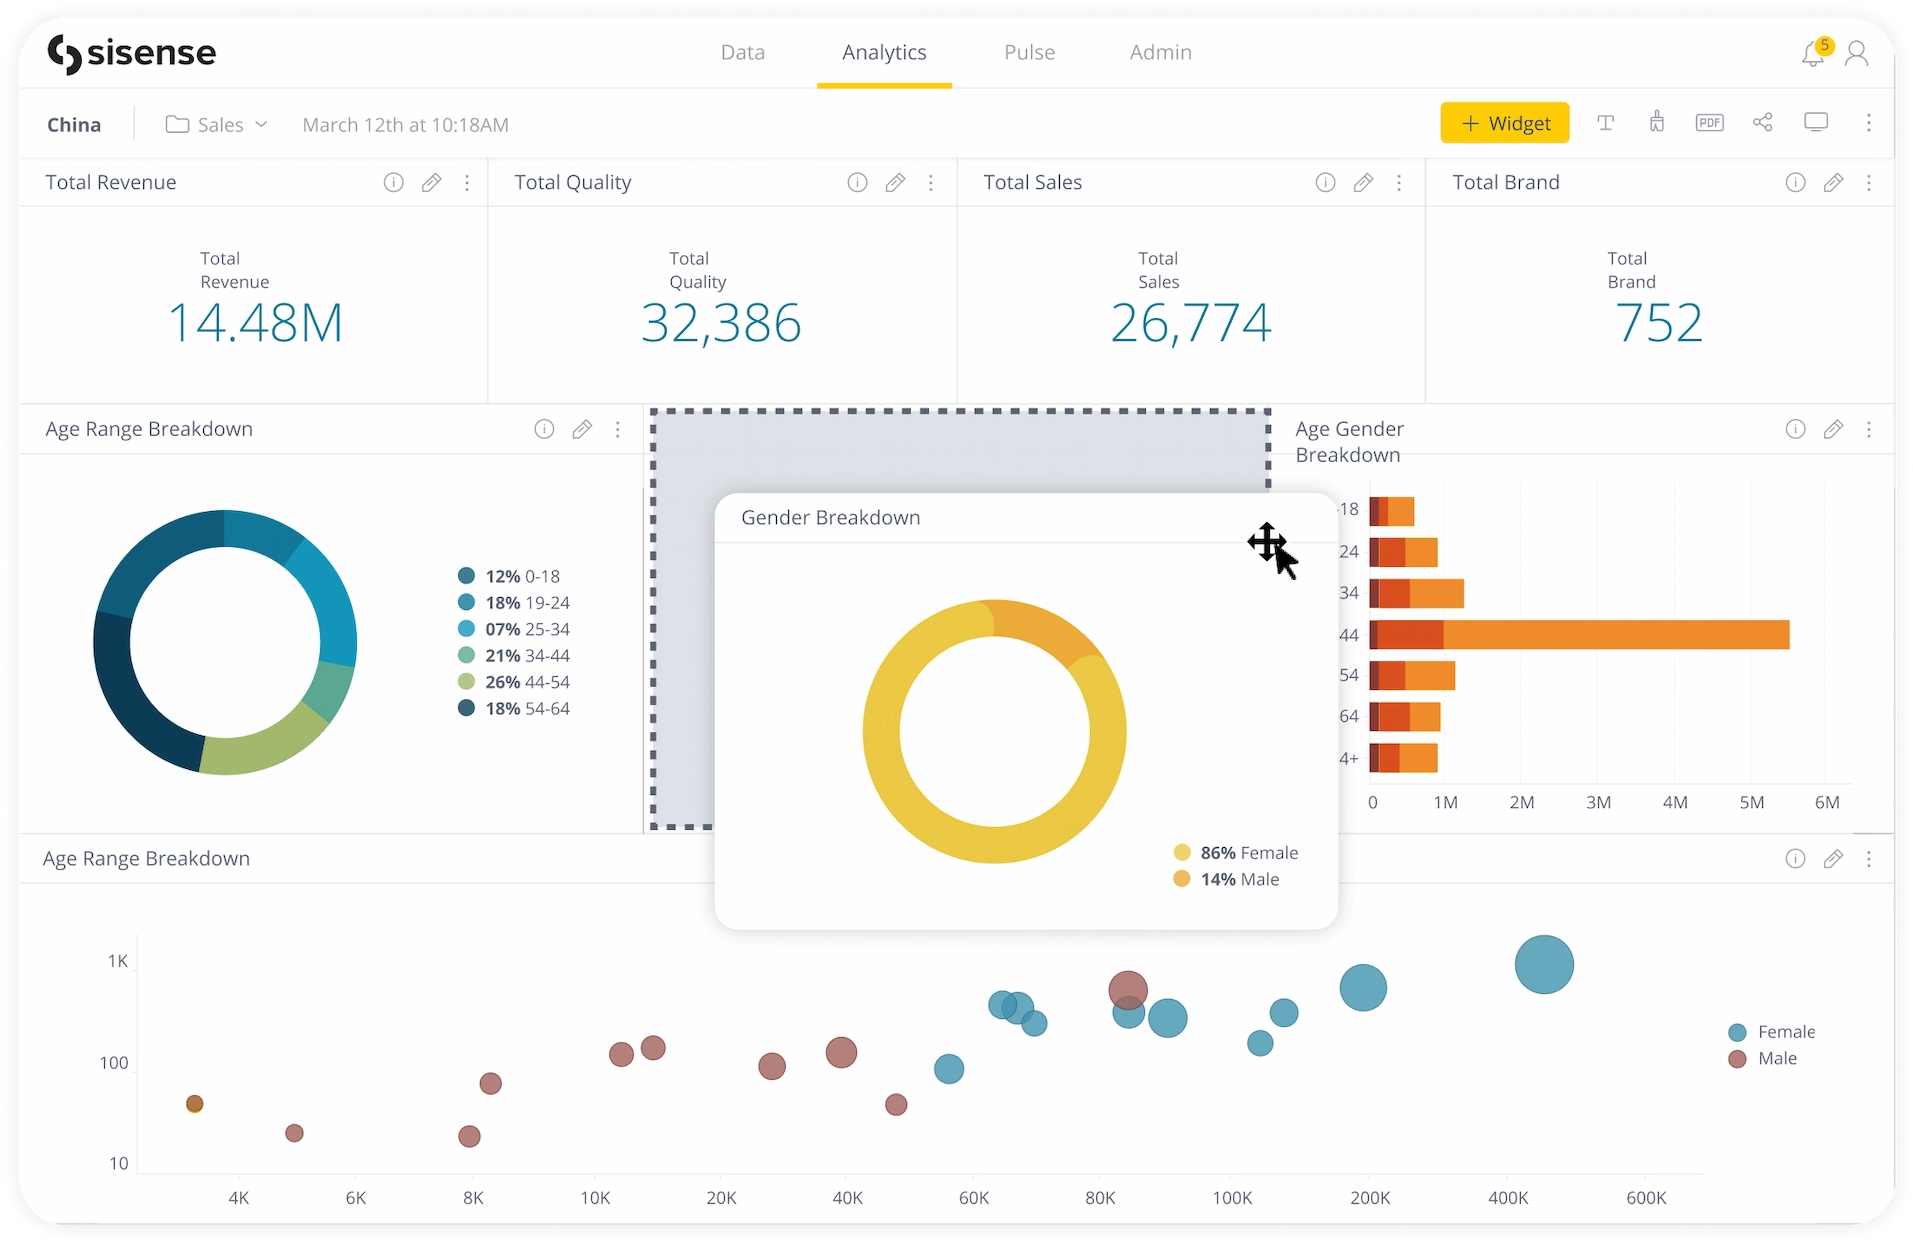
3. Sisense
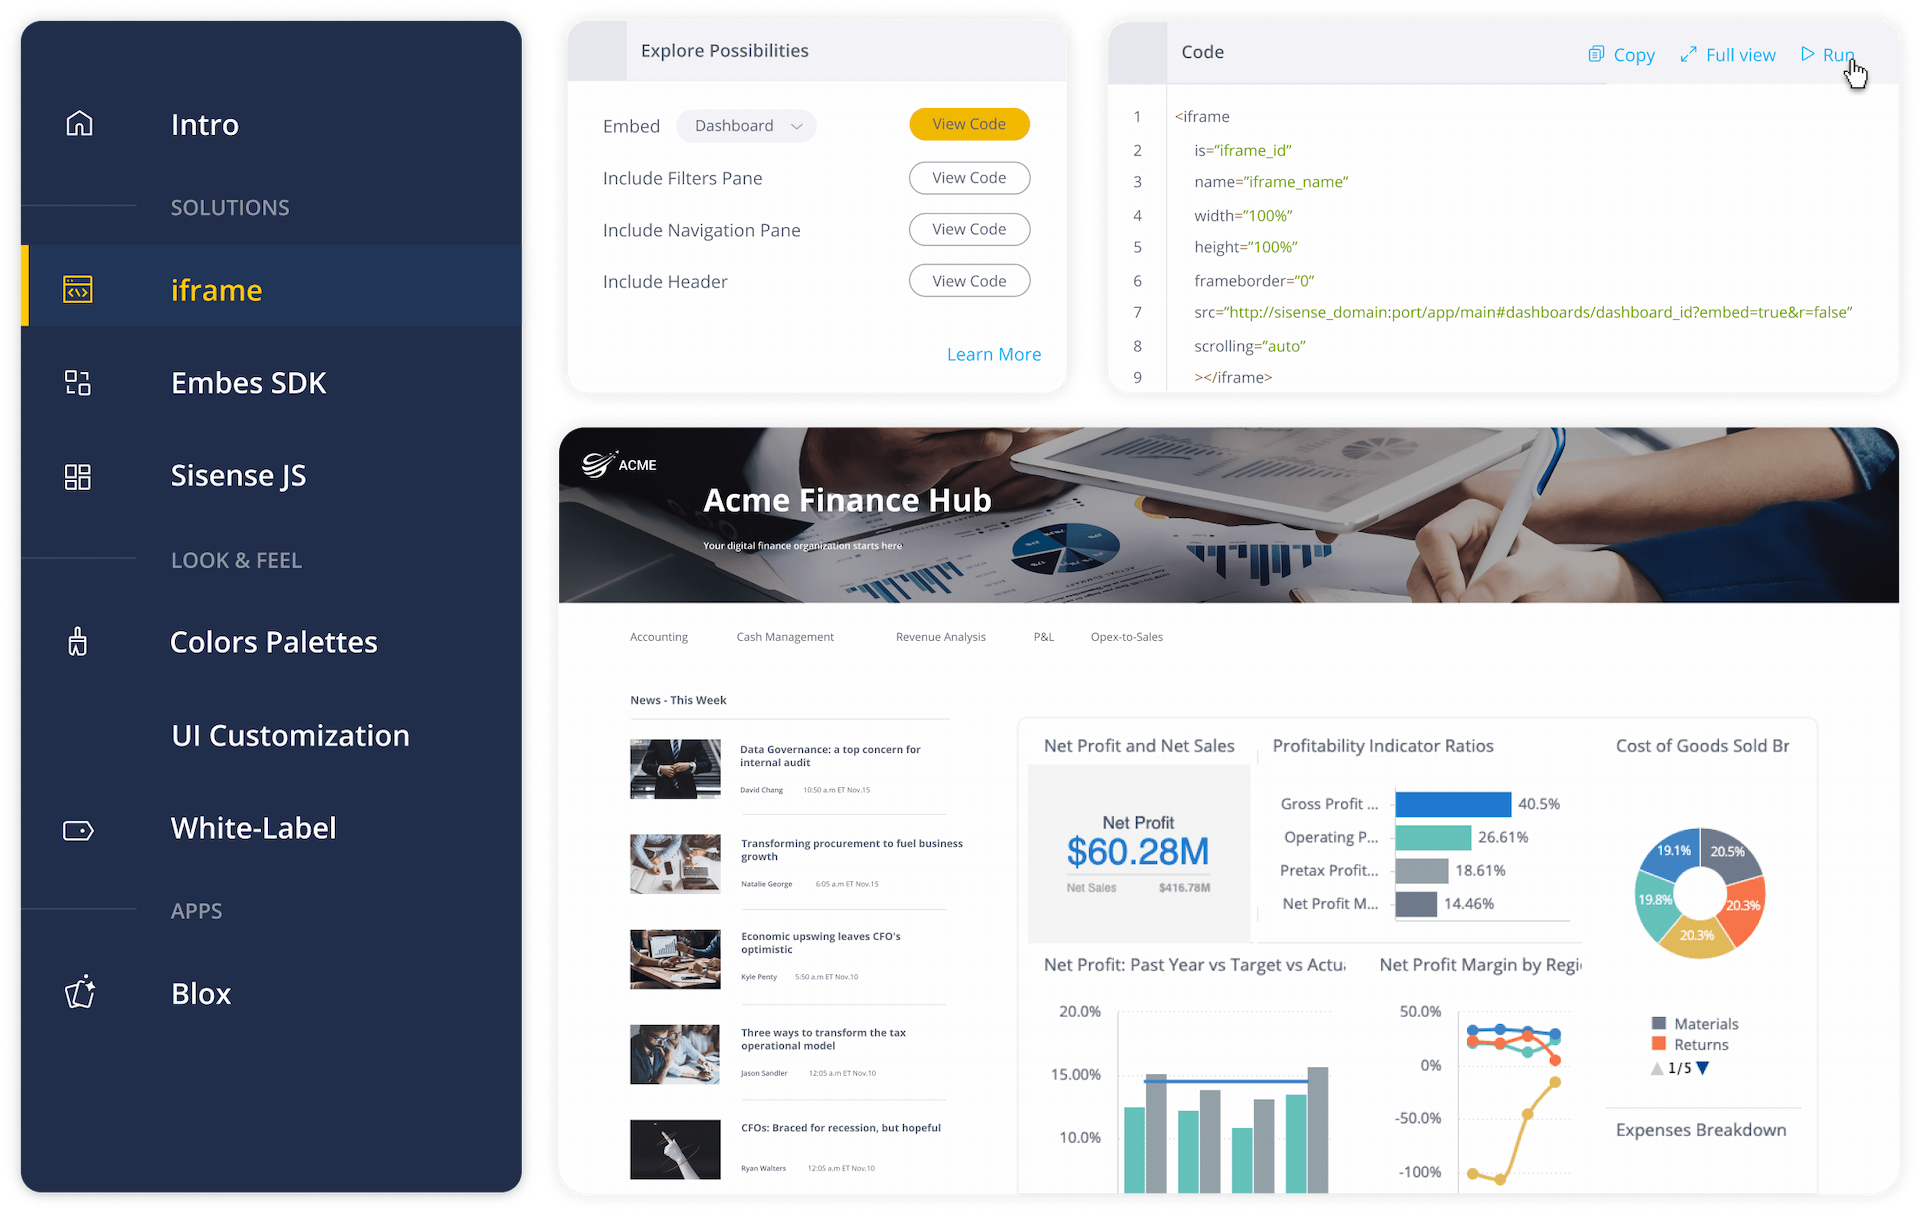
Sisense is an end-to-end BI platform that aims to simplify complex data analysis with its intuitive and user-friendly interface.
This powerful analytics tool allows users to create and share insights using a variety of visualization options, including customizable dashboards.
Sisense Cost
Sisense pricing is available by quote only and does not have set-priced plans.
Sisense Key Features
Sisense key features include:
- Data Visualization: Sisense provides an intuitive drag-and-drop interface to build visualizations and dashboards. It also offers advanced visualizations, such as treemaps and sunburst charts.
- AI-Powered Analytics: It incorporates artificial intelligence and machine learning capabilities to provide predictive and prescriptive analytics.
- Data Connectors: Sisense offers extensive connectors to various databases and cloud services, including MongoDB, Google Analytics, and Salesforce.
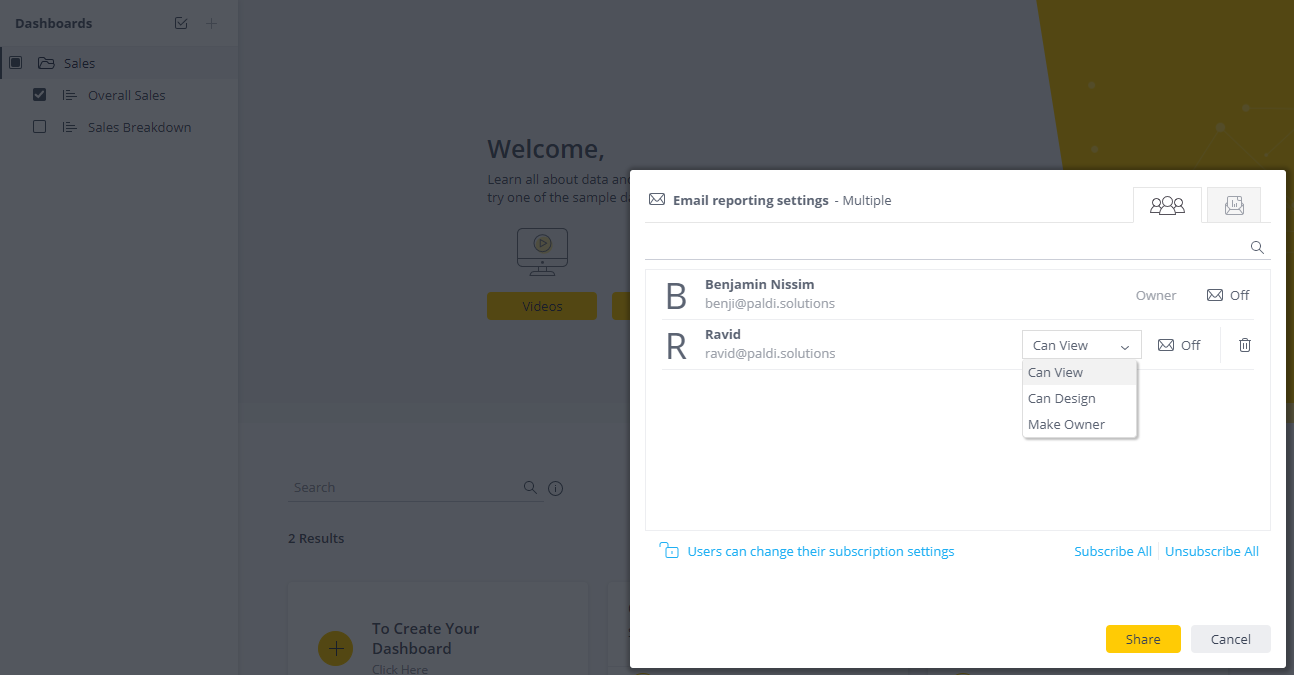
- Collaboration: The platform has sharing capabilities through email, scheduled reports, and embedding, as well as team collaboration features like annotations and comments on dashboards.
- Extensibility: Offers a comprehensive set of APIs and SDKs for developers to integrate analytics and visualizations into web applications and other products.
- Mobile Accessibility: Sisense delivers a responsive web interface and a well-designed mobile app.
So, how does Sisense match up to Power BI?
Sisense vs. Power BI
Power BI Benefits
- Affordable: Power BI offers a free plan while Sisense does not.
- Better visualization: In terms of visualization capabilities, Power BI is more robust than Sisense and offers more visualization flexibility.
- Scalability: Power BI easily handles large business data sets better than Sisense does.
Sisense Benefits
- Quote-based plan: Sisense’s quote-based plan ensures you only pay for what your business needs.
- Unified data storage: It collects raw data from multiple sources and stores processes in a unified source.
Moving on to our next Power BI alternative.
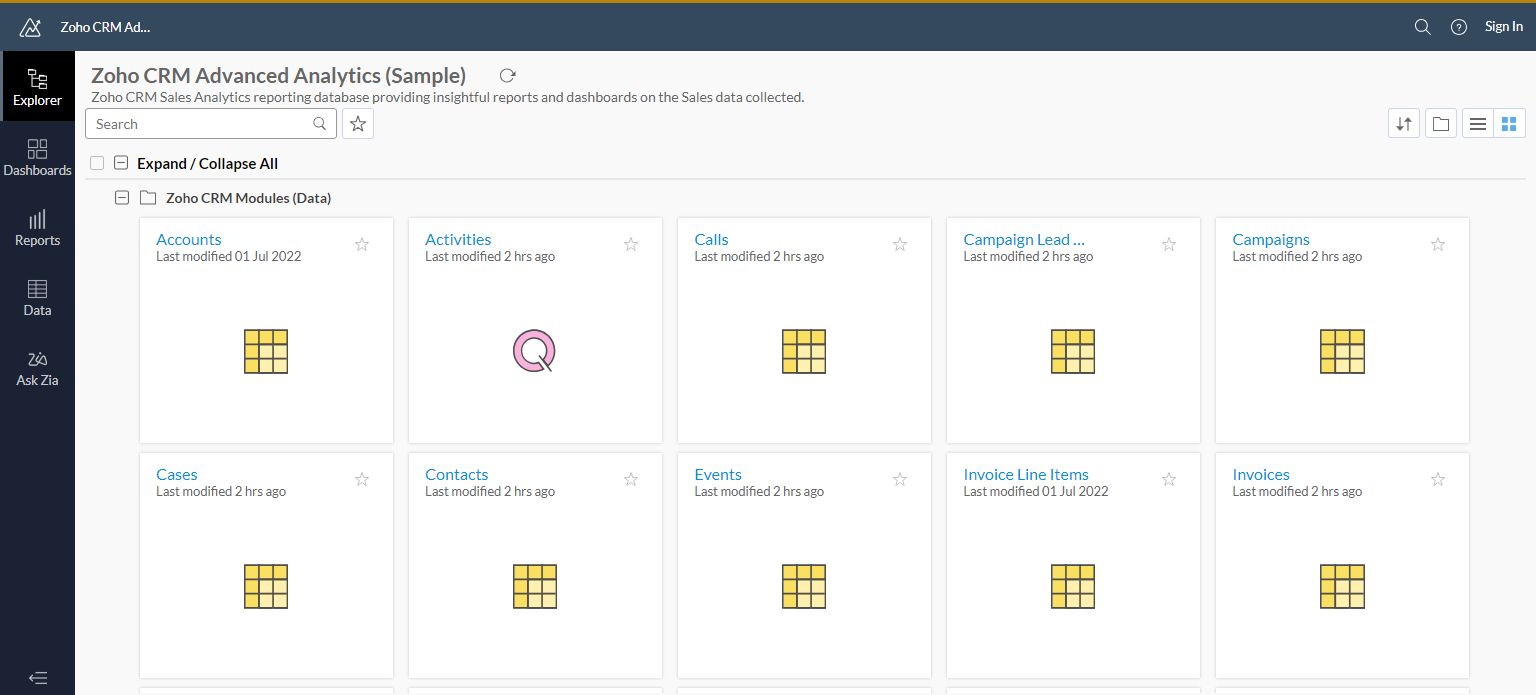
4. Zoho Analytics
Zoho Analytics is a comprehensive BI tool that allows users to create insightful reports and dashboards through its drag-and-drop interface.
It integrates with various third-party applications and supports a wide range of data storage options, enabling you to easily import data.
Zoho Analytics Cost
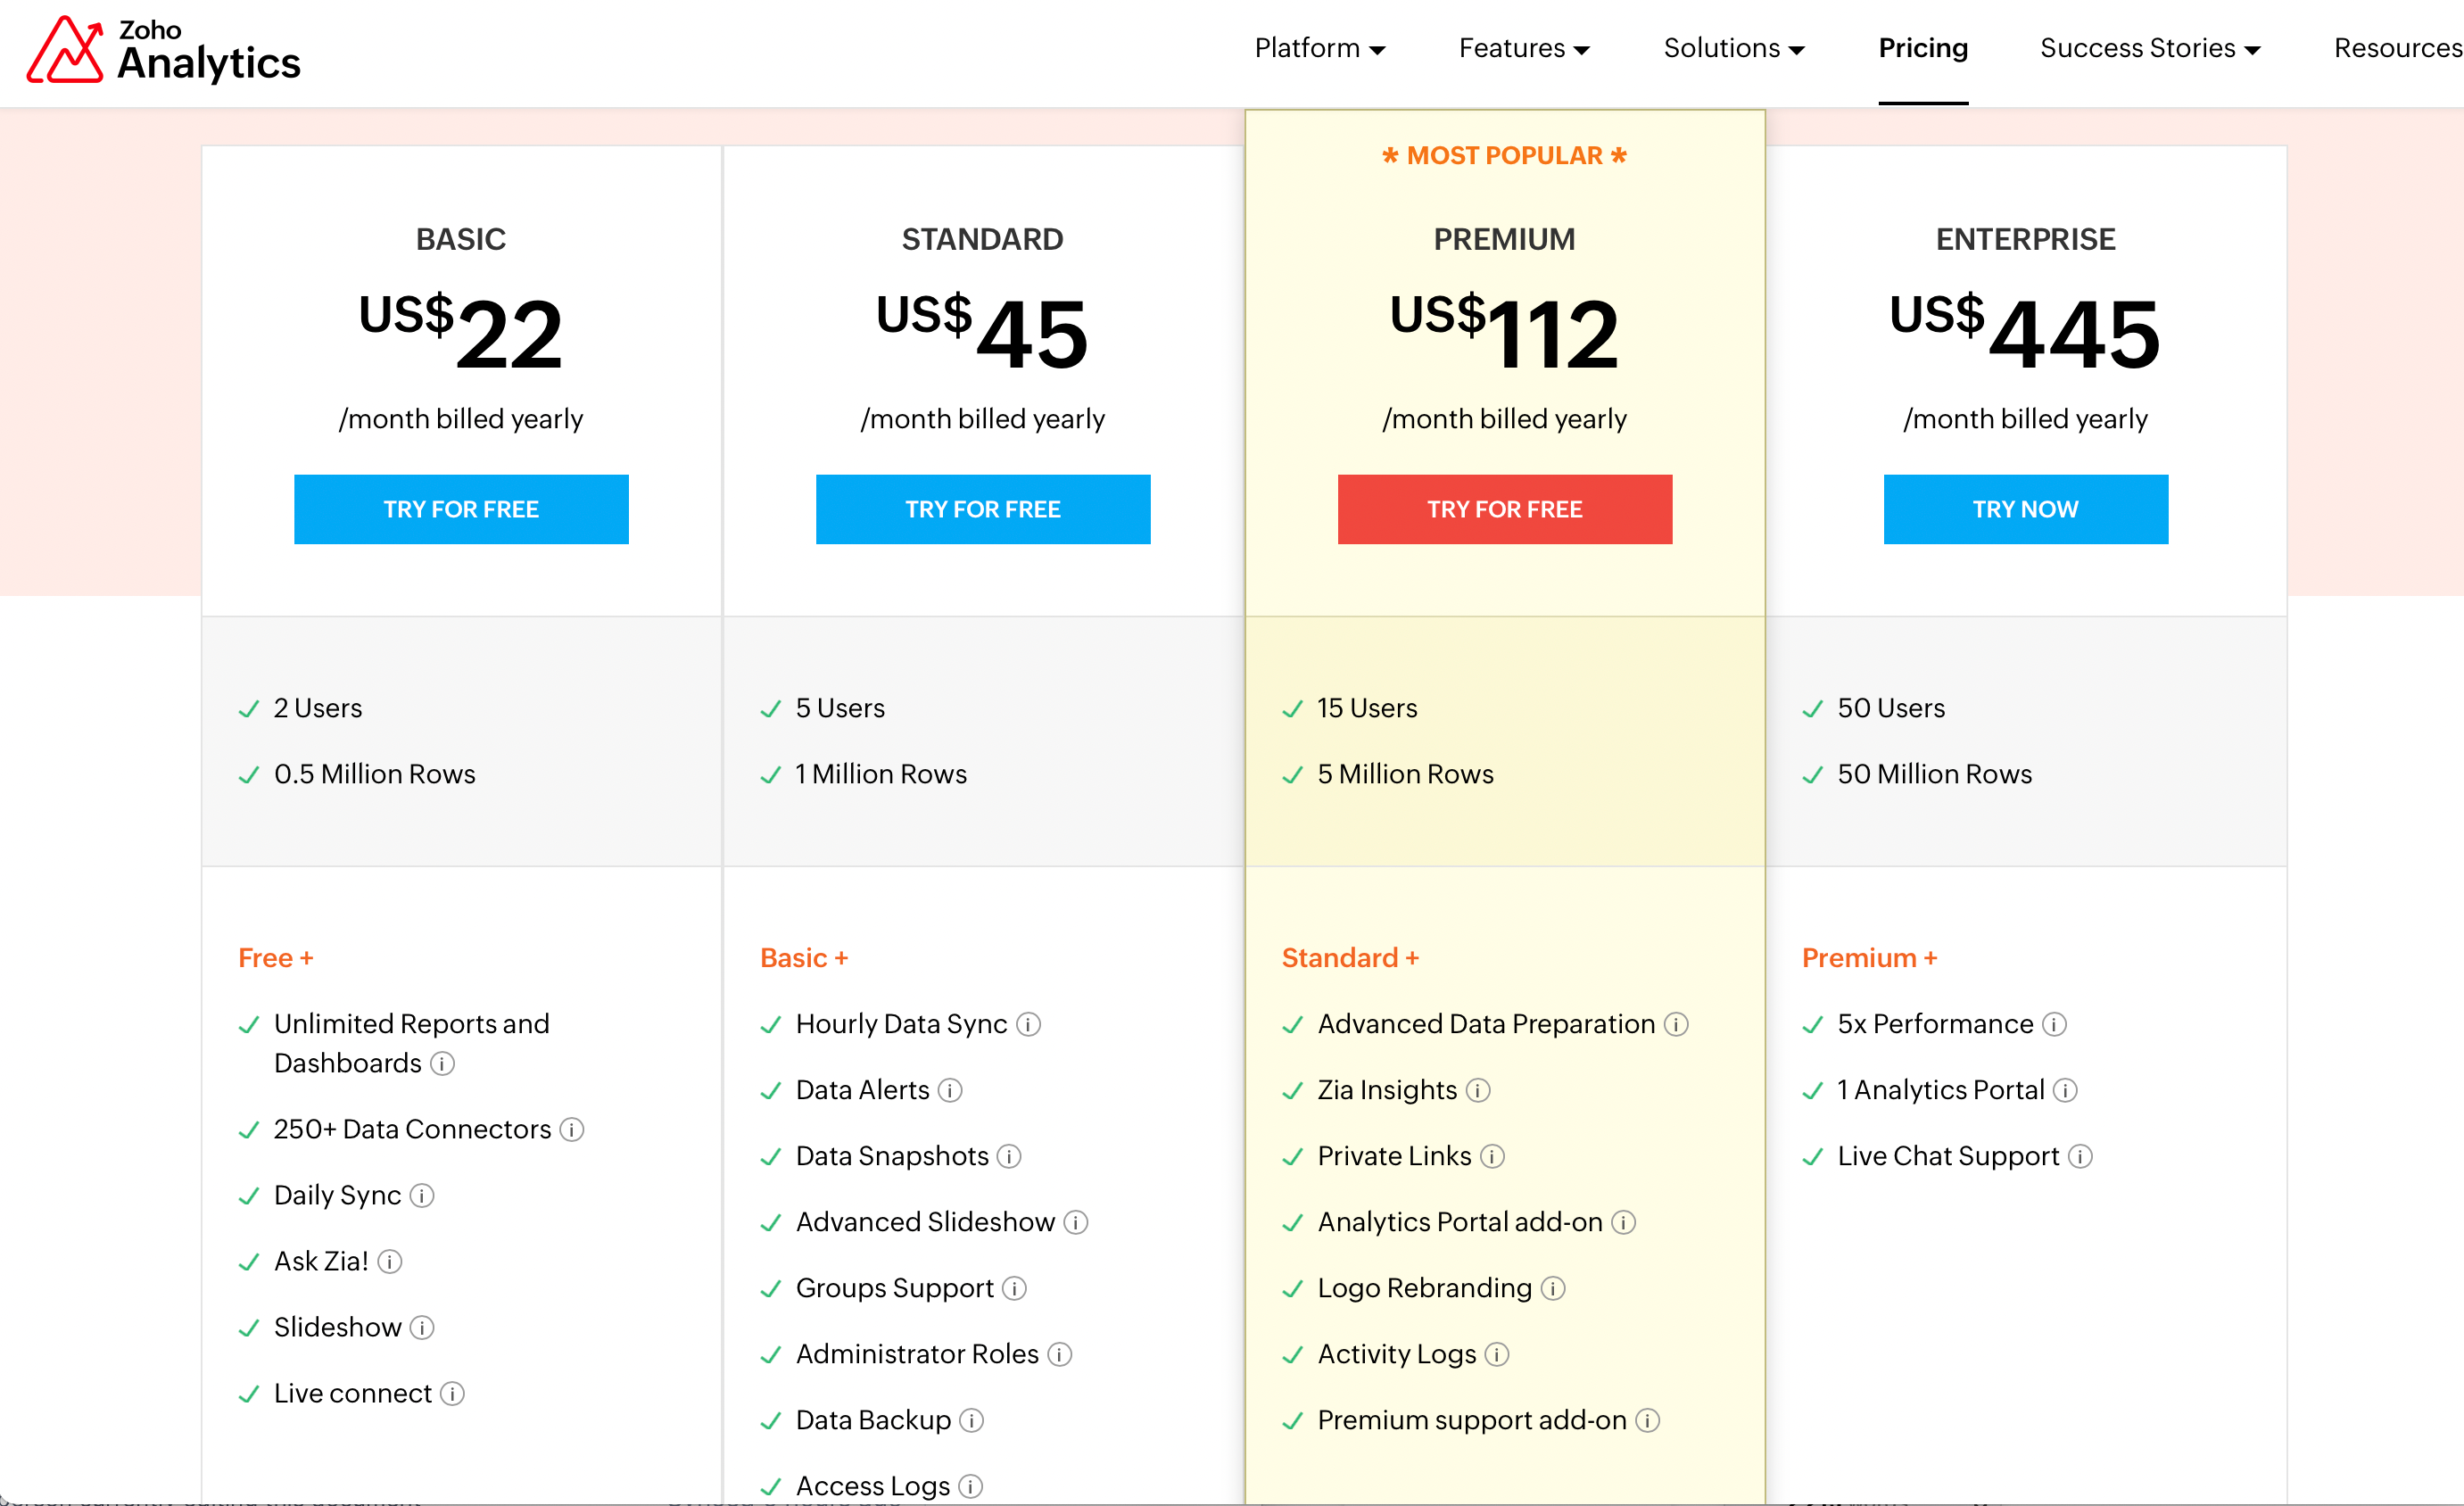
Zoho Analytics offers a free plan and 5 paid plans.
Cloud plans include:
- Basic costs $22 per month
- Standard costs $45 per month
- Premium costs $112 per month
- Enterprise costs $445 per month
On-Premise plans include:
- Personal which is a free plan
- Professional costing $30 per user/month
Zoho Analytics Key Features
Zoho Analytics’ key features include:
- Drag-and-Drop Interface: Zoho Analytics provides a user-friendly drag-and-drop interface for data preparation, transformation, and visualization.
- Wide Data Source Connectivity: The platform supports connectivity to a variety of data sources, including databases, spreadsheets, cloud services, web applications, and more.
- Data Preparation and Cleansing: It offers tools to clean, transform, and structure raw data.
Users can perform data cleansing, merging, and calculations to ensure the accuracy of their analysis and make better data-driven decisions. - Visualizations and Dashboards: Zoho provides a range of visualization options such as charts, graphs, pivot tables, and maps.
- AI-Powered Analytics: The platform incorporates artificial intelligence to provide smart insights, anomaly detection, and predictive analytics.
- Collaboration and Sharing: Zoho Analytics facilitates collaboration through data sharing, commenting, and annotations.
Let’s compare Zoho Analytics to Microsoft’s Power BI.
Zoho Analytics vs. Power BI
Power BI Benefits
- Better data analytics: Compared to Zoho, Power BI offers more advanced data analytics features and can handle deep analysis.
- Better security: Power BI offers better security options for those working with very sensitive data.
- More customization: Power BI is a lot more customizable than Zoho Analytics.

Zoho Analytics Benefits
- Better for beginners: Zoho Analytics automation features make it easier for beginners who don’t require customization to use.
- Better for Zoho users: If you are already using Zoho software, Zoho Analytics is an easier BI tool to use.
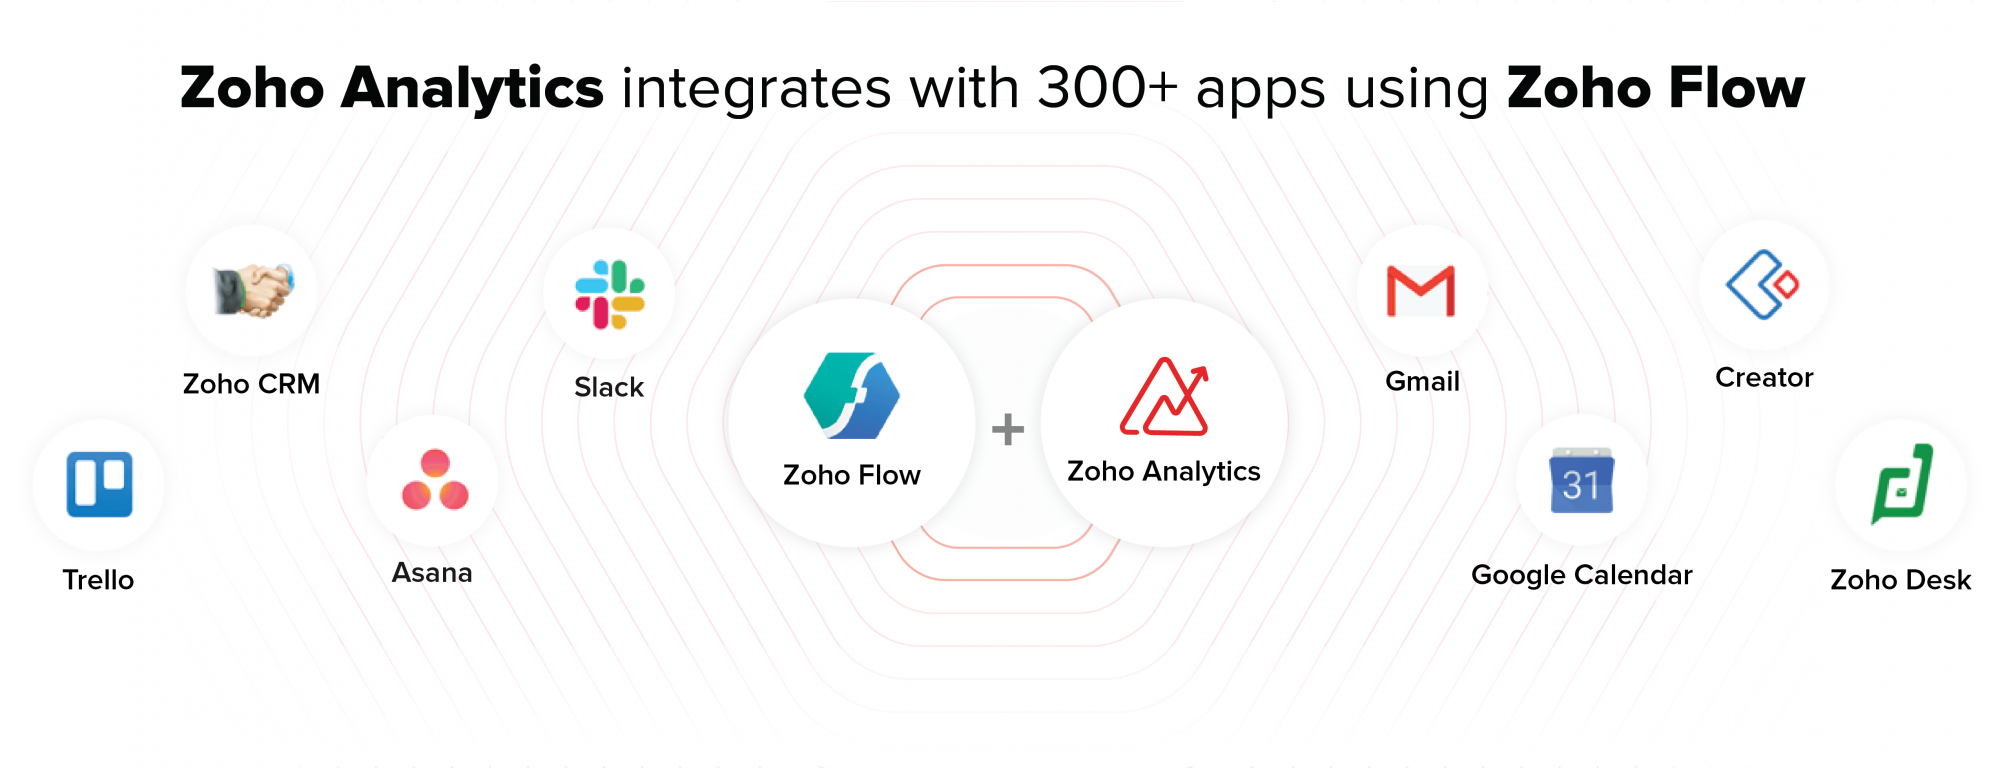
- More integrations: Zoho Analytics offers more integration options than Power BI with over 500 integrations.
Before you make your final decision on the BI tool for you, take a look at our final Power BI alternative.
5. Looker
Looker is a free and easy-to-use platform that enables users to turn data into customizable, shareable, and interactive reports.
It integrates with numerous Google products and other data inventories to provide a wide variety of visualization options.
Looker Cost
Looker generally offers quote-based plans.
Looker Key Features
Looker key features include:
- Data Exploration and Analysis: Looker allows you to explore and analyze data from multiple sources.
This enables you to uncover insights, predict trends, and gain a valuable understanding to make informed business decisions using your company’s data. - Custom Data Modeling: Users can create custom data models within Looker that define how data is organized, aggregated, and presented.
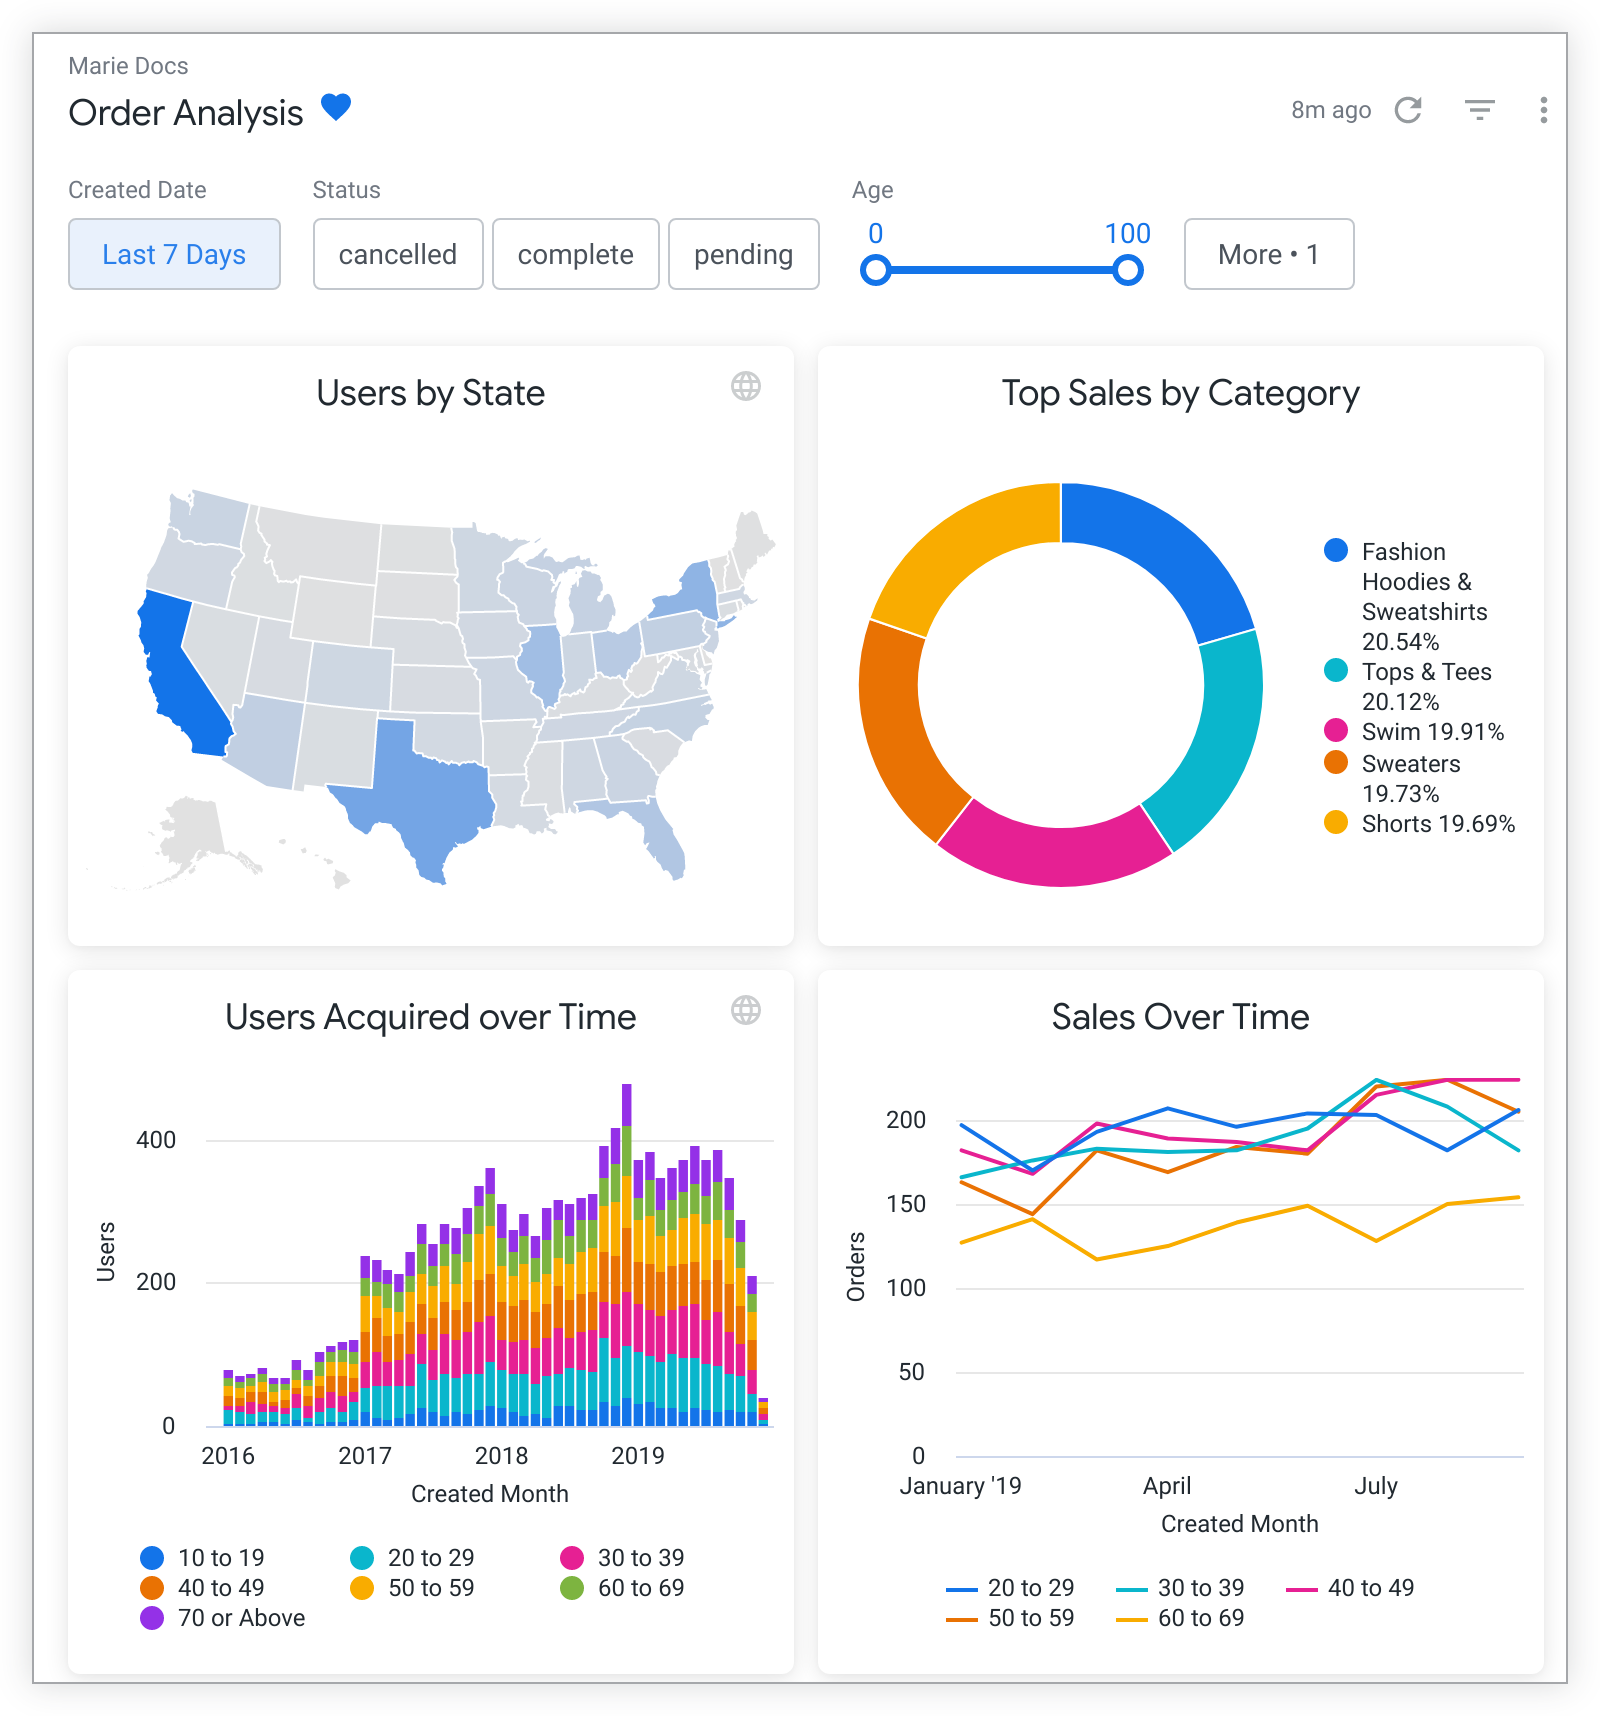
- Interactive Dashboards and Reports: Looker provides the tools to build interactive and customizable dashboards and reports.
- Collaboration and Sharing: The platform supports collaboration through features like data sharing, commenting, and annotations.
Users can work together on analyses and share insights with colleagues and stakeholders. - Embedding and Integration: Looker offers embedding capabilities, allowing users to embed Looker reports and dashboards directly into other applications, websites, or portals.
It also supports integration with other tools and platforms. - SQL-Based Query Language: It uses LookML, a proprietary SQL-like language, to define data models and transformations that can easily be ported to SQL databases.
- Data Governance and Security: Looker provides features for data governance, access control, and data lineage.
Organizations can manage data access, track data lineage, and ensure compliance with security and privacy regulations.
But which BI tool is better: Looker or Power BI?
Looker vs. Power BI
Power BI Benefits
- Better for Microsoft users: As a Microsoft product, Power BI easily integrates with other Microsoft products.
- Easier to use: Power BI is easier to use for non-tech users while Looker is a better tool for technical users
- Offers on-premise options: Looker is wholly cloud-based while Power BI offers on-premise options.
Looker Benefits
- Out-of-the-box solutions: Looker is known to offer better out-of-the-box data solutions as compared to Power BI.
- Third-party integration: Whereas Power BI is strong for integration within the Microsoft ecosystem, Looker has more integration options with other third-party platforms.
There you have it! 5 strong BI alternatives to Power BI.

There are, however, other BI tools that deserve honorable mentions.
Other Power BI Alternatives
As you search for the perfect BI solution for you, consider these other BI options as well:
After researching the top 5 Power BI alternatives and our honorable mention solutions, you should be in a good place to know the right solution for you.
Final Thoughts
In the world of data analysis and visualization, Power BI has made its mark as a leading tool. However, there’s a whole universe of alternatives out there, each with its own unique strengths.
Tableau stands out with its interactive visuals and easy-to-use interface, while Qlik Sense’s associative model makes data exploration a breeze.
Sisense offers Elasticube technology for handling complex data, and Zoho Analytics impresses with its customization options.
Lastly, Looker caters to advanced users with custom data modeling and embedding capabilities.
Remember, the best alternative depends on your specific needs and goals. Whether you’re seeking simplicity, advanced analytics, or seamless collaboration, these top 5 alternatives are ready to guide you on your data journey.
If you’d like to learn more about what you can accomplish with Power BI, check out the video below:
Frequently Asked Questions
Is there anything better than Power BI?
There have been several strong competitors to Power BI in the market. Alternatives like Tableau, QlikView, and Looker offer powerful data visualization and analysis capabilities.
These are viable options for businesses seeking alternatives to Power BI.
However, whether something is “better” depends on your specific business needs and preferences.
What programs are similar to Power BI?
Though there are other free alternatives to Microsoft Power BI available with similar features, Tableau and QlikView are two popular programs that are closely aligned with the functions of Power BI, offering robust data visualization, analytics, and business intelligence capabilities.
Is Tableau better than Power BI?
The superiority of Tableau or Power BI is subjective and depends on individual preferences, business requirements, and familiarity with the tools.
Both Tableau and Power BI are powerful data visualization and analytics platforms, and the better choice depends on specific needs and use cases.
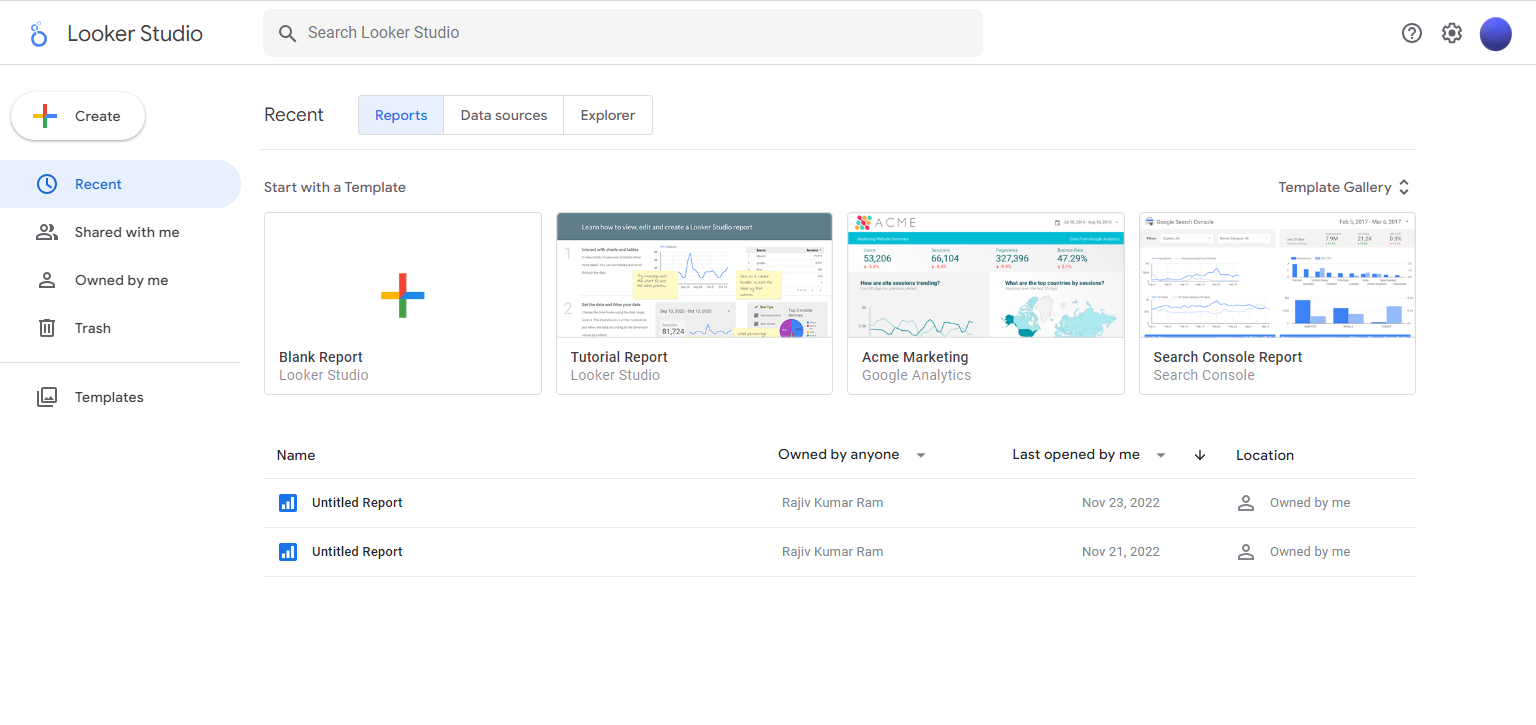
Is there a Google equivalent to Power BI?
Yes, Google offers a Google Data Studio, the platform that provides data visualization, dashboard creation, and reporting capabilities.
Google also purchased Looker which also offers a strong Power BI alternative.
While they may not be as feature-rich as Power BI, Google Data Studio and Looker integrate well with other Google services and can be excellent options for organizations that primarily use Google Workspace including Google Analytics.
Is it difficult to learn Tableau?
The difficulty of learning Tableau depends on the individual’s prior experience with data analysis and visualization tools.
For users with basic data skills, Tableau can be relatively straightforward to learn due to its user-friendly interface and extensive learning resources available online.
However, mastering more advanced features may require time and practice.
What are the best Linux-compatible alternatives for Power BI?
Power BI does not have native Linux support, but other business intelligence tools might work well on Linux.
Some popular Linux-compatible alternatives include Metabase, Apache Superset, and Knowage.
These tools offer a range of data visualization, reporting, and analytics capabilities and can be installed on Linux operating systems by your data team.


