Mudassir: For today, we have a very interesting problem to work with. The problem with this file is that it is fixed delimited by columns and I don’t know how to resolve this using Microsoft Power Query. You can watch the full video of this tutorial at the bottom of this blog.
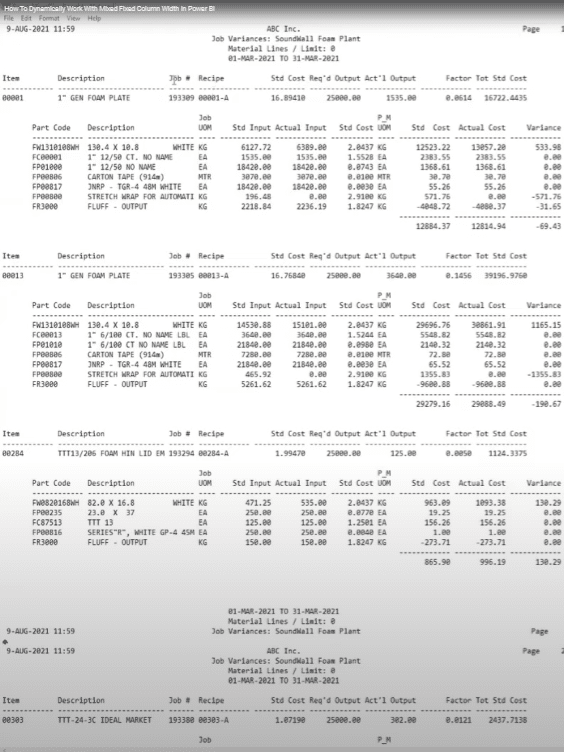
First, it wasn’t easy for me to delete the columns dynamically. Second, in this report, we have one table with a different column width, and then another table with a different column width.

So if I apply one delimiter dynamically on the top, I wouldn’t be able to get the data neatly. I want to get all of this data from the second table, and my product numbers from the first table. I also want the job number in each and every row of all the tables.
I tried to solve it on my own, but since this has something to do with power query I needed help from Melissa. I thought that it would take her at least two days, but she managed to come up with a solution right away.
Melissa will be showing us how she solved this complicated problem. I think most people will be dealing with these sorts of problems and are looking for ways how to solve them.
Melissa: The first tip is if you’re looking at a fixed-length file, you can go to the View tab and toggle that Monospaced option on.

We can see that it is a fixed-length font. We can also see the headers, initial tables, and subtables. These are the parts that we’re interested in and want to extract from.

Also, please make sure to have your formula bar enabled. It’s always a good thing to have it visible on your screen since we’ll be using it frequently to make slight modifications to the input.
I have created a parameter for the file location where I’ve stored the CSV file. I brought that in as a staging file and subbed it in my file location parameter. Then I created a reference and I’ll be working off from that reference. So that’s what we’re looking at right now in Microsoft power query.

Adding An Index Column
Usually, when I start working on a file like this, I will need to know the requirements of the client. I ask what the client needs, and what to look for.
In this case, we want the item number and the job number from the headers, and then we want all of the details that belong to that specific header.
We’ll need a key to bring those things back together. But if there’s no key present, then my go-to is to add an index column. I’ll click on the mini table icon, select Add Index Column, then add From 0.

I’ll be using a logic later on with lists, which have the 0-based index. Having your index start from zero actually means that you can reference the same row. Otherwise, you’ll have to subtract 1 to get to that 0-based position.
Then, we need to find the position where our headers are, which we can do quite easily because those headers are repeated constantly throughout the entire file.
To start, let’s copy this value:

Add a new blank query, paste that in, and call this the HeaderID.

I will do the same process for the subtables. I’ll copy that text string, create another blank query, and paste that value in. This is going to be the string we’ll use when looking for detailed rows.


If this process somehow changes the header for any of these tables, all I have to do is change one of the text strings and the file will work again.
I don’t really have to dive into the M code to search for that string that we’re looking for. We can just use this as a parameter.
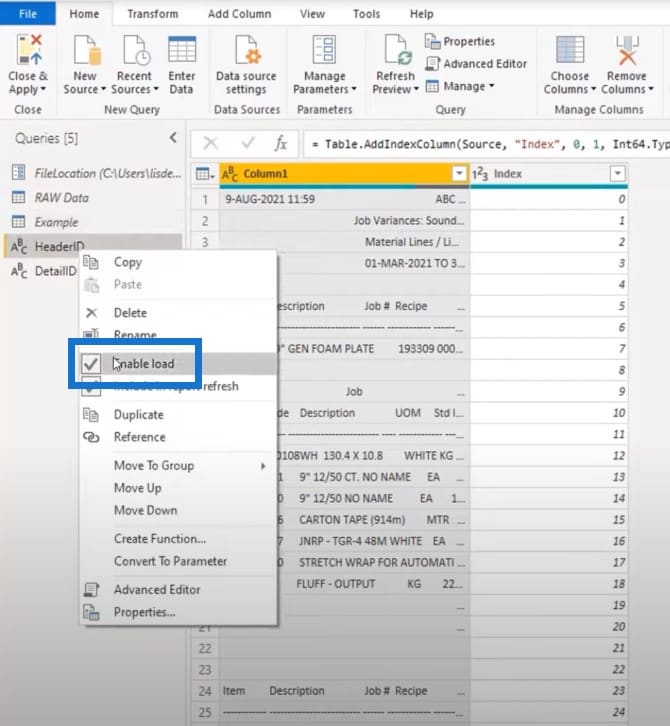
Let’s enable the load for these two queries.
Creating A Buffer List In Microsoft Power Query
The first thing I’ll do is to turn Column1 into a list by referencing and loading it into memory once. This way, I don’t have to make repeated calls to the file.
I’ll open the advanced editor and place it all the way at the top. When you use the user interface to build your code, it will reference the previous step.
When you place a buffer step anywhere else in your code and you want to make a modification, later on, it will help you make the changes to the step that you’re manually creating.
I’ll call this BufferList and reference Column1. To load it into memory, I’ll add a List.Buffer step.

Here’s my variable all the way at the top. I can reference it over and over again.

The first thing I want to determine is where my headers start because I need a key to keep these header sections and get a single value for all of those rows. To do this, I’ll add a custom column and call it Header.
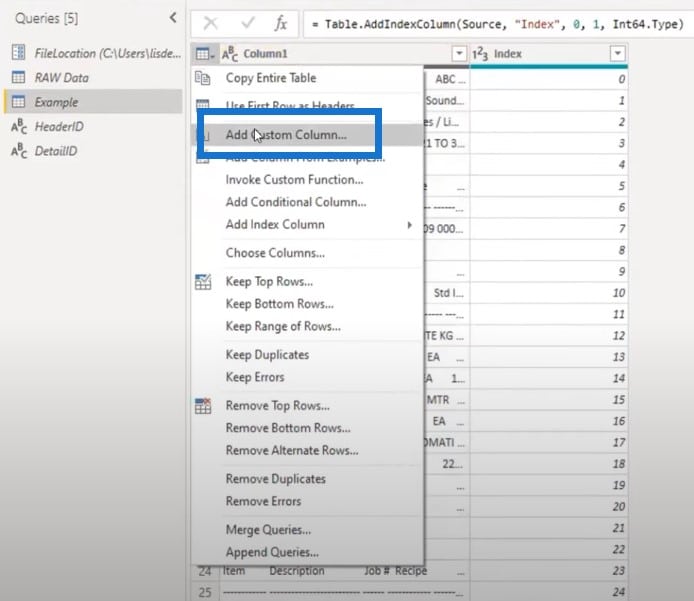
I’ll write that if Column1 is equal to our Header ID, then I want my index number to be null.
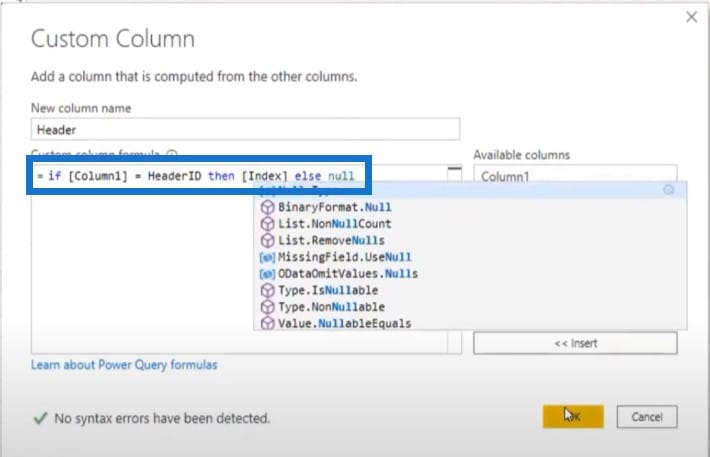
As a result, it found the text and returned 5 and 23.
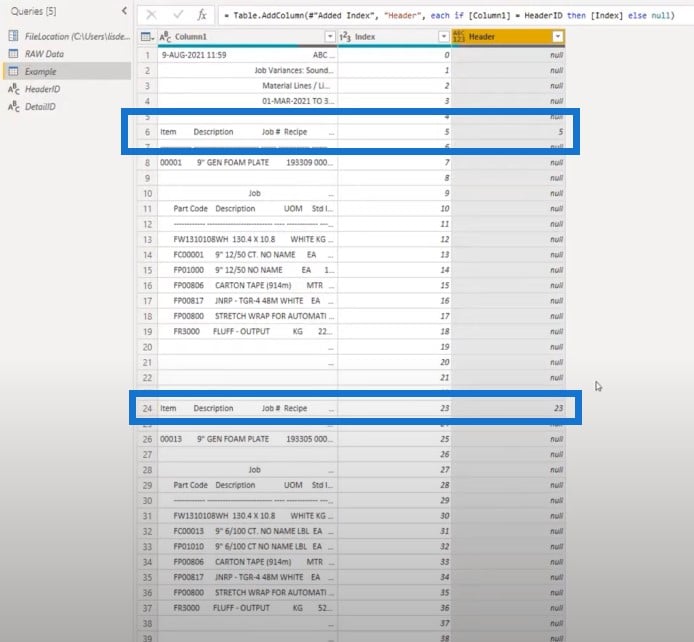
I need that value across all of the rows, so I need to fill that down. You can just right-click to fill down, but you can also use very simple syntax and add that in the formula bar.
In this case, I added Table.FillDown and in the text string, I indicated which column we want to fill down (Header).

Now, we have filled that down for all of the rows. We have a key for all of the header sections and all of the row sections because they all share this value.

Splitting Headers From The Rows
The next step is to split the headers from the rows. I’ll add another custom column and call it Temp. This time, we’re going to do something more elaborate and leverage off that BufferList that I created earlier.
We’ll be using a couple of lists functions to look at each of the positions and find if there’s a match to the index.
I’ll start with an if statement and use List.Contains to look for a specific position in the BufferList and reference the query HeaderID.
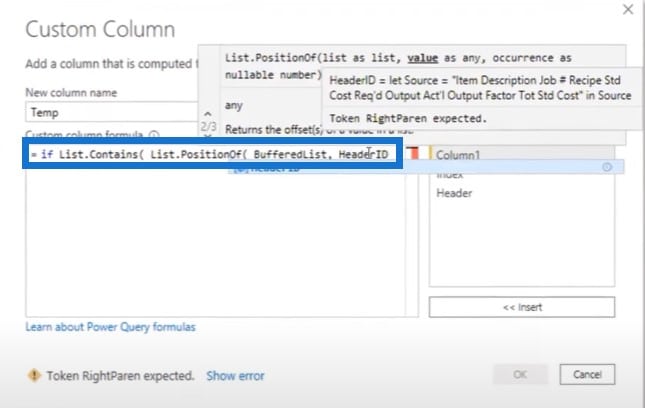
We want to find it across the entire length of the file, and then return the position of the item within the list. If it matches the index, we have a match for that specific row.
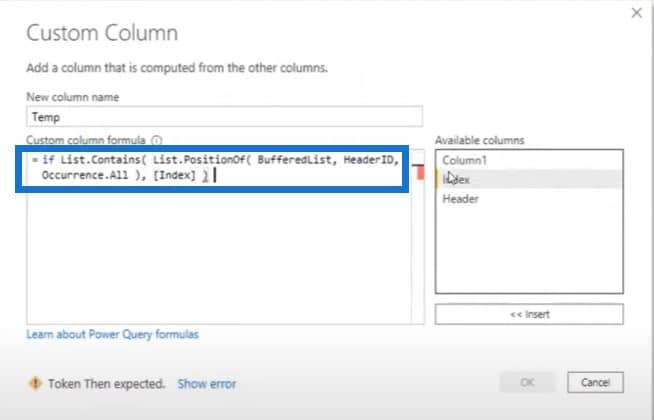
Then I want to return a value to identify the header. In this case, I’m just returning an H. I’ll copy the syntax so I don’t have to write it all over again.

We also need to identify the row section. If the list contains not the HeaderID, but the DetailID, then we’re on a row section.

If Column1 is an empty text string, then I want it to remain empty. If that’s not the case, then I want it to be null.

This opposition got the header row and returned an H, and then it found a detailed row and returned an R. Then it returned 0s for all the items that are shared within that row section.

These blanks or nulls are important because they allow you to fill down. Fill down won’t move across those blank cells so we can eliminate those later on.
We’ll do this in the formula bar and use Table.FillDown again. It wants a list with the column name, which is our Temp column.
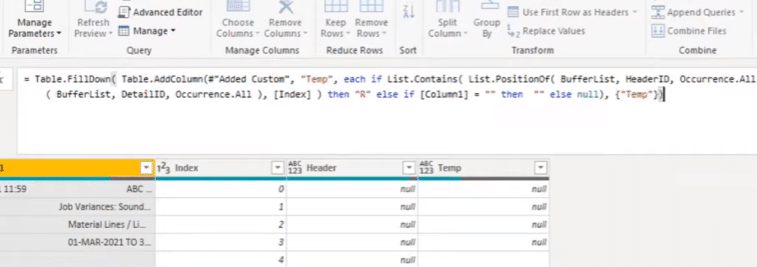
Now we have the H and R values repeated all over this column, which means we can actually split the headers from the detailed sections.
You can also fill it down from the user interface if you don’t want to write the code. You can just right-click and select Fill, then Down.
Removing The Nulls And Blanks In Microsoft Power Query
Now that we have this right, we can eliminate the things that we don’t need. Everything that is null or contains a blank is the rows that we don’t need and have to be removed. We can eliminate those by filtering.
Splitting The Sections
Once we remove those blanks and nulls, we’re left with everything that we need. At this point, we can just split the sections. We can focus on the header rows, and pick them out because they have a separate spacing from all of the detail rows (which have a separate spacing as well).
I’ll add a new step in the formula bar which allows me to create another filter on that same column. In this case, I’ll just keep all the header sections.
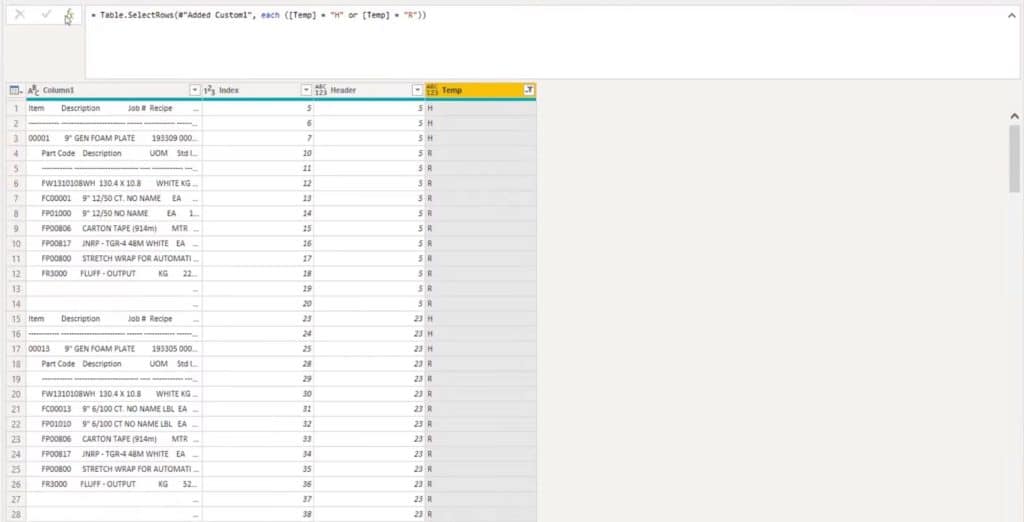
Now, I have all those header rows here.
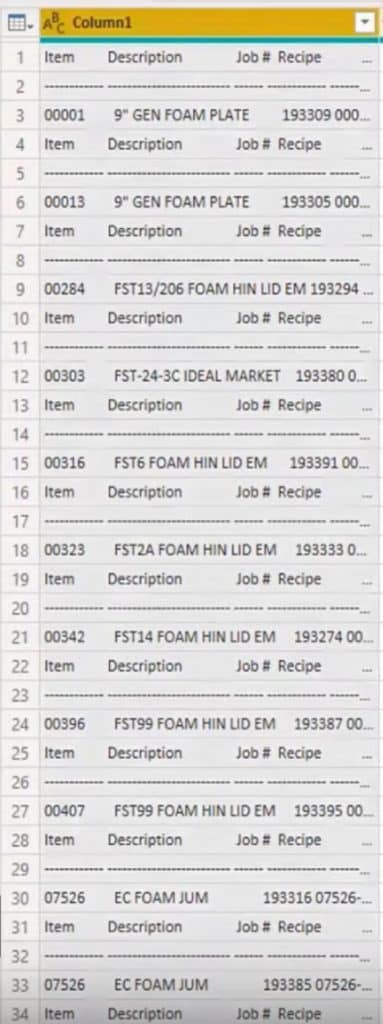
I can select Column1, go to the formula bar, select Split column, then split by positions.
Then have power query itself figure this one out. It will suggest a couple of positions. Click OK to accept those positions.
The only things we’re interested in from the headers are the item and the job number.
Inside the formula bar here, I can rename those with Item and Job #. This will save me from another rename column step.
After this step, all I have to do is select the Item, select the Job #, and of course, select our header key. Then I will remove all the other columns because I no longer need those.
This will be the result. We still need to clean up the values and remove the text item and dashes. All we want is those values in between.
So we open this up and unselect the dashes and items.
Now, all the headers are done.
We have to do the same process for DetailID too. I’ll need to rename those steps so that it will be easier for me to go back to it a little later.
We’ll traverse back to the initial query that we started. We started with Filtered Rows in the Applied Steps pane.
I’m going to copy this and add it to my filter. This time, I’m not selecting H but I’m selecting the R.
Then I’ll select Column1, go to the Split column, split by positions, then have power query figure it out.
This is what power query suggests. Let’s give this a try.
This actually looks pretty good. Even the total rows split up perfectly. Of course, there are a lot of spaces because we had that indentation.
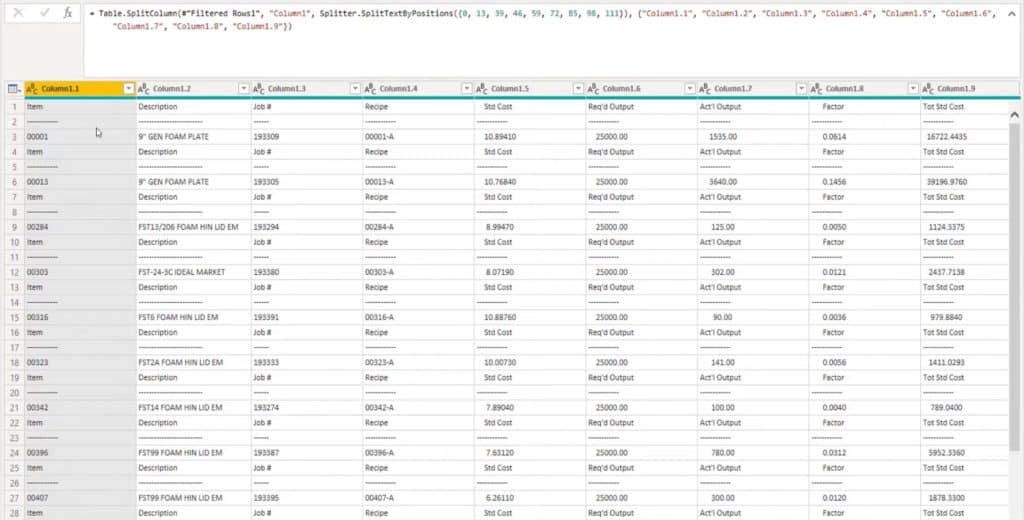
Trimming The Text Strings In Microsoft Power Query
I’ll select that first column, then press Down + Shift to select until Column 1.10. Go to Transform, select Format, then Trim. Trimming will only remove the excess spaces in front or at the end of the string, not in between.
Next, we can just promote the headers, so I don’t have to type all of the headers or the titles for these columns. In the split step, I renamed two columns. Now, of course, with 10 columns, that’s a bit of a bother.
We also have to get rid of those excess values. Because we have totals, I have to use one of these last three columns because they’re the only rows that have the additional values somewhere in between. Then we’ll deselect those blanks, dashes, and texts.
Then I’ll remove the unnecessary columns so all that remains is a table with only the headers and only the details. We need a key to bring those sections back together again.
For that, we can use a self-merge so we can merge the table with itself to bring that information back together. On the Home tab, select Merge, then select Column 5 and the same query.
Instead of AllDetails, I want AllHeaders as my initial table that I want to merge with.
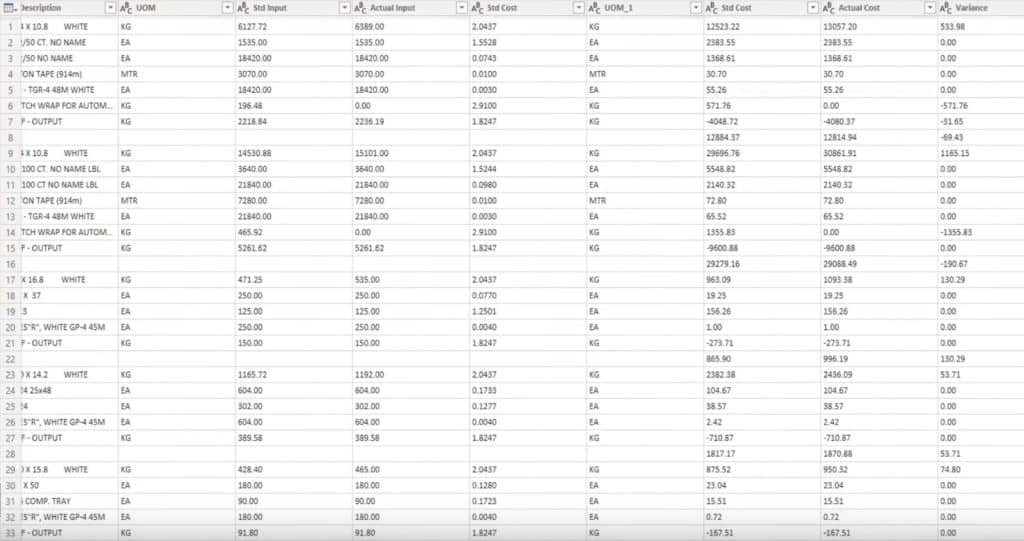
This has brought back all of the information from the header table with a single row for each item and each job number.
We used a key to merge with the detail rows. If I press off to the side in the white space here, we’ll see a preview of all of the rows that belong to Header 5.
We’ll remove the final column here and then we’re done fixing the mixed fixed column width in Microsoft power query.
***** Related Links *****
How To Split Multi-Lined Excel Cells In Power BI
Power Query M Language Tutorial And Mastery
Create New Records Based On Date Fields
Conclusion
In this tutorial, we came up with a way to resolve mixed fixed column width issues using Microsoft Power Query. If you enjoyed the content covered in this particular tutorial, please don’t forget to subscribe to the Enterprise DNA TV channel.
We have a huge amount of content coming out all the time from myself and a range of content creators, all of whom are dedicated to improving the way that you use Power BI and the Power Platform.
Melissa
[youtube https://www.youtube.com/watch?v=OMDhc5OJ4vU&t=73s?rel=0&w=784&h=441]


