We’re going to get advanced today. We’re going to really dive deep into customer churn: new customer and lost customer analysis in Power BI. You may watch the full video of this tutorial at the bottom of this blog.
Another term for this is attrition analysis because we want to see how our customer are churning, how many of our customers are coming on board and buying our products, how many are coming back and buying some more, how many customers we are losing, and so forth.
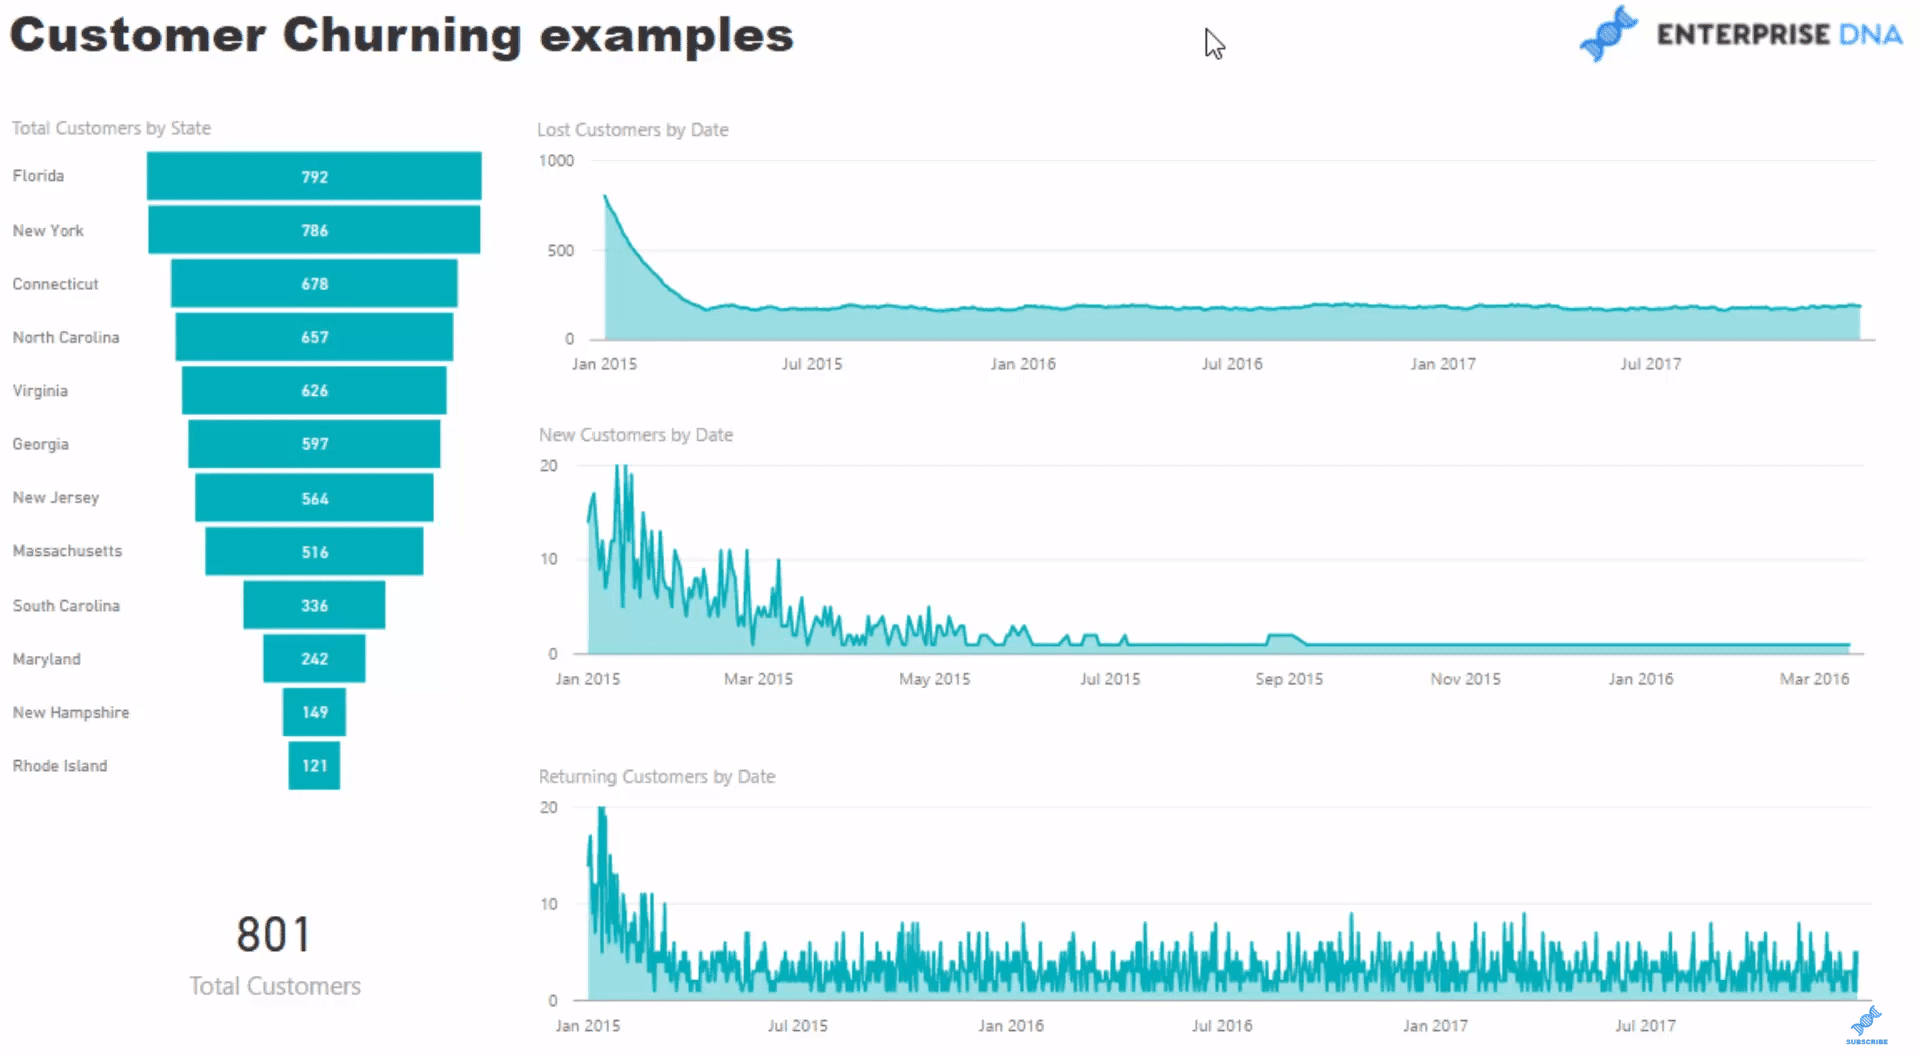
There are so many great insights that you can achieve with this type of quite advanced analysis, which is why I wanted to spend a bit of time getting in-depth with the DAX language and DAX formulas.
In this customer analysis example, I start off going through customer churn and exploring how many customers are being lost after a certain time frame. I also dive into new customers and returning customers.
Analyzing your customer churn is a very key piece of analysis for an organization, especially if you’re a high-frequency selling business like an online retailer or a supermarket chain.
Obviously, if you get customers on board, you want to be selling them more and not losing them to competitors, for example.
It’s much easier to sell to an existing customer than it is to find new customers.
Existing customers are crucial to most businesses as it’s so much more profitable to continue to market to them as opposed to having to find new customers all the time.
Finding Lost Customers
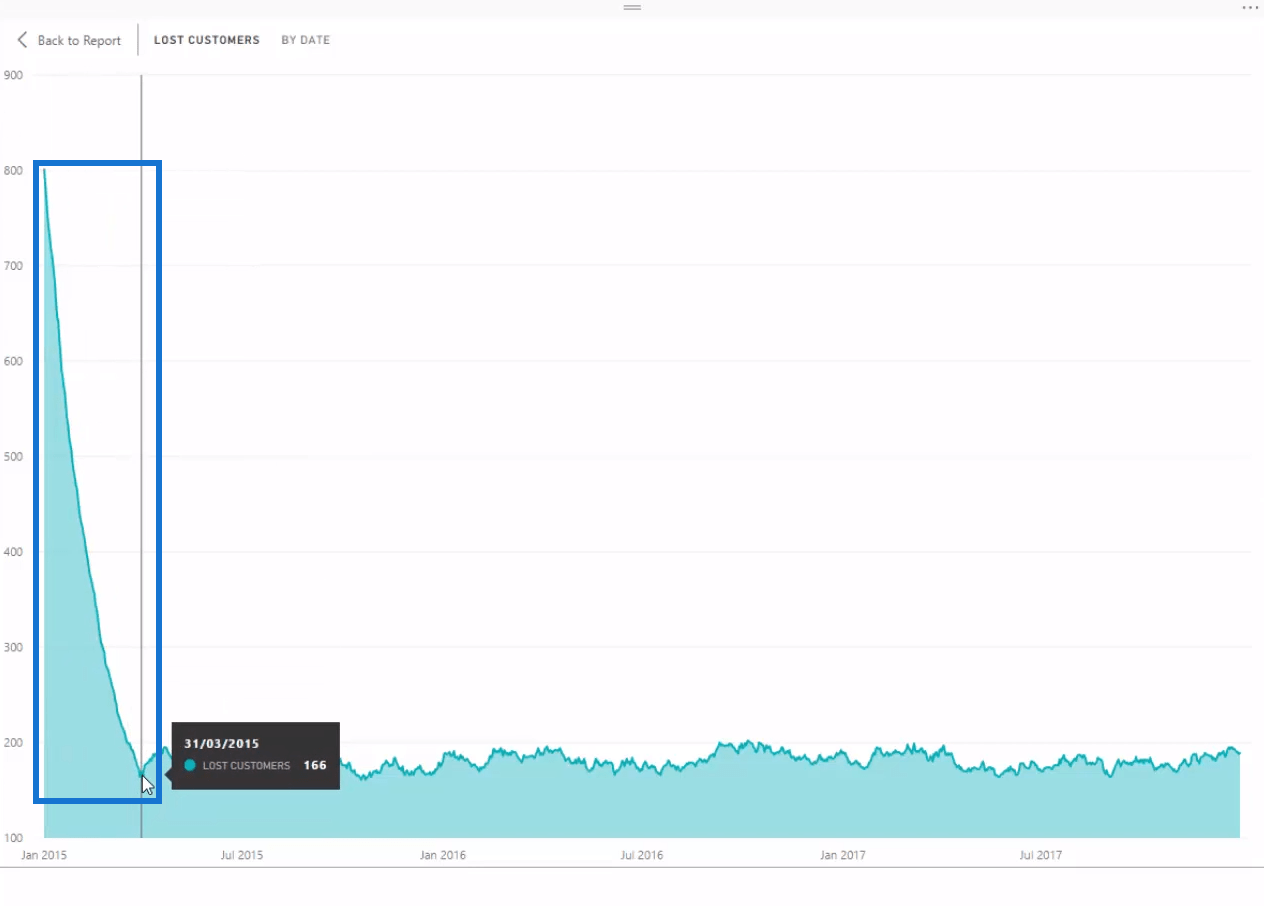
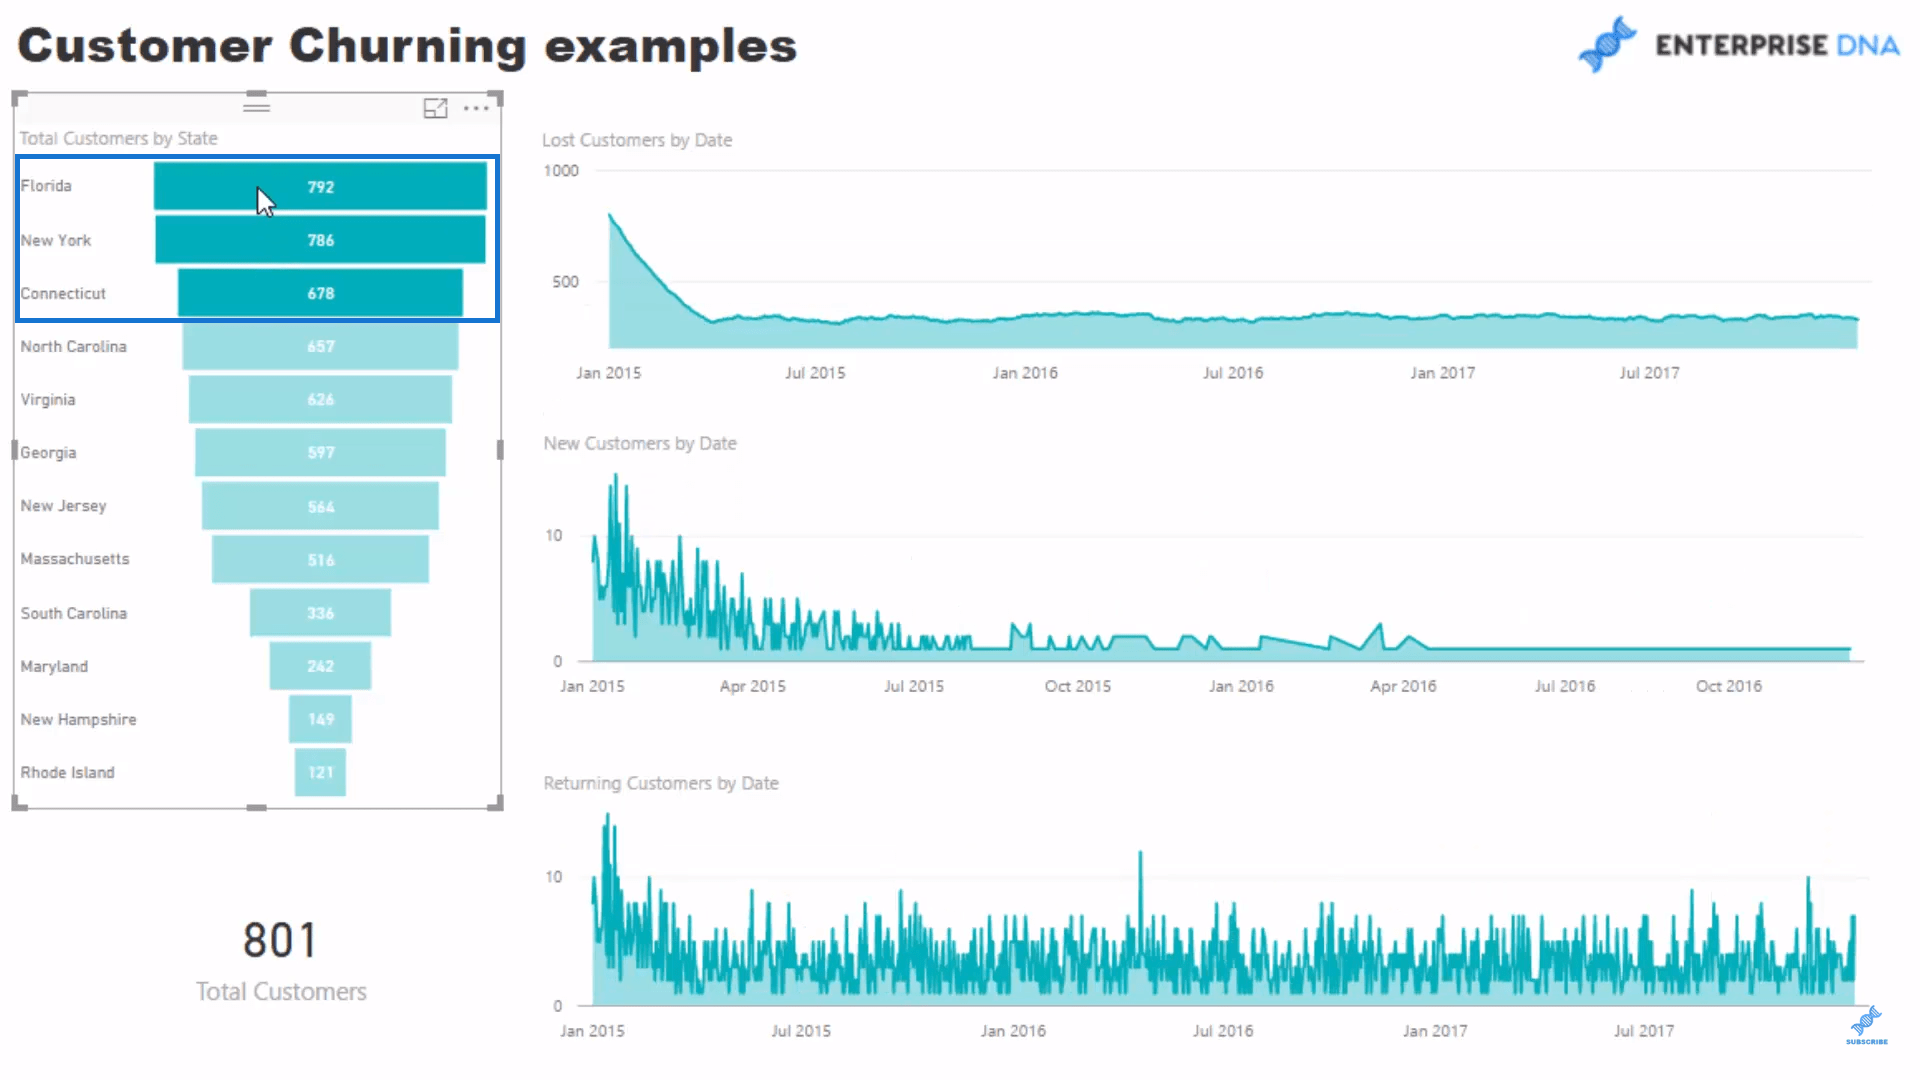
In this first visualization here, we have what we would consider overtime Lost Customers.
This point down to just about 90 days is not as relevant because when we’re at the very first days, we’re actually considering everyone as “lost” at the moment.
Now let’s walk through the function to see what we are doing here.
In this formula, we are counting up the customers who have not purchased for the last 90 days, or whatever is your variable churn date.
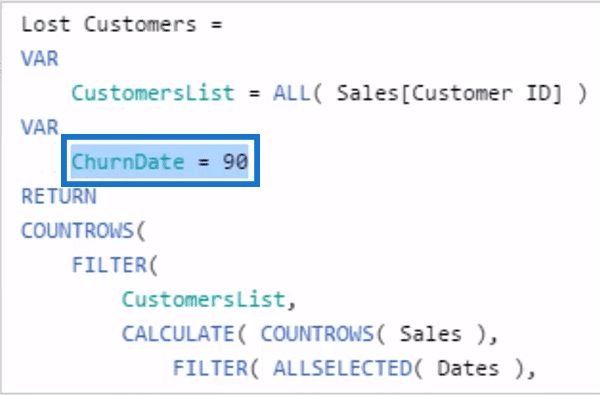
We are creating a virtual table on every single customer through this CustomersList variable.
We filter all customers for any day. And what we’re doing with ALL is that we’re actually looking at every single customer in each individual day.

And then for every single customer, we’re evaluating if they have made a purchase on the last 90 days. If they have not, then that’s going to evaluate to 0 and count that customer.

Isolating New Customers
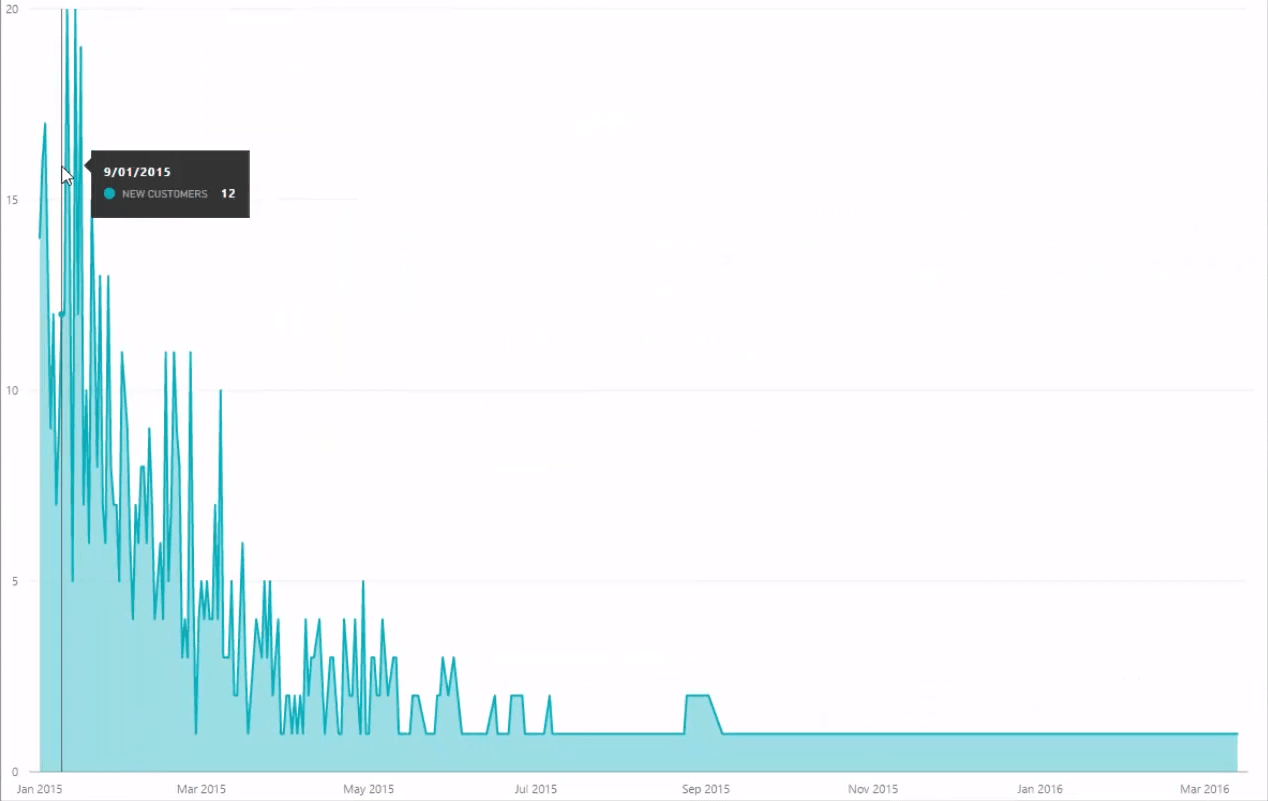
Now let’s look at our New Customers and see what it is evaluating to.
In this table, we see that it’s more on the earlier dates, January to July because we just started our business. People are generally new.
Then obviously, it flattens out towards the end because we just have our return customers there.
Its function is doing similar logic. We are counting out how many customers have made a sale before today.
And if they have not purchased anything, which is going to evaluate as 0, then it evaluates as New Customer.

Knowing Who Are Returning Customers
Returning customers are those who have been evaluated as lost.
In other words, they haven’t bought anything for 90 days. Through time, we will calculate how many are actually returning.
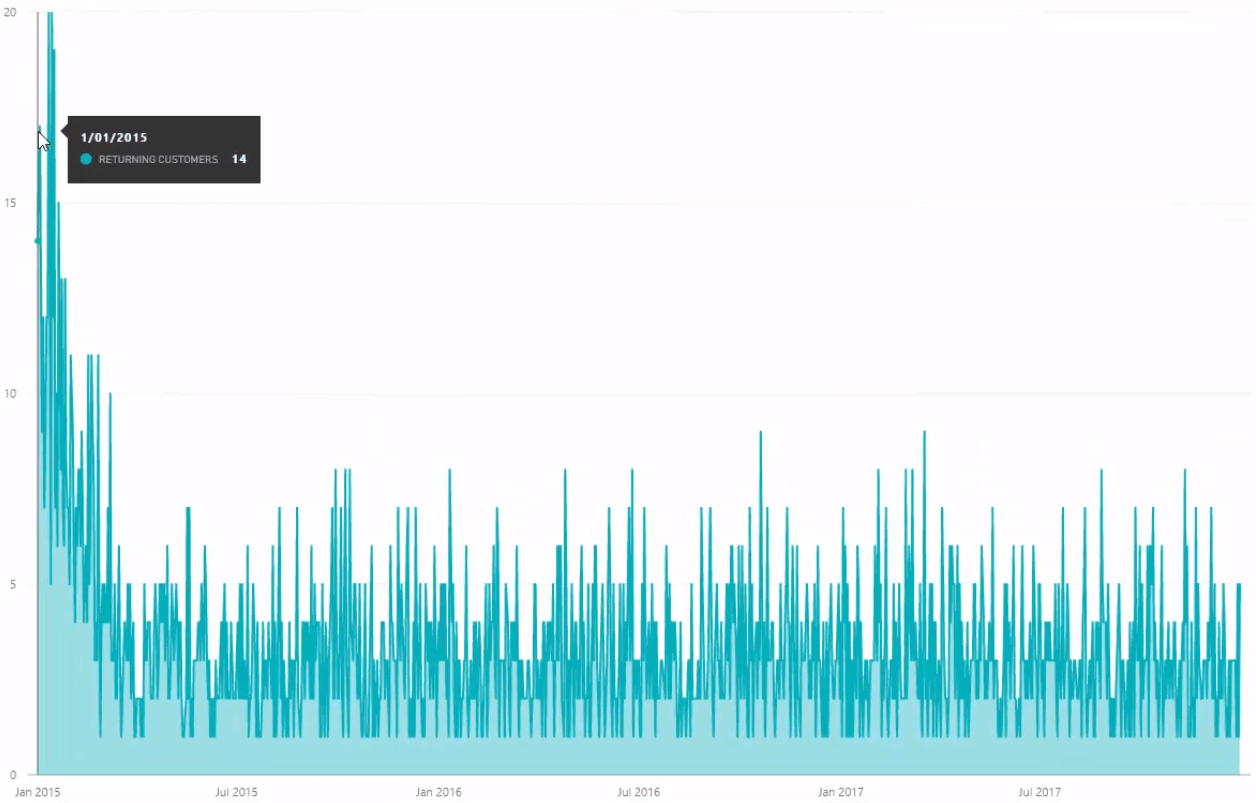
This would be an amazing insight if you are running promotions or doing marketing, and you want to know how many of these lost customers you got back through your marketing activities.
In the Returning Customers formula, we’re only evaluating customers that actually purchased on any given day.

So here we are running some logic on each customer, evaluating if they made a sale in the last 90 days.
If they didn’t purchase for the last 90 days, then they are considered returning. Then, evaluate to true, and count out that customer in that particular day.
***** Related Links *****
Analyze Who Your Lost Customers Are Using Power BI & DAX
Customer Trend Analysis in Power BI Using DAX
Discover How Many Sales Can Be Attributed To New Customers – Advanced Power BI Insights
Conclusion
This tutorial on Power BI customer analysis is pretty advanced in DAX calculations. This just showcases the analytical power that you can have with Power BI.
In the past, this sort of information would cost a lot of money to generate. But now, you could achieve these awesome insights through some clean and effective formula, utilizing the DAX language.
Remember that it actually aligns with the data model. Everything is incorporated in there.
We can actually place some filters on this. For instance, we want to dive into just one state, say Florida, or our top 3 states, it all evaluates dynamically.
I dive into so many techniques in the video. Some are very advanced, but certainly you want to get exposure to these things.
If you can see the opportunities and potential with Power BI, then your mind can just exponentially expand with the possibilities of running analysis over your own data sets.
As a side-note, I cover a variety of all the most advanced Power BI techniques that you can think of in the Advanced Analytics course at Enterprise DNA Online, so check that out when you can.
All the best and good luck with these techniques.
Sam


