In this tutorial, I’m going to show you how to create a dynamic total CRM forecast within a specified date range. You may watch the full video of this tutorial at the bottom of this blog.
Let’s say for example, you want to find out the forecast in a particular month. You want to know how many forecasts there are for the rest of the month from today until the month’s end. As you move from one day to the next, the CRM forecast amount is going to change.
You want to be able to dynamically calculate this total forecast within the beginning and end date you’ve specified.
This technique is highly relevant for CRM systems especially when you’re trying to manage monthly targets. You’ll see what you need to achieve from a sales and team perspective.
Calculating Total CRM Forecast
When trying to work this out, it’s possible you might get confused with the context of your calculation.
Because you want to look at a particular month at any point in time, the model should be dynamic.

So, for this particular case, you need to get rid of the context coming from the Dates. Instead, you should apply the context within the formula.
1. Build DateRange
Let’s look at the formula:

The solution is to simply build a DateRange. You need to create a DateRange and context within the formula. You need to build it using Variables.
2. Use TODAY Function
You keep the formula dynamic by utilizing the TODAY function.

It’ll always return the date today.
You’re also be able to work out what the End Of The Month date is by using TODAY.

So, I now have StartDay and EndDay. This gives the desired beginning and end date within the DateRange.

3. Use The DATESBETWEEN Function
Using the time intelligence function DATESBETWEEN enables you to open up a dynamic window.

I’m going to use the previous variables that I’ve created within the DateRange variable. So, it’s simply referencing variables within variables.
Variables can be very effective to use because you can layer them.
So, within this part of the formula, there’s now a time intelligence function DATESBETWEEN which gives us a DateRange between Today, the Current Date, and the Month based on Today. This will adjust from a day-to-day perspective.
4. Add The CALCULATE Function
At the bottom of the formula, there’s the RETURN function. This is where you need to use CALCULATE.
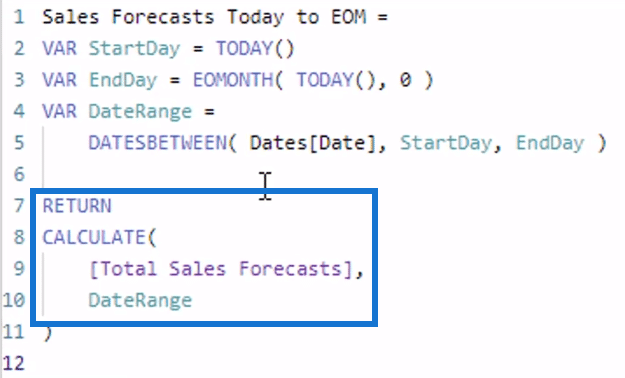
The CALCULATE function can change the context of the calculations.
For instance, Total Sales Forecasts are all of these particular results shown in the table.

These results are currently filtered by every single Date in the table regardless of the multiple months in the data.
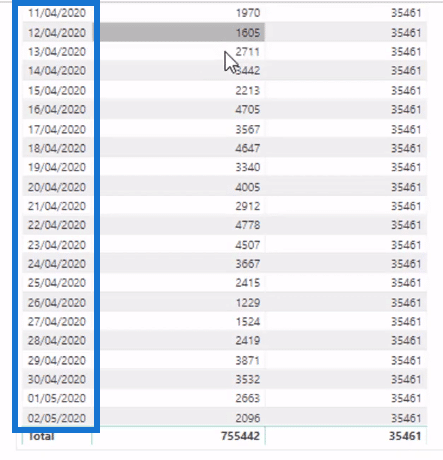
So now, you need to accumulate and count up the amount of Sales within the date window.
This is done using the CALCULATE function.
All you need to do is input the variable DateRange inside CALCULATE.
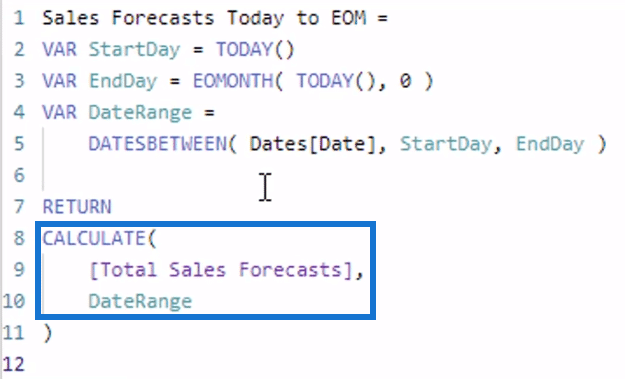
This date window has changed the context of the calculation. You’re now only calculating Total Sales Forecasts from today until the end of the current month.
***** Related Links *****
Creating Forward Forecasts in Power BI Using DAX
Create A New Table In Power BI: How To Implement Budgets & Forecasts Automatically Using DAX
Power BI Custom Calendars: Calculating For Month On Month Change – 445 Calendars
Conclusion
This solution is great to use because of its simplicity. It’s a seamless and intuitive technique using the CALCULATE function along with the time intelligence functions inside it.
This tutorial highlights very relevant concepts like the context, the CALCULATE function, and the time intelligence functions.
These three combined are crucial elements in your models. You must consistently combine them well inside Power BI to get good insights out of your reports and data scenarios.
All the best,
Sam
[youtube https://www.youtube.com/watch?v=8MZ7nQFlmVs?rel=0&w=784&h=441]


